Data Labels
1 Dec 20176 minutes to read
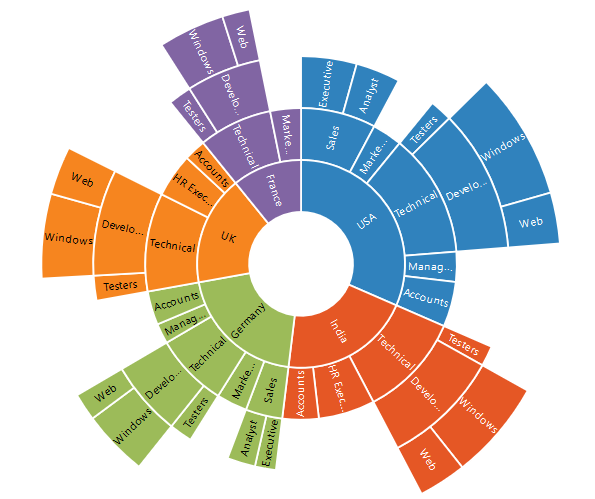
Sunburst data labels are used to display the data related to the segment. It helps to provide the information about the data points to the users.
You can enable or disable the data labels by setting the visible property of the dataLabelSettings to true as shown in the below code
"use strict";
 var dataLabelSettings = { visible:true};
 ReactDOM.render(
    <EJ.SunburstChart id = "sunburst1"
    dataLabelSettings ={dataLabelSettings}
    >
    </EJ.SunburstChart>,
          document.getElementById('sunburst')
);
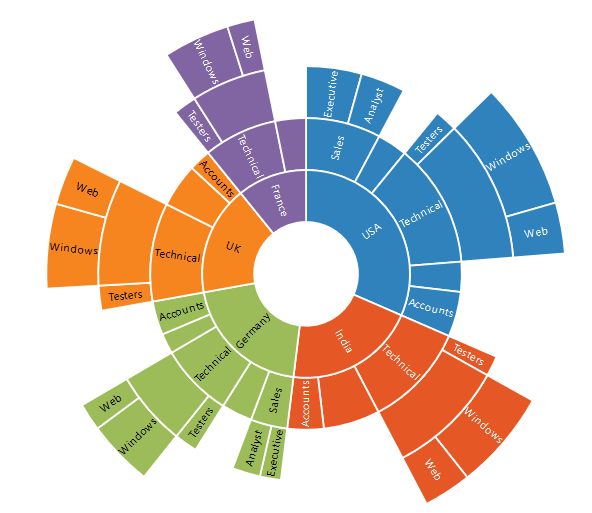
Label Overflow mode
When you represent huge data with data labels, they may intersect each other. You can avoid this using the labelOverflowMode property.
The following properties are used to avoid the overlapping.
- Trim – To trim the large data labels.
- Hide – To hide the overlapped data labels.
The following code shows how to set Hide and Trim mode.
"use strict";
 var dataLabelSettings = { visible:true,labelOverflowMode:"hide"};
 ReactDOM.render(
    <EJ.SunburstChart id = "sunburst1"
    dataLabelSettings ={dataLabelSettings}
    >
    </EJ.SunburstChart>,
          document.getElementById('sunburst')
);
"use strict";
 var dataLabelSettings = { visible:true,labelOverflowMode:"trim"};
 ReactDOM.render(
    <EJ.SunburstChart id = "sunburst1"
    dataLabelSettings ={dataLabelSettings}
    >
    </EJ.SunburstChart>,
          document.getElementById('sunburst')
);
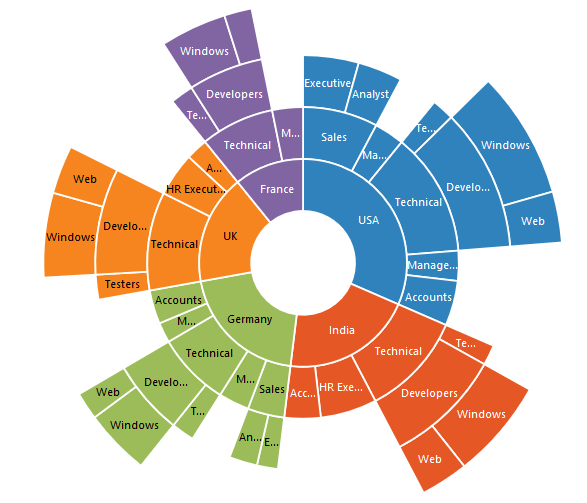
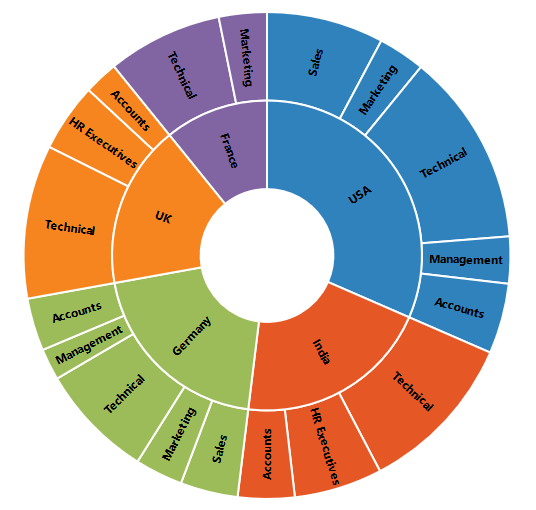
Label Rotation Mode
You can rotate the data label by using labelRotationMode property. By default, the labelRotationMode is set as angle.
The following code shows how to set labelRotationMode as normal and angle.
"use strict";
 var dataLabelSettings = { visible:true,labelRotationMode:"normal"};
 ReactDOM.render(
    <EJ.SunburstChart id = "sunburst1"
    dataLabelSettings ={dataLabelSettings}
    >
    </EJ.SunburstChart>,
          document.getElementById('sunburst')
);
"use strict";
 var dataLabelSettings = { visible:true,labelRotationMode:"angle"};
 ReactDOM.render(
    <EJ.SunburstChart id = "sunburst1"
    dataLabelSettings ={dataLabelSettings}
    >
    </EJ.SunburstChart>,
          document.getElementById('sunburst')
);
Customizing the data labels
You can customize the appearance of the data point using the font property.
"use strict";
 var dataLabelSettings = {visible: true, font: {color:"black",fontWeight:"bold",size:"15px"}};
 ReactDOM.render(
    <EJ.SunburstChart id = "sunburst1"
    dataLabelSettings ={dataLabelSettings}
    >
    </EJ.SunburstChart>,
          document.getElementById('sunburst')
);
Sunburst Chart Title & Subtitle
Title & TextAlignment
By using the title option, you can add the title-text as well as customize its title-border, title-background and title-font.
You can change the title alignment to center, far and near by using the title-textAlignment property of the Title.
"use strict";
 var title = {visible: true, font: {color:"black",fontWeight:"bold",size:"15px"},
 border:{color:'green',width:5}};
 ReactDOM.render(
    <EJ.SunburstChart id = "sunburst1"
    title ={title}
    >
    </EJ.SunburstChart>,
          document.getElementById('sunburst')
);
Sub Title & TextAlignment
By using the subTitle option, you can add the title-subTitle-text as well as customize its title-subTitle-border, title-subTitle-background and title-subTitle-font.
"use strict";
 var title = { subTitle:{visible: true, font: {color:"black",fontWeight:"bold",size:"15px"}},
 border:{color:'green',width:5}};
 ReactDOM.render(
    <EJ.SunburstChart id = "sunburst1"
    title ={title}
    >
    </EJ.SunburstChart>,
          document.getElementById('sunburst')
);