Getting Started
4 Nov 20165 minutes to read
This section explains you the steps required to populate the PivotTreeMap with data source. This section covers only the minimal features that you need to know to get started with the PivotTreeMap.
Script and CSS Reference
Create a HTML page and add the script and CSS references in the order mentioned in the following code example.
<!DOCTYPE html>
<html>
    <head>
        <!-- Essential Studio for JavaScript  theme reference -->
        <link rel="stylesheet" href="http://cdn.syncfusion.com/14.3.0.49/js/web/bootstrap-theme/ej.web.all.min.css" />
        <!--  react script  -->
        <script src="https://cdnjs.cloudflare.com/ajax/libs/react/15.2.1/react.js"></script>
        <script src="https://cdnjs.cloudflare.com/ajax/libs/react/15.2.1/react-dom.js"></script>
        <script src="https://cdnjs.cloudflare.com/ajax/libs/babel-core/5.8.34/browser.min.js"></script>
        <!--  jquery script  -->
        <script src="https://code.jquery.com/jquery-3.0.0.min.js"></script>
        <!--  jsrender script  -->
        <script src="http://cdn.syncfusion.com/js/assets/external/jsrender.min.js"></script>
        <!-- Essential JS UI widget -->
        <script src="http://cdn.syncfusion.com/14.3.0.49/js/web/ej.web.all.min.js"></script>
        <script src="http://cdn.syncfusion.com/14.3.0.49/js/common/ej.web.react.min.js"></script>

        <!--Add custom scripts here -->
    </head>
    <body>
    </body>
</html>
In the above code, ej.web.all.min.js script reference has been added for demonstration purpose. It is not recommended to use this for deployment purpose, as its file size is larger since it contains all the widgets. Instead, you can use [CSG](http://csg.syncfusion.com/# “”) utility to generate a custom script file with the required widgets for deployment purpose.
Note:
-
react.jsandreact-dom.jsare the core files needed to create react elements. -
browser.min.jsfile is required for code transform. -
ej.web.react.min.jsis a react-syncfusion bridge to render Syncfusion components.
Control Initialization
Add a div container to render the PivotTreeMap.
<!DOCTYPE html>
<html>
    <body>
        <div id="PivotTreeMap1" style="width:99%;"></div>
    </body>
</html>
Initialize the PivotTreeMap by using the EJ.PivotTreeMap tag.
<!DOCTYPE html>
<html>
    <head>
        <style>
          #Olap{
            width: 100%;
            height: 450px;
          }
        </style>
    </head>
    <body>
        <div id="PivotTreeMap1" style="width:99%;"></div>
        <!--  Tooltip can de localized here  -->
        <script id="tooltipTemplate" type="application/jsrender">
            <div style="background:White; color:black; font-size:12px; font-weight:normal; border: 1px solid #4D4D4D; white-space: nowrap;border-radius: 2px; margin-right: 25px; min-width: 110px;padding-right: 5px; padding-left: 5px; padding-bottom: 2px ;width: auto; height: auto;">
                <div>Measure(s) : </div><div>Row : </div><div>Column : </div><div>Value : </div>
            </div>
        </script>
        <script type="text/babel">
             ReactDOM.render(
                   <EJ.PivotTreeMap id="Olap"></EJ.PivotTreeMap>,
                   document.getElementById('PivotTreeMap1')
             );
        </script>
    </body>
</html>
Populate PivotTreeMap with data
Let us now see how to populate the PivotTreeMap control using a sample JSON data as shown below.
<script type="text/babel">
var Olap_dataSource={
data: "http://bi.syncfusion.com/olap/msmdpump.dll",
catalog: "Adventure Works DW 2008 SE", //"Adventure Works DW 2008 SEtandard Edition
cube: "Adventure Works", rows: [{ fieldName: "[Date].[Fiscal]" }], columns: [{ fieldName: "[Customer].[Customer Geography]" }],
values: [{ measures: [{ fieldName: "[Measures].[Internet Sales Amount]" }], axis: "columns" }]
};
$(function(){
ReactDOM.render(
<EJ.PivotTreeMap id="Olap" dataSource= {Olap_dataSource}></EJ.PivotTreeMap>,
document.getElementById('PivotTreeMap1')
);
});
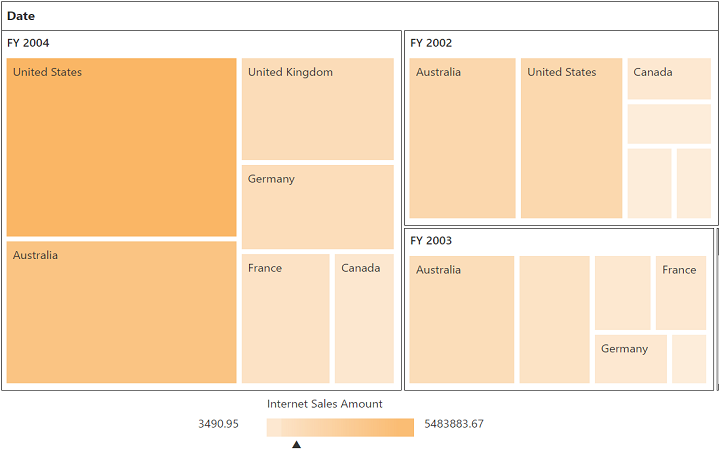
</script>The above code will generate a simple PivotTreeMap with internet sales amount over a period of fiscal years across different customer geographic locations.