How can I help you?
Getting Started
This section explains you the steps required to populate the PivotGrid with data source. This section covers only the minimal features that you need to know to get started with the PivotGrid.
Script and CSS Reference
Create a HTML page and add the script and CSS references in the order mentioned in the following code example.
<!DOCTYPE html>
<html>
    <head>
        <!-- Essential Studio for JavaScript  theme reference -->
        <link rel="stylesheet" href="http://cdn.syncfusion.com/14.3.0.49/js/web/bootstrap-theme/ej.web.all.min.css" />
        <!--  react script  -->
        <script src="https://cdnjs.cloudflare.com/ajax/libs/react/15.2.1/react.js"></script>
        <script src="https://cdnjs.cloudflare.com/ajax/libs/react/15.2.1/react-dom.js"></script>
        <script src="https://cdnjs.cloudflare.com/ajax/libs/babel-core/5.8.34/browser.min.js"></script>
        <!--  jquery script  -->
        <script src="https://code.jquery.com/jquery-3.0.0.min.js"></script>
        <!-- Essential JS UI widget -->
        <script src="http://cdn.syncfusion.com/14.3.0.49/js/web/ej.web.all.min.js"></script>
        <script src="http://cdn.syncfusion.com/14.3.0.49/js/common/ej.web.react.min.js"></script>

        <!--Add custom scripts here -->
    </head>
    <body>
    </body>
</html>
In the above code, ej.web.all.min.js script reference has been added for demonstration purpose. It is not recommended to use this for deployment purpose, as its file size is larger since it contains all the widgets. Instead, you can use [CSG](http://csg.syncfusion.com/# “”) utility to generate a custom script file with the required widgets for deployment purpose.
Note:
-
react.jsandreact-dom.jsare the core files needed to create react elements. -
browser.min.jsfile is required for code transform. -
ej.web.react.min.jsis a react-syncfusion bridge to render Syncfusion components.
Relational
This section covers the information that you need to know to populate a simple PivotGrid with Relational data source.
Control Initialization
Add a div container to render the PivotGrid.
<!DOCTYPE html>
<html>
    <body>
        <div id="PivotGrid1" style="width:99%;"></div>
    </body>
</html>
Initialize the PivotGrid by using the EJ.PivotGrid tag.
<!DOCTYPE html>
<html>
    <head>
        <style>
            #Relational{
                width: 800px;
                height: 450px;
                overflow: auto;
            }
        </style>
    </head>
    <body>
        <div id="PivotGrid1" style="width:99%;"></div>
        <script type="text/babel">
             ReactDOM.render(
                 <EJ.PivotGrid id="Relational"></EJ.PivotGrid>,
                 document.getElementById('PivotGrid1')
             );
        </script>
    </body>
</html>
Populate PivotGrid with Data
Let us now see how to populate the PivotGrid control using a sample JSON data as shown below.
<script type="text/babel">
var pivot_dataset = [
{ Amount: 100, Country: "Canada", Date: "FY 2005", Product: "Bike", Quantity: 2, State: "Alberta" },
{ Amount: 200, Country: "Canada", Date: "FY 2006", Product: "Van", Quantity: 3, State: "British Columbia" },
{ Amount: 300, Country: "Canada", Date: "FY 2007", Product: "Car", Quantity: 4, State: "Brunswick" },
{ Amount: 150, Country: "Canada", Date: "FY 2008", Product: "Bike", Quantity: 3, State: "Manitoba" },
{ Amount: 200, Country: "Canada", Date: "FY 2006", Product: "Car", Quantity: 4, State: "Ontario" },
{ Amount: 100, Country: "Canada", Date: "FY 2007", Product: "Van", Quantity: 1, State: "Quebec" },
{ Amount: 200, Country: "France", Date: "FY 2005", Product: "Bike", Quantity: 2, State: "Charente-Maritime" },
{ Amount: 250, Country: "France", Date: "FY 2006", Product: "Van", Quantity: 4, State: "Essonne" },
{ Amount: 300, Country: "France", Date: "FY 2007", Product: "Car", Quantity: 3, State: "Garonne (Haute)" },
{ Amount: 150, Country: "France", Date: "FY 2008", Product: "Van", Quantity: 2, State: "Gers" },
{ Amount: 200, Country: "Germany", Date: "FY 2006", Product: "Van", Quantity: 3, State: "Bayern" },
{ Amount: 250, Country: "Germany", Date: "FY 2007", Product: "Car", Quantity: 3, State: "Brandenburg" },
{ Amount: 150, Country: "Germany", Date: "FY 2008", Product: "Car", Quantity: 4, State: "Hamburg" },
{ Amount: 200, Country: "Germany", Date: "FY 2008", Product: "Bike", Quantity: 4, State: "Hessen" },
{ Amount: 150, Country: "Germany", Date: "FY 2007", Product: "Van", Quantity: 3, State: "Nordrhein-Westfalen" },
{ Amount: 100, Country: "Germany", Date: "FY 2005", Product: "Bike", Quantity: 2, State: "Saarland" },
{ Amount: 150, Country: "United Kingdom", Date: "FY 2008", Product: "Bike", Quantity: 5, State: "England" },
{ Amount: 250, Country: "United States", Date: "FY 2007", Product: "Car", Quantity: 4, State: "Alabama" },
{ Amount: 200, Country: "United States", Date: "FY 2005", Product: "Van", Quantity: 4, State: "California" },
{ Amount: 100, Country: "United States", Date: "FY 2006", Product: "Bike", Quantity: 2, State: "Colorado" },
{ Amount: 150, Country: "United States", Date: "FY 2008", Product: "Car", Quantity: 3, State: "New Mexico" },
{ Amount: 200, Country: "United States", Date: "FY 2005", Product: "Bike", Quantity: 4, State: "New York" },
{ Amount: 250, Country: "United States", Date: "FY 2008", Product: "Car", Quantity: 3, State: "North Carolina" },
{ Amount: 300, Country: "United States", Date: "FY 2007", Product: "Van", Quantity: 4, State: "South Carolina" }
];
var pivotdataSource = {
data: pivot_dataset,
rows: [
{ fieldName: "Country", fieldCaption: "Country" },
{ fieldName: "State", fieldCaption: "State" }
],
columns: [{ fieldName: "Product", fieldCaption: "Product" }],
values: [
{ fieldName: "Amount", fieldCaption: "Amount" },
{ fieldName: "Quantity", fieldCaption: "Quantity" }
],
filters: []
};
$(function(){
ReactDOM.render(
<EJ.PivotGrid id="Relational" dataSource= {pivotdataSource}></EJ.PivotGrid>,
document.getElementById('PivotGrid1')
);
});
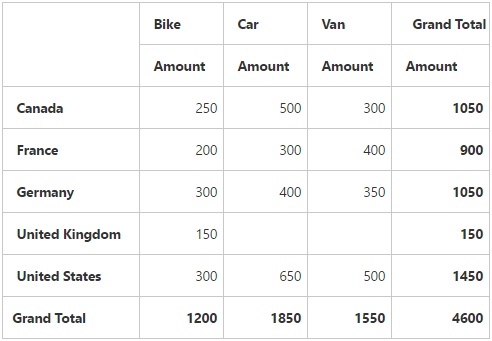
</script>The above code will generate a simple PivotGrid with “Country” field in Row, “Product” field in Column and “Amount” field in Value section.
Apply Sorting
You can sort a field either to ascending or descending order using the “sortOrder” property. Sorting is applicable only for Row and Column fields. By default, fields are arranged in ascending order.
<script type="text/babel">
    var pivot_dataset = []; // data source
    var  pivotdataSource = {
        data: pivot_dataset,
        rows: [
                  { fieldName: "Country", fieldCaption: "Country", sortOrder: ej.PivotAnalysis.SortOrder.Descending }
              ],
        columns: [{ fieldName: "Product", fieldCaption: "Product" }]
        values: [
                    { fieldName: "Amount", fieldCaption: "Amount" }
                ],
        filters: []
    };
</script>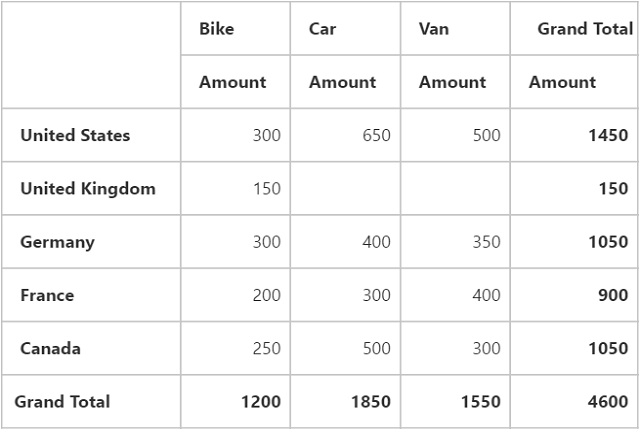
Apply Filtering
Filtering option allows you to specify a set of values that either need to be displayed or hidden. Also filtering option is applicable only for Row, Column and Filter areas.
“filterItems” object allow us to apply filtering to the fields using the following properties:
- filterType - indicates whether the values should be included or excluded.
- values - specify an array of values that needs to be included or excluded within the particular field.
<script type="text/babel">
    var pivot_dataset = []; // data source
    var  pivotdataSource = {
        data: pivot_dataset,
        rows: [ { fieldName: "Country",
                    fieldCaption: "Country",
                    filterItems: {
                        filterType: ej.PivotAnalysis.FilterType.Exclude,
                        values: ["United Kingdom"]
                    }
                  }
              ],
        columns: [{ fieldName: "Product",
                    fieldCaption: "Product",
                    filterItems: {
                        filterType: ej.PivotAnalysis.FilterType.Include,
                        values: ["Bike", "Car"]
                    }
                 }],
        //....
    };
</script>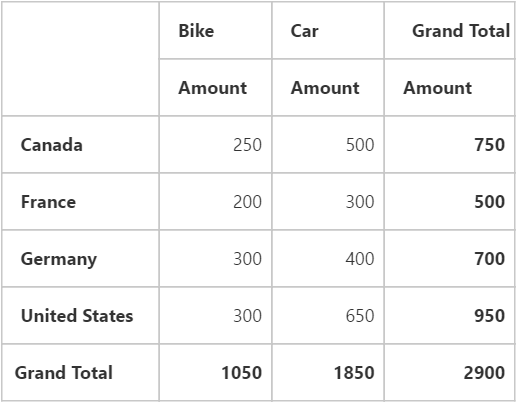
Apply Summary Types
Allow us to specify the required summary type that PivotGrid should use in its summary cells. “sum” is the default summary type. Following are the summary types that are supported:
- sum
- average
- count
- min
- max
<script type="text/babel">
    var pivot_dataset = []; // data source
    var  pivotdataSource = {
        data: pivot_dataset,
        //...
        values: [
                    { fieldName: "Amount", fieldCaption: "Amount", summaryType: ej.PivotAnalysis.SummaryType.Average },
                    { fieldName: "Quantity", fieldCaption: "Quantity", summaryType: ej.PivotAnalysis.SummaryType.Sum }
                ],
        filters: []
    };
</script>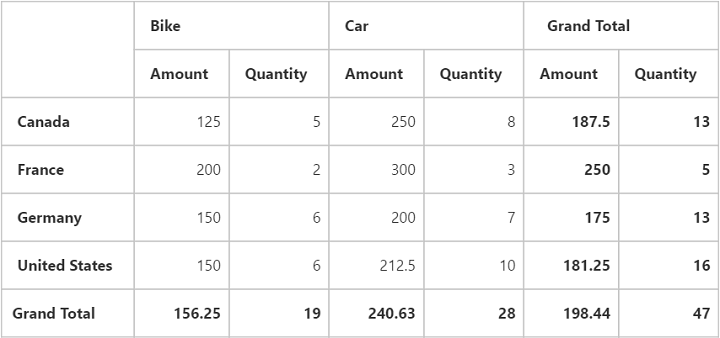
OLAP
This section covers the information that you need to know to populate a simple PivotGrid with OLAP data source.
Add a div container to render the PivotGrid.
<!DOCTYPE html>
<html>
    <body>
        <div id="PivotGrid1" style="width:99%;"></div>
    </body>
</html>
Initialize the PivotGrid by using the EJ.PivotGrid tag.
<!DOCTYPE html>
<html>
    <head>
        <style>
          #Olap{
            width: 800px;
            height: 450px;
            overflow: auto;
          }
        </style>
    </head>
    <body>
        <div id="PivotGrid1" style="width:99%;"></div>
        <script type="text/babel">
             ReactDOM.render(
                   <EJ.PivotGrid id="Olap"></EJ.PivotGrid>,
                   document.getElementById('PivotGrid1')
             );
        </script>
    </body>
</html>
Populate PivotGrid with data
Let us now see how to populate the PivotGrid control using a sample JSON data as shown below.
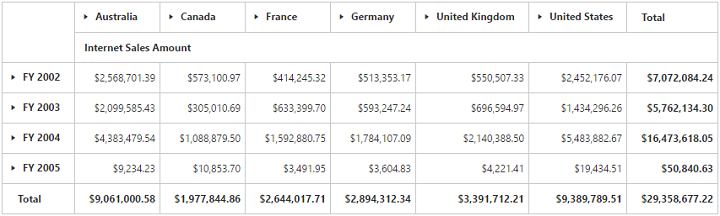
<script type="text/babel">
    var Olap_dataSource={
        data: "http://bi.syncfusion.com/olap/msmdpump.dll",
        catalog: "Adventure Works DW 2008 SE", //"Adventure Works DW 2008 Standard Edition
        cube: "Adventure Works", rows: [{ fieldName: "[Date].[Fiscal]" }], columns: [{ fieldName: "[Customer].[Customer Geography]" }],
        values: [{ measures: [{ fieldName: "[Measures].[Internet Sales Amount]" }], axis: "columns" }]
    };

    $(function(){
      ReactDOM.render(
        <EJ.PivotGrid id="Olap" dataSource= {Olap_dataSource}></EJ.PivotGrid>,
        document.getElementById('PivotGrid1')
      );
    });
</script>
The above code will generate a simple PivotGrid with “Fiscal” field in Row, “Customer Geography” field in Column and “Internet Sales Amount” field in Value section.