Getting Started
4 Nov 201624 minutes to read
This section explains you the steps required to populate the PivotGauge with data source. This section covers only the minimal features that you need to know to get started with the PivotGauge.
Script and CSS Reference
Create a HTML page and add the script and CSS references in the order mentioned in the following code example.
<!DOCTYPE html>
<html>
    <head>
        <!-- Essential Studio for JavaScript  theme reference -->
        <link rel="stylesheet" href="http://cdn.syncfusion.com/14.3.0.49/js/web/bootstrap-theme/ej.web.all.min.css" />
        <!--  react script  -->
        <script src="https://cdnjs.cloudflare.com/ajax/libs/react/15.2.1/react.js"></script>
        <script src="https://cdnjs.cloudflare.com/ajax/libs/react/15.2.1/react-dom.js"></script>
        <script src="https://cdnjs.cloudflare.com/ajax/libs/babel-core/5.8.34/browser.min.js"></script>
        <!--  jquery script  -->
        <script src="https://code.jquery.com/jquery-3.0.0.min.js"></script>
        <!-- Essential JS UI widget -->
        <script src="http://cdn.syncfusion.com/14.3.0.49/js/web/ej.web.all.min.js"></script>
        <script src="http://cdn.syncfusion.com/14.3.0.49/js/common/ej.web.react.min.js"></script>

        <!--Add custom scripts here -->
    </head>
    <body>
    </body>
</html>
In the above code, ej.web.all.min.js script reference has been added for demonstration purpose. It is not recommended to use this for deployment purpose, as its file size is larger since it contains all the widgets. Instead, you can use [CSG](http://csg.syncfusion.com/# “”) utility to generate a custom script file with the required widgets for deployment purpose.
Note:
-
react.jsandreact-dom.jsare the core files needed to create react elements. -
browser.min.jsfile is required for code transform. -
ej.web.react.min.jsis a react-syncfusion bridge to render Syncfusion components.
Relational
This section covers the information that you need to know to populate a simple PivotGauge with Relational data source.
Control Initialization
Add a div container to render the PivotGauge.
<!DOCTYPE html>
<html>
    <body>
        <div id="PivotGauge1" style="width:99%;"></div>
    </body>
</html>
Initialize the PivotGauge by using the EJ.PivotGauge tag.
<!DOCTYPE html>
<html>
    <head>
        <style>
           #Relational{
              width: 95%;
              height: 450px;
              overflow: auto;
           }
        </style>
    </head>
    <body>
        <div id="PivotGauge1" style="width:99%;"></div>
        <script type="text/babel">
             ReactDOM.render(
                   <EJ.PivotGauge id="Relational"></EJ.PivotGauge>,
                   document.getElementById('PivotGauge1')
             );
        </script>
    </body>
</html>
Populate PivotGauge with Data
Let us now see how to populate the PivotGauge control using a sample JSON data as shown below.
<script type="text/babel">
var pivot_dataset = [
{ Amount: 100, Country: "Canada", Date: "FY 2005", Product: "Bike", Quantity: 2, State: "Alberta" },
{ Amount: 200, Country: "Canada", Date: "FY 2006", Product: "Van", Quantity: 3, State: "British Columbia" },
{ Amount: 300, Country: "Canada", Date: "FY 2007", Product: "Car", Quantity: 4, State: "Brunswick" },
{ Amount: 150, Country: "Canada", Date: "FY 2008", Product: "Bike", Quantity: 3, State: "Manitoba" },
{ Amount: 200, Country: "Canada", Date: "FY 2006", Product: "Car", Quantity: 4, State: "Ontario" },
{ Amount: 100, Country: "Canada", Date: "FY 2007", Product: "Van", Quantity: 1, State: "Quebec" },
{ Amount: 200, Country: "France", Date: "FY 2005", Product: "Bike", Quantity: 2, State: "Charente-Maritime" },
{ Amount: 250, Country: "France", Date: "FY 2006", Product: "Van", Quantity: 4, State: "Essonne" },
{ Amount: 300, Country: "France", Date: "FY 2007", Product: "Car", Quantity: 3, State: "Garonne (Haute)" },
{ Amount: 150, Country: "France", Date: "FY 2008", Product: "Van", Quantity: 2, State: "Gers" },
{ Amount: 200, Country: "Germany", Date: "FY 2006", Product: "Van", Quantity: 3, State: "Bayern" },
{ Amount: 250, Country: "Germany", Date: "FY 2007", Product: "Car", Quantity: 3, State: "Brandenburg" },
{ Amount: 150, Country: "Germany", Date: "FY 2008", Product: "Car", Quantity: 4, State: "Hamburg" },
{ Amount: 200, Country: "Germany", Date: "FY 2008", Product: "Bike", Quantity: 4, State: "Hessen" },
{ Amount: 150, Country: "Germany", Date: "FY 2007", Product: "Van", Quantity: 3, State: "Nordrhein-Westfalen" },
{ Amount: 100, Country: "Germany", Date: "FY 2005", Product: "Bike", Quantity: 2, State: "Saarland" },
{ Amount: 150, Country: "United Kingdom", Date: "FY 2008", Product: "Bike", Quantity: 5, State: "England" },
{ Amount: 250, Country: "United States", Date: "FY 2007", Product: "Car", Quantity: 4, State: "Alabama" },
{ Amount: 200, Country: "United States", Date: "FY 2005", Product: "Van", Quantity: 4, State: "California" },
{ Amount: 100, Country: "United States", Date: "FY 2006", Product: "Bike", Quantity: 2, State: "Colorado" },
{ Amount: 150, Country: "United States", Date: "FY 2008", Product: "Car", Quantity: 3, State: "New Mexico" },
{ Amount: 200, Country: "United States", Date: "FY 2005", Product: "Bike", Quantity: 4, State: "New York" },
{ Amount: 250, Country: "United States", Date: "FY 2008", Product: "Car", Quantity: 3, State: "North Carolina" },
{ Amount: 300, Country: "United States", Date: "FY 2007", Product: "Van", Quantity: 4, State: "South Carolina" }
];
var pivotdataSource = {
data: pivot_dataset,
cube: "",
rows: [
{ fieldName: "Country", fieldCaption: "Country" },
{ fieldName: "State", fieldCaption: "State" }
],
columns: [
{ fieldName: "Product", fieldCaption: "Product" }
],
values: [
{ fieldName: "Amount", fieldCaption: "Amount" },
{ fieldName: "Quantity", fieldCaption: "Quantity" }
],
filters: []
};
var pivotgauge_lablesetings = {decimalPlaces: 2};
var PivotGauge_customLables = [{
position: {
x: 180,
y: 290
},
font: {
size: "10px",
fontFamily: "Segoe UI",
fontStyle: "Normal"
},
color: "#666666"
}, {
position: {
x: 180,
y: 320
},
font: {
size: "10px",
fontFamily: "Segoe UI",
fontStyle: "Normal"
},
color: "#666666"
}, {
position: {
x: 180,
y: 150
},
font: {
size: "12px",
fontFamily: "Segoe UI",
fontStyle: "Normal"
},
color: "#666666"
}];
var PivotGauge_ranges = [{
distanceFromScale: -5,
backgroundColor: "#fc0606",
border: {
color: "#fc0606"
}
}, {
distanceFromScale: -5
}];
var pivotgauge_labels = [{
color: "#8c8c8c"
}]
var pivotgauge_ticks = [{
type: "major",
distanceFromScale: 2,
height: 16,
width: 1,
color: "#8c8c8c"
}, {
type: "minor",
height: 6,
width: 1,
distanceFromScale: 2,
color: "#8c8c8c"
}];
var pivotguage_pointers = [{
showBackNeedle: true,
backNeedleLength: 20,
length: 120,
width: 7
}];
var pivotguage_scale = [{
showRanges: true,
radius: 150,
showScaleBar: true,
size: 1,
border: {
width: 0.5
},
showIndicators: true,
showLabels: true,
pointers: pivotguage_pointers,
ticks: pivotgauge_ticks,
labels: pivotgauge_labels,
ranges: PivotGauge_ranges,
customLabels: PivotGauge_customLables
}];
$(function(){
ReactDOM.render(
<EJ.PivotGauge id="Relational" dataSource= {pivotdataSource} labelFormatSettings= {pivotgauge_lablesetings} enableTooltip= {true} isResponsive= {true} load: {"loadGaugeTheme"} backgroundColor= {"transparent"} scales= {pivotguage_scale}></EJ.PivotGauge>,
document.getElementById('PivotGauge1')
);
});
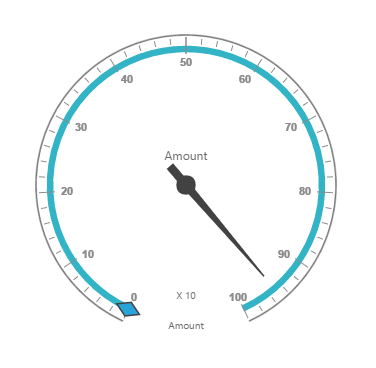
</script>The above code will generate a simple PivotGauge as shown in below figure.
OLAP
This section covers the information that you need to know to populate a simple PivotGauge with OLAP data source.
Control Initialization
Add a div container to render the PivotGauge.
<!DOCTYPE html>
<html>
    <body>
        <div id="PivotGauge1" style="width:99%;"></div>
    </body>
</html>
Initialize the PivotGauge by using the EJ.PivotGauge tag.
<!DOCTYPE html>
<html>
    <head>
        <style>
          #Olap{
            width: 95%;
            height: 450px;
            overflow: auto;
          }
        </style>
    </head>
    <body>
        <div id="PivotGauge1" style="width:99%;"></div>
        <script type="text/babel">
             ReactDOM.render(
                   <EJ.PivotGauge id="Olap"></EJ.PivotGauge>,
                   document.getElementById('PivotGauge1')
             );
        </script>
    </body>
</html>
Populate PivotGauge with data
Let us now see how to populate the PivotGauge control using a sample JSON data as shown below.
<script type="text/babel">
var Olap_dataSource={
data: "http://bi.syncfusion.com/olap/msmdpump.dll",
catalog: "Adventure Works DW 2008 SE",
cube: "Adventure Works",
rows: [
{
fieldName: "[Date].[Fiscal]",
filterItems: { filterType: "include", values: ["[Date].[Fiscal].[Fiscal Year].&[2004]"] }
},
],
columns: [
{
fieldName: "[Customer].[Customer Geography]",
filterItems: { filterType: "include", values: ["[Customer].[Customer Geography].[Country].&[Australia]"] }
}
],
values: [
{
measures: [
{
fieldName: "[Measures].[Internet Sales Amount]"
},
{
fieldName: "[Measures].[Internet Revenue Status]"
},
{
fieldName: "[Measures].[Internet Revenue Trend]"
},
{
fieldName: "[Measures].[Internet Revenue Goal]"
},
],
axis: ej.PivotGauge.AxisName.Columns
}
]
};
var pivotgauge_lablesettings = {decimalPlaces: 2};
var PivotGauge_customLables = [{
position: {
x: 180,
y: 290
},
font: {
size: "10px",
fontFamily: "Segoe UI",
fontStyle: "Normal"
},
color: "#666666"
}, {
position: {
x: 180,
y: 320
},
font: {
size: "10px",
fontFamily: "Segoe UI",
fontStyle: "Normal"
},
color: "#666666"
}, {
position: {
x: 180,
y: 150
},
font: {
size: "12px",
fontFamily: "Segoe UI",
fontStyle: "Normal"
},
color: "#666666"
}];
var PivotGauge_ranges = [{
distanceFromScale: -5,
backgroundColor: "#fc0606",
border: {
color: "#fc0606"
}
}, {
distanceFromScale: -5
}];
var pivotgauge_labels = [{
color: "#8c8c8c"
}]
var pivotgauge_ticks = [{
type: "major",
distanceFromScale: 2,
height: 16,
width: 1,
color: "#8c8c8c"
}, {
type: "minor",
height: 6,
width: 1,
distanceFromScale: 2,
color: "#8c8c8c"
}];
var pivotguage_pointers = [{
showBackNeedle: true,
backNeedleLength: 20,
length: 120,
width: 7
}, {
type: "marker",
markerType: ej.datavisualization.CircularGauge.MarkerType.Diamond,
distanceFromScale: 5,
placement: "center",
backgroundColor: "#29A4D9",
length: 25,
width: 15
}];
var pivotguage_scale = [{
showRanges: true,
radius: 150,
showScaleBar: true,
size: 1,
border: {
width: 0.5
},
showIndicators: true,
showLabels: true,
pointers: pivotguage_pointers,
ticks: pivotgauge_ticks,
labels: pivotgauge_labels,
ranges: PivotGauge_ranges,
customLabels: PivotGauge_customLables
}];
$(function(){
ReactDOM.render(
<EJ.PivotGauge id="Olap" dataSource= {Olap_dataSource} labelFormatSettings= {pivotgauge_lablesettings} enableTooltip= {true} isResponsive= {true} load: {"loadGaugeTheme"} backgroundColor= {"transparent"} scales= {pivotguage_scale}></EJ.PivotGauge>,
document.getElementById('PivotGauge1')
);
});
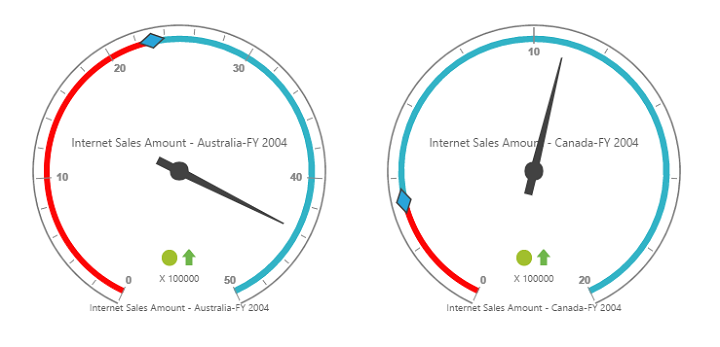
</script>The above code will generate a simple PivotGauge as shown in below figure.