How can I help you?
Ticks
Ticks are used to mark some values on the scale. Based on the tick’s value you can set the labels on the required position.
Adding tick collection
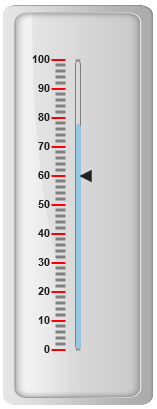
Tick collection can be directly added to the scale object. Refer the following code example to add tick collection in a Linear Gauge control.
<div id="LinearGauge1"></div>"use strict";
var scales = [
{
width: 5, majorIntervalValue: 25, minorIntervalValue: 5,
backgroundColor: "White", showCustomLabels: true,
showMarkerPointers: false, showBarPointers: true,
direction: ej.datavisualization.LinearGauge.Directions.Clockwise,
type: "roundedrectangle",
border: { color: "#AEC75F", width: 2 },
// Adding bar pointer collection
barPointers: [{ width: 4, backgroundColor: "Red" }],
// Adding label collection
labels: [{
angle: 90,
distanceFromScale: { x: 0, y: 60 },
unitText: "%"
}],
// Adding tick collection
ticks: [{
type: "majorinterval", width: 2,
color: "#8c8c8c", distanceFromScale: { x: 0, y: 25 }
},
{
type: "minorinterval", width: 1, height: 6,
color: "#8c8c8c", distanceFromScale: { x: 0, y: 25 }
}],
customLabels: [{
value: "Download in Progress", position: { x: 50, y: 20 },
}]
}];
var frame = {
// For setting back ground Image URL
backgroundImageUrl: "Gauge_linear_light1.png"
};
ReactDOM.render(
<EJ.LinearGauge id="lineargauge"
labelColor= "#8c8c8c" frame = {frame} orientation = "Horizontal" scales = {scales} width = {600} height = {250} value = {31} labelColor = "Black" enableResize = {true} enableAnimation = {false}>
</EJ.LinearGauge>,
document.getElementById('LinearGauge1')
);Execute the above code to render the following output.
Tick Customization
Appearance
-
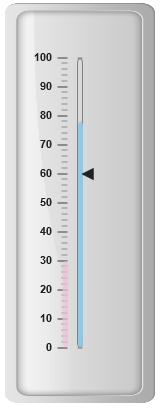
Height and width of the ticks can be applied by using the properties height and width. You can customize ticks with the properties like angle, color, etc. angle attribute is used to display the labels in the specified angles and color attribute is used to display the labels in specified color.
-
Ticks are two types such as major and minor. The opacity of the labels can be adjusted with the property opacity. The opacity values lies between 0 and 1.
<div id="LinearGauge1"></div>"use strict";
var scales = [
{
width:5,
backgroundColor: "transparent", type: "roundedrectangle",
border: { color: "Grey", width: 1 },showBarPointers: true,
//Adding label collection
labels: [{ distanceFromScale: { x: -25, y: 0 } }],
//Adding marker pointer collection
markerPointers:[{width:10,length:10, value:60}],
//Adding bar pointer collection
barPointers: [{ width: 5, backgroundColor: "#95C7E0" }],
//Adding ticks collection
ticks: [{
type: "majorinterval",
width: 2,
height:14,
angle:10,
color: "Black",
distanceFromScale: { x: -10, y: 0 },position:"far"
},
{
type: "minorinterval",
width: 1,
height: 10,
opacity:0.5,
color: "Black",
distanceFromScale: { x: -10, y: 0 }, position: "far"
}]
}];
var frame = {
innerWidth: 8,
outerWidth: 10,
// For setting back ground Image URL
backgroundImageUrl: "Gauge_linear_light.png"
};
ReactDOM.render(
<EJ.LinearGauge id="lineargauge"
labelColor= "#8c8c8c" frame = {frame} scales = {scales} enableAnimation = {false} value = {78}>
</EJ.LinearGauge>,
document.getElementById('LinearGauge1')
);Execute the above code to render the following output.
Types
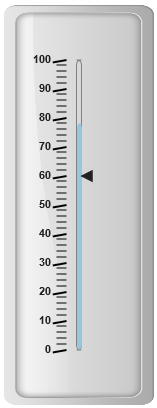
Ticks are two types such as majorInterval and minorInterval. Major type ticks are for major interval values and minor type ticks are for minor interval values.
<div id="LinearGauge1"></div>"use strict";
var scales = [
{
width: 5,
backgroundColor: "transparent", type: "roundedrectangle",
border: { color: "Grey", width: 1 }, showBarPointers: true,
//Adding label collection
labels: [{ distanceFromScale: { x: -25, y: 0 } }],
//Adding marker pointer collection
markerPointers: [{ width: 10, length: 10, value: 60 }],
//Adding bar pointer collection
barPointers: [{ width: 5, backgroundColor: "#95C7E0" }],
//Adding tick collection
ticks: [{
type: "majorinterval", width: 2, height: 14,
color: "Black", position: "far"
},
{
type: "minorinterval",
}]
}];
var frame = {
innerWidth: 8,
outerWidth: 10,
// For setting back ground Image URL
backgroundImageUrl: "Gauge_linear_light.png"
};
ReactDOM.render(
<EJ.LinearGauge id="lineargauge"
labelColor= "#8c8c8c" frame = {frame} scales = {scales} enableAnimation = {false} value = {78}>
</EJ.LinearGauge>,
document.getElementById('LinearGauge1')
);Execute the above code to render the following output.
Positioning the ticks
-
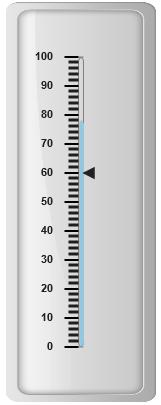
You can position ticks with the help of two properties such as distanceFromScale and placement. The property distanceFromScale defines the distance between the scale and ticks.
-
Placement property is used to locate the ticks with respect to scale either inside the scale or outside the scale or along the scale. It is an enumerable data type.
<div id="LinearGauge1"></div>"use strict";
var scales = [
{
width:5,
backgroundColor: "transparent", type: "roundedrectangle",
border: { color: "Grey", width: 1 },showBarPointers: true,
//Adding label collection
labels: [{ distanceFromScale: { x: -25, y: 0 } }],
//Adding marker pointer collection
markerPointers:[{width:10,length:10, value:60}],
//Adding bar pointer collection
barPointers: [{ width: 5, backgroundColor: "#95C7E0" }],
ticks: [{
type: "majorinterval",
width: 2,
height:14,
color: "Red",
distanceFromScale: { x: -10, y: 0 },position:"far"
},
{
type: "minorinterval",
width: 1,
height: 10,
opacity:0.5,
color: "Black",
distanceFromScale: { x: -10, y: 0 }, position: "far"
}]
}];
var frame = {
innerWidth: 8,
outerWidth: 10,
// For setting back ground Image URL
backgroundImageUrl: "Gauge_linear_light.png"
};
ReactDOM.render(
<EJ.LinearGauge id="lineargauge"
labelColor= "#8c8c8c"
frame = {frame} scales = {scales} enableAnimation = {false} value = {78}>
</EJ.LinearGauge>,
document.getElementById('LinearGauge1')
);Execute the above code to render the following output.