How can I help you?
Getting Started with PHP Range Navigator
This section explains briefly about how to create a RangeNavigator in your application with JavaScript.
Create your first RangeNavigator in PHP
This section encompasses on how to configure the ejRangeNavigator and update the chart control for RangeNavigator’s selected range. It also helps you to learn how to pass the required data to RangeNavigator and customize the scale and selected range for your requirements. In this example, you will look at the steps to configure a RangeNavigator to analyze sales of a product for a particular quarter in a year.
Adding PHP EJ source and script reference
Create a first PHP file in Xampp and name it appropriately with .php extension and also place it under the newly created sample folder. Now refer AutoLoad.php file from EJ source of PHP in the sample page. For example, say Index.php with the initial code as shown below -
Refer the required scripts files in your PHP page as mentioned below in order to render the RangeNavigator control.
<!DOCTYPE html>
<html>
<head>
<!--  jquery script  -->
    <script type="text/javascript" src="//cdn.syncfusion.com/js/assets/external/jquery-3.0.0.min.js"></script>
    <!-- Essential JS UI widget -->
    <script type="text/javascript" src="//cdn.syncfusion.com/14.3.0.49/js/web/ej.web.all.min.js"></script></head>
<body>
<!--Refer AutoLoad.php common source to render the control-->
   <?php
      require_once '../EJ/AutoLoad.php';
    ?>
</body>
</html>
In the above code, ej.web.all.min.js script reference has been added for demonstration purpose. It is not recommended to use this for deployment purpose, as its file size is larger since it contains all the widgets. Instead, you can use CSG utility to generate a custom script file with the required widgets for deployment purpose.
Initialize RangeNavigator
The following code example renders a RangeNavigator with a range from 2010, January 1st to December 31st.
<?php
$range=new EJ\RangeNavigator("rangeContainer");
$rangeSettings=new EJ\RangeNavigator\RangeSetting();
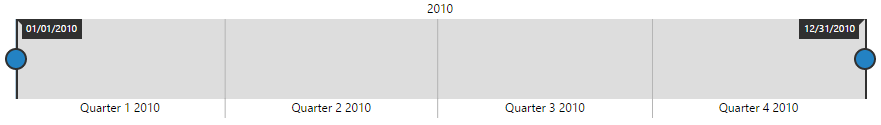
$rangeSettings->start("2010/1/1")->end("2010/12/31");
echo $range->rangeSettings($rangeSettings)->render();
?>The following screen shot displays the RangeNavigator with a range from 2010, January 1st to December 31st.
Add series
To add series to ejRangeNavigator, you need to set dataSource property of ejRangeNavigator as shown in the following code example.
You can create data source for RangeNavigator as follows.
<?php
	$Json = '[{ "xDate": "2011/0/1", "yValue": 10 },
                        { "xDate": "2011/2/1", "yValue": 5 },
                        { "xDate": "2011/4/1", "yValue": 15 },
                        { "xDate": "2011/6/1", "yValue": 25 },
                        { "xDate": "2011/8/1", "yValue": 10 },
                        { "xDate": "2011/10/1", "yValue": 5 },
                        { "xDate": "2011/12/1", "yValue": 15 }]';

	 $Json = json_decode($Json,true);
   ?>
Now, add the dataSource to the RangeNavigator and provide the field name to get the values from the dataSource in xName and yName options.
<?php
$range=new EJ\RangeNavigator("rangeContainer");
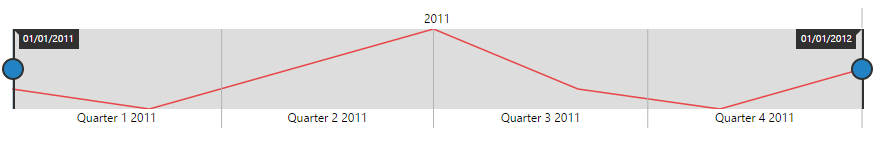
echo $range->dataSource($Json)->xName("xDate")->yName("yValue")->render();
?>The following screenshot displays a RangeNavigator with the default “Line” series type.
Enable tooltip
You can customize Tooltip for RangeNavigator using tooltip option. You can use tooltipDisplayMode option in tooltip,to display the tooltip “always” or “ondemand” (displays tooltip only while dragging the sliders). You can also specify label format for tooltip using labelFormat.
The following code sample shows how to enable a Tooltip.
<?php
$range=new EJ\RangeNavigator("rangeContainer");
$tooltip=new EJ\RangeNavigator\TooltipSetting();
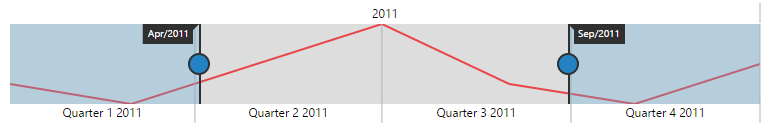
$tooltip->visible(true)->labelFormat("MMM/yy")->tooltipDisplayMode("always");
echo $range->tooltip($tooltip)->render();
?>The following screenshot displays the label format Tooltip in RangeNavigator:
Update Chart
You can use RangeNavigator with controls such as chart and grid to view the range of data selected in RangeNavigator.
In order to update chart, whenever the selected range changes in RangeNavigator, you need to use rangeChanged event of RangeNavigator and then update the chart with the selected data in this event.
Add a script tag inside the body tag and add the following code sample.
<?php
$chart=new EJ\Chart("chartContainer");
$series1->dataSource($Json)->xName("xDate")->yName("yValue")->type("line")->name("Sales");
$seriesCollection = array($series1);
$yAxis = new EJ\Chart\PrimaryYAxis();
$yTitle = new EJ\Chart\Title();
$yTitle->text("Sales(Million)");
$yAxis->title($yTitle);
$chartLegend = new EJ\Chart\Legend();
//Enable chart legend
$chartLegend->visible(true)->position("top");
$chartTitle= new EJ\Chart\Title();
//Add title to chart control
$chartTitle->text("Sales Analysis");
echo $chart->series($seriesCollection)->primaryYAxis($yAxis)->legend($chartLegend)->title($chartTitle)->render();
$range=new EJ\RangeNavigator("rangeContainer");
echo $range->dataSource($Json)->xName("xDate")->yName("yValue")->rangeChanged("onrangechanged")->render();
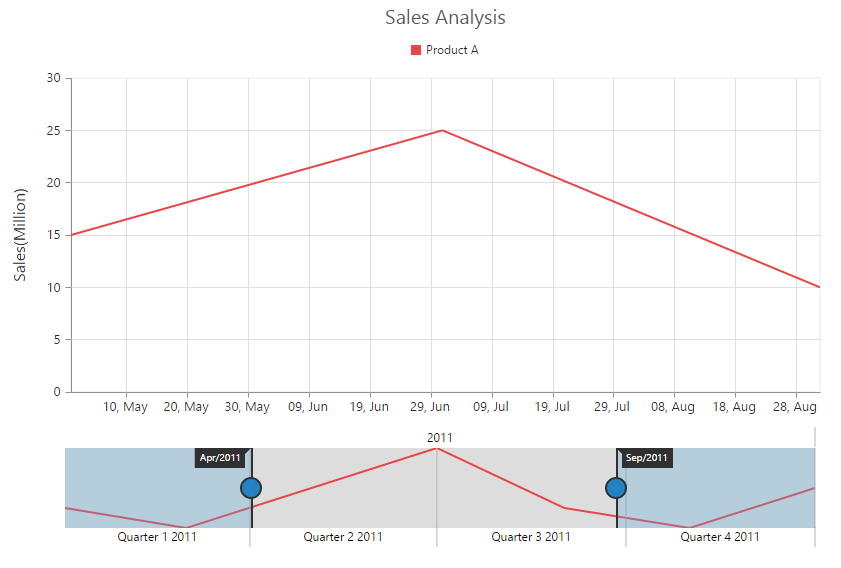
?>You can update the chart with the selected data using the rangeChanged event of ejRangeNavigator.
function onrangechanged(sender) {
    var chartobj = $("#chartContent").data("ejChart");
    if (chartobj != null) {
           chartobj.model.series[0].dataSource = sender.selectedData;
           $("#chartContent").ejChart("redraw");
       }
   }
The following screenshot displays how a RangeNavigator is updated when a selected range is changed.

Set value type
RangeNavigator can also be used with numerical values. You can specify the data type using valueType option.
You can create a dataSource for Chart Series with integer Values using the following code sample.
<?php
$Json = '[{ "xDate": "0", "yValue": 10 },
{ "xDate": "50", "yValue": 5 },
{ "xDate": "100", "yValue": 15 },
{ "xDate": "150", "yValue": 25 },
{ "xDate": "200", "yValue": 10 },
{ "xDate": "250", "yValue": 5 },
{ "xDate": "300", "yValue": 15 }]';
$Json = json_decode($Json,true);
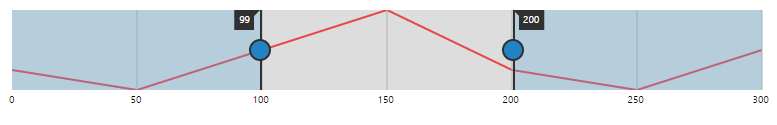
?>Now, you can set the dataSource for Chart Series and valueType property to “numeric” as given in the following code example.
<?php

    $range=new EJ\RangeNavigator("rangeContainer");

    echo $range->dataSource($Json)->xName("xDate")->yName("yValue")->valueType("numeric")->render();
    ?>
The following screenshot displays a RangeNavigator with numerical values: