Getting Started
6 Jun 20238 minutes to read
This section explains briefly about how to create Maps in your application with PHP.
Create your first Map in PHP
You can configure an Essential PHP Map in simple steps. In this example, you can learn how to configure USA population map with customized appearance and tooltip.
Add Libraries
To use ejMap, refer the following libraries in HTML page.
- jQuery version 1.10.1 and above,
- ej.web.all.min
- JsRender
You can link these libraries from a Content Delivery Network (CDN).
Adding PHP EJ source and script reference
Create a first PHP file in Xampp and name it appropriately with .php extension and also place it under the newly created sample folder. Now refer AutoLoad.php file from EJ source of PHP in the sample page. For example, say Index.php with the initial code as shown below -
Refer the required scripts files in your PHP page as mentioned below in order to render the Map control.
<!DOCTYPE html>
<html>
<head>
<!--  jquery script  -->
    <script type="text/javascript" src="//cdn.syncfusion.com/js/assets/external/jquery-3.0.0.min.js"></script>
    <!-- Essential JS UI widget -->
    <script type="text/javascript" src="//cdn.syncfusion.com/14.3.0.49/js/web/ej.web.all.min.js"></script>
<script src="http://cdn.jsdelivr.net/jsrender/1.0pre35/jsrender.min.js" type="text/javascript"></script>
</head>
<body>
<!--Refer AutoLoad.php common source to render the control-->
   <?php
      require_once '../EJ/AutoLoad.php';
    ?>
</body>
</html>
In the above code, ej.web.all.min.js script reference has been added for demonstration purpose. It is not recommended to use this for deployment purpose, as its file size is larger since it contains all the widgets. Instead, you can use CSG utility to generate a custom script file with the required widgets for deployment purpose.
Prepare Shape Data
The Shape Data collection describing geographical shape information can be obtained from GEOJSON format shapes.
In this example, USA shape is used as shape data and this shape data JSON string is converted into PHP object using getUSAMap() method.
<?php
require_once '../EJ/AutoLoad.php';
?>
<?php
$map = new EJ\Map("maps");
$data = getUSAMap();
$USMap = json_decode($data);
$layer1=new EJ\Map\Layer();
$layer1->shapeData($USMap);
$layer = array($layer1);
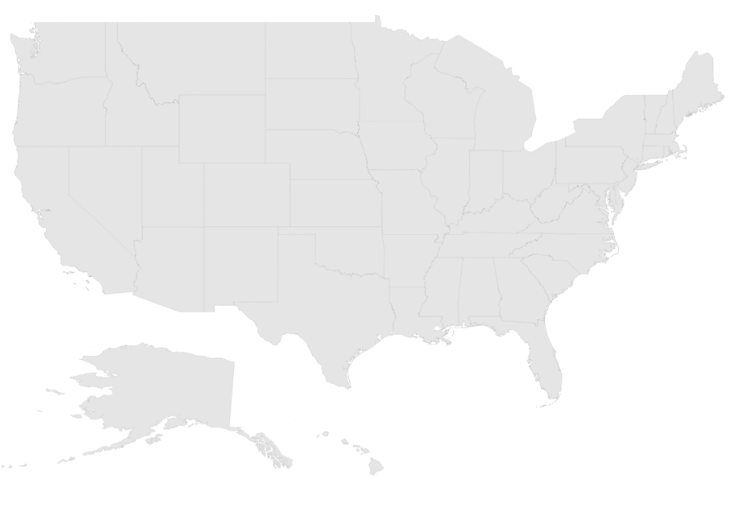
echo $map->layers($layer)->render();
?>The above code renders a map, with default properties and shape input provided through data in layers.
Data Binding in Map
The following properties in shape layers are used for binding data in Map control.
- dataSource
- shapeDataPath
- shapePropertyPath
DataSource
The dataSource property accepts collection values as input. For example, the list of objects can be provided as input.
Shape Data Path
The shapeDataPath property used to refer the data ID in dataSource. For example, “populationData” JSON object contains data ids ‘name’ and ‘population’. The shapeDataPath and the shapePropertyPath properties are related to each other (refer to shapePropertyPath for more details).
Shape Property Path
The shapePropertyPath property is similar to the shapeDataPath that refers the column name in the shapeData property of shape layers to identify the shape. When the values of the shapeDataPath property in the dataSource property and the value of shapePropertyPath in the shapeData property match, then the associated object from the dataSource is bound to the corresponding shape.
USPopulation() method returns USA population data as json string and converted in to PHP object in the following code example.
<?php
	$map = new EJ\Map("maps");

	 $data = getUSAMap();
	 $USMap = json_decode($data);
	 $US_population = USPopulation();
                $US_population = json_decode($US_population);

	 $layer1=new EJ\Map\Layer();
	 $layer1->shapeData($USMap)->dataSource($US_population)->shapeDataPath("name")->shapePropertyPath("name");

               $layer = array($layer1);

               echo $map->layers($layer)->render();
    ?>
Customize Map Appearance
You can customize the shape’s color by using fill, stroke and strokeThickness properties in shapeSettings.
<?php
$map = new EJ\Map("maps");
$data = getUSAMap();
$USMap = json_decode($data);
$US_population = USPopulation();
$US_population = json_decode($US_population);
$shape = new EJ\Map\ShapeSetting();
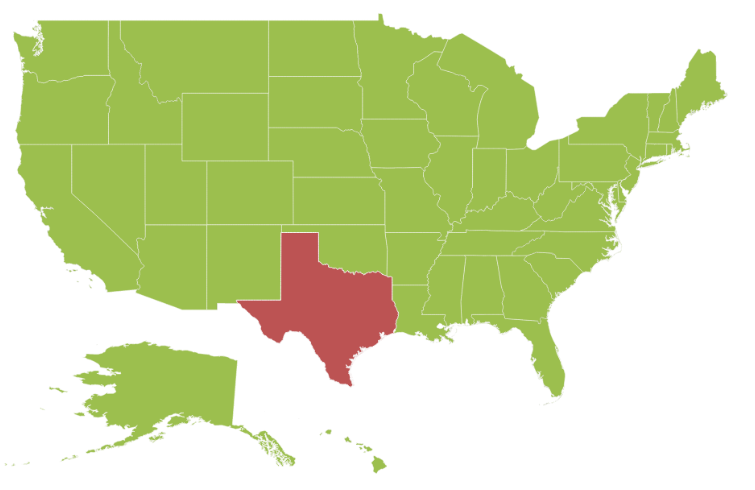
$shape->fill("#9CBF4E")->strokeThickness("0.5")->stroke("white")->highlightStroke("white")->highlightColor("#BC5353")->highlightBorderWidth(1);
$layer1=new EJ\Map\Layer();
$layer1->shapeData($USMap)->dataSource($US_population)->shapeDataPath("name")->shapePropertyPath("name")
->enableSelection(false)->enableMouseHover(true)->shapeSettings($shape);
$layer = array($layer1);
echo $map->layers($layer)->render();
?>
Customize Map Appearance by Range
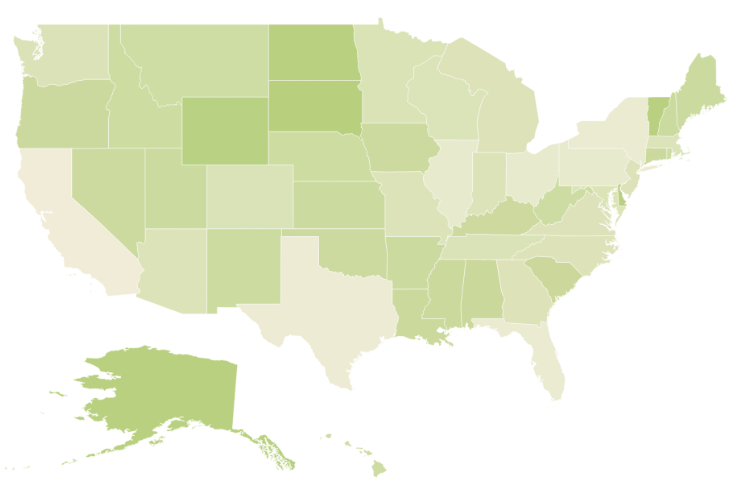
The Range color mapping is used to differentiate the shape’s fill based on its underlying value and color ranges. The from and to properties defines the value ranges and the gradientColors property defines the equivalent color ranges respective to their value ranges.
NOTE
The
enableGradientproperty value is set to true to apply gradient colors for the maps.
<?php

      $map = new EJ\Map("maps");

	 $data = getUSAMap();
	 $USMap = json_decode($data);
	 $US_population = USPopulation();
             $US_population = json_decode($US_population);

	 $colorMapping = new EJ\Map\ColorMapping();
	 $rangeColor1 = new EJ\Map\ColorMappingsRangeColorMapping();
	 $gradient = array("#9CBF4E", "#B8CE7B");
	 $rangeColor1->from(500000)->to(1000000)->gradientColors($gradient);

	 $rangeColor2 = new EJ\Map\ColorMappingsRangeColorMapping();
	 $gradient = array("#B8CE7B", "#CBD89A");
	 $rangeColor2->from(1000001)->to(5000000)->gradientColors($gradient);

	 $rangeColor3 = new EJ\Map\ColorMappingsRangeColorMapping();
	 $gradient = array("#CBD89A", "#DEE2B9");
	 $rangeColor3->from(5000001)->to(10000000)->gradientColors($gradient);

	 $rangeColor4 = new EJ\Map\ColorMappingsRangeColorMapping();
	 $gradient = array("#DEE2B9", "#F1ECD8");
	 $rangeColor4->from(10000001)->to(40000000)->gradientColors($gradient);
	 $rangeColor = array($rangeColor1, $rangeColor2, $rangeColor3, $rangeColor4);
	 $colorMapping->rangeColorMapping($rangeColor);

	 $shape = new EJ\Map\ShapeSetting();
	 $shape->fill("#9CBF4E")->strokeThickness("0.5")->stroke("white")->highlightStroke("white")->highlightColor("#BC5353")
	        ->valuePath("name")->colorValuePath("population")->enableGradient(true)->colorMappings($colorMapping)
	        ->highlightBorderWidth(1);

	 $layer1=new EJ\Map\Layer();
	 $layer1->shapeData($USMap)->dataSource($US_population)->shapeDataPath("name")->shapePropertyPath("name")
	         ->enableSelection(false)->enableMouseHover(true)->shapeSettings($shape);

     $layer = array($layer1);

     echo $map->layers($layer)->render();
    ?>
The following screenshot illustrates a map with gradient color property enabled.
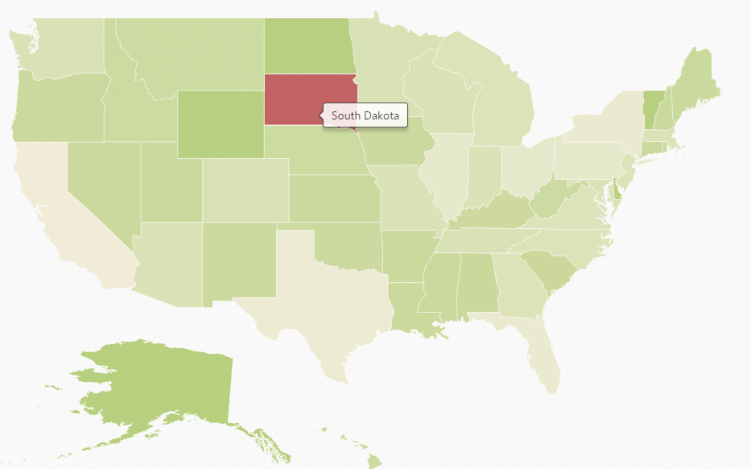
Enable Tooltip
The tooltip is displayed only when the showTooltip is set to “True” in the layers. By default, it takes the property of the bound object that is referred in the valuePath and displays its content on hovering the corresponding shape. The tooltipTemplate property is used for customizing the template for tooltip.
<?php

     $map = new EJ\Map("maps");
	 $layer1=new EJ\Map\Layer();
               //Enable tooltip to shape
	 $layer1->showTooltip(true);

     $layer = array($layer1);

     echo $map->layers($layer)->render();
?>
The following screenshot illustrates a map control displaying a Tooltip.
Legend
A Legend can be made visible by setting the showLegend property in legendSettings.
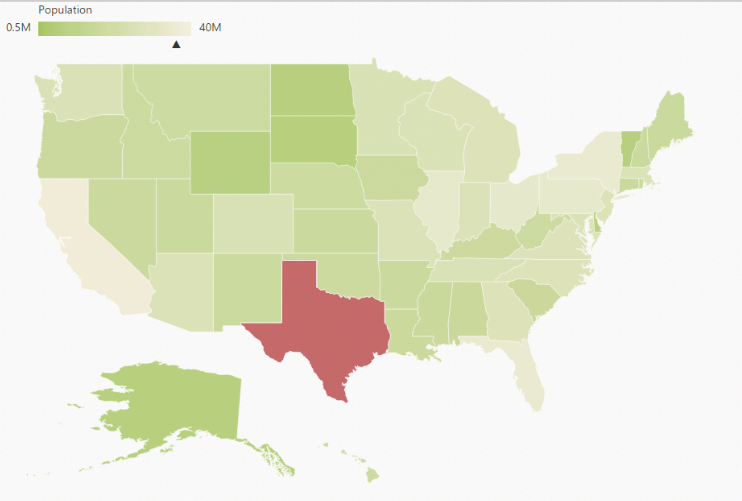
Interactive Legend
The legends can be made interactive with an arrow mark indicating the exact range color in the legend, when the mouse hovers on the corresponding shape. You can enable this option by setting the mode property in the legendSettings value as “interactive”. The default value of mode property is “default” to enable the normal legend.
Title
Use the title property to provide title for interactive legend.
Label
You can use leftLabel and rightLabel property to provide left and right labels for interactive legend.
<?php
$map = new EJ\Map("maps");
$data = getUSAMap();
$USMap = json_decode($data);
$US_population = USPopulation();
$US_population = json_decode($US_population);
$colorMapping = new EJ\Map\ColorMapping();
$rangeColor1 = new EJ\Map\ColorMappingsRangeColorMapping();
$gradient = array("#9CBF4E", "#B8CE7B");
$rangeColor1->from(500000)->to(1000000)->gradientColors($gradient);
$rangeColor2 = new EJ\Map\ColorMappingsRangeColorMapping();
$gradient = array("#B8CE7B", "#CBD89A");
$rangeColor2->from(1000001)->to(5000000)->gradientColors($gradient);
$rangeColor3 = new EJ\Map\ColorMappingsRangeColorMapping();
$gradient = array("#CBD89A", "#DEE2B9");
$rangeColor3->from(5000001)->to(10000000)->gradientColors($gradient);
$rangeColor4 = new EJ\Map\ColorMappingsRangeColorMapping();
$gradient = array("#DEE2B9", "#F1ECD8");
$rangeColor4->from(10000001)->to(40000000)->gradientColors($gradient);
$rangeColor = array($rangeColor1, $rangeColor2, $rangeColor3, $rangeColor4);
$colorMapping->rangeColorMapping($rangeColor);
$legend = new EJ\Map\LegendSetting();
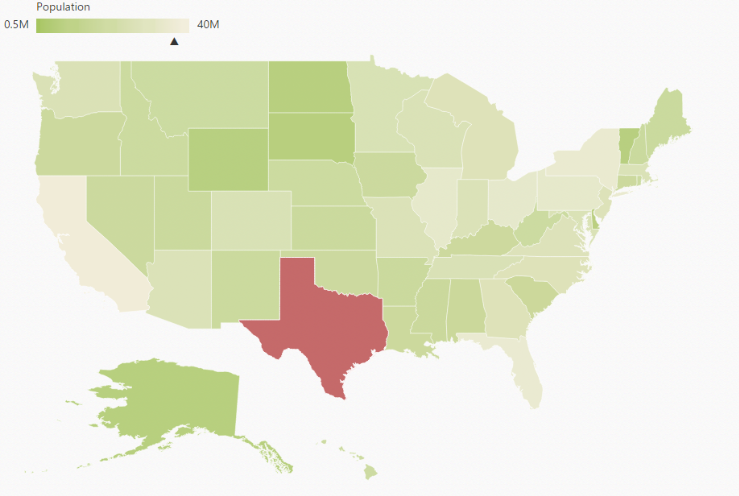
$legend->showLegend(true)->dockOnMap(true)->height(18)->width(190)->mode("interactive")->title("Population")
->leftLabel("0.5M")->rightLabel("40M");
$shape = new EJ\Map\ShapeSetting();
$shape->fill("#9CBF4E")->strokeThickness("0.5")->stroke("white")->highlightStroke("white")->highlightColor("#BC5353")
->valuePath("name")->colorValuePath("population")->enableGradient(true)->colorMappings($colorMapping)
->highlightBorderWidth(1);
$layer1=new EJ\Map\Layer();
$layer1->shapeData($USMap)->dataSource($US_population)->shapeDataPath("name")->shapePropertyPath("name")
->enableSelection(false)->enableMouseHover(true)->shapeSettings($shape)->showTooltip(true)
->legendSettings($legend);
$layer = array($layer1);
echo $map->layers($layer)->render();
?>The following screenshot illustrates a map displaying an interactive legend.
The complete code sample can be found here.