How can I help you?
Axis line in .NET MAUI Spark Charts
The axis is a baseline that helps compare values above and below it in spark charts. Use it to highlight zero or any target value.
Enable the axis
Set the ShowAxis property to display the axis at the chart’s origin in SfSparkChart, by default, the axis is set to False.
<sparkchart:SfSparkLineChart
    ItemsSource="{Binding Data}"
    YBindingPath="Value"
    ShowAxis="True">
</sparkchart:SfSparkLineChart>
var chart = new SfSparkLineChart
{
ItemsSource = viewmodel.Data,
YBindingPath = "Value",
ShowAxis = true
};
Content = chart;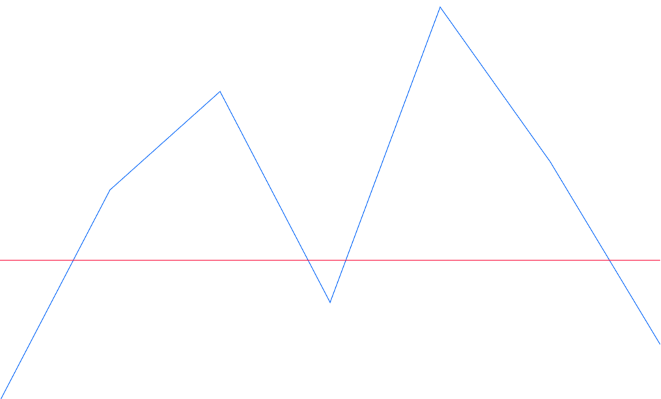
Types
Spark charts consist of two axes for measuring and categorizing data: a vertical (Y) axis and a horizontal (X) axis. The Y-axis always uses a numerical scale to measure data values, while the X-axis provides flexibility to change its type using the AxisType property, supporting Numeric, Category, and DateTime scales.
XBindingPath Property
The XBindingPath property specifies the data source property that contains the X-axis values. It binds your collection’s data to the horizontal axis of the spark chart.
AxisType Property
The AxisType property of the spark charts determines how the chart interprets the X-axis values. Its default value is SparkChartAxisType.Numeric. It accepts the following SparkChartAxisType enum values
-
Category - Treats X‑axis values as discrete categories. Use this for text or labels where each point represents a distinct group.
-
DateTime - Treats X‑axis values as dates/times. Use this to highlight trends and changes over time.
-
Numeric - Treats X‑axis values as numbers. Use this for quantities, indices, or other continuous numeric data.
<sparkchart:SfSparkColumnChart ItemsSource="{Binding Data}"
                               YBindingPath="Value"
                               XBindingPath="OrderName"
                               AxisType="Category">
</sparkchart:SfSparkColumnChart>
SfSparkColumnChart sparkchart = new SfSparkColumnChart()
{
ItemsSource = new SparkChartViewModel().Data,
YBindingPath = "Value",
XBindingPath = "OrderName",
AxisType = SparkChartAxisType.Category
};
this.Content = sparkchart;Origin
Set AxisOrigin to draw the line at a specific Y value (for example, 0 to emphasize zero, or any custom value) of SfSparkChart.
<sparkchart:SfSparkLineChart
    ItemsSource="{Binding Data}"
    YBindingPath="Value"
    ShowAxis="True"
    AxisOrigin="8">
</sparkchart:SfSparkLineChart>
var chart = new SfSparkLineChart
{
ItemsSource = viewmodel.Data,
YBindingPath = "Value",
ShowAxis = true
};
chart.AxisOrigin = 8;
Content = chart;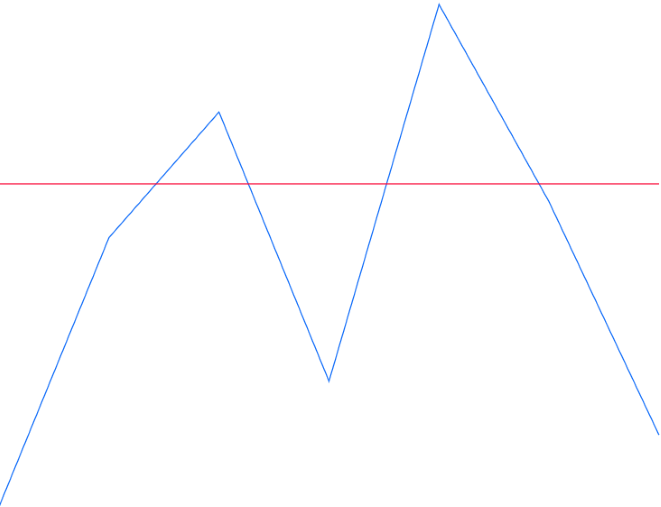
Customization
The AxisLineStyle properties lets you customize the appearance of the axis in SfSparkChart. You can adjust its color, thickness, and dash pattern.
- Stroke - Gets or sets the axis line color.
- StrokeWidth - Gets or sets the axis line thickness. Default is 1.
- StrokeDashArray - Gets or sets the dash pattern for the axis line. Default is null.
<spark:SfSparkColumnChart.AxisLineStyle>
        <sparkchart:SparkChartLineStyle StrokeWidth="1.5" Stroke="#333333" StrokeDashArray="4,2" />
</spark:SfSparkColumnChart.AxisLineStyle>chart.AxisLineStyle = new SparkChartLineStyle
{
Stroke = new SolidColorBrush(Color.FromArgb("#333333")),
StrokeWidth = 2,
StrokeDashArray = new DoubleCollection { 4, 2 }
}
this.content = chart;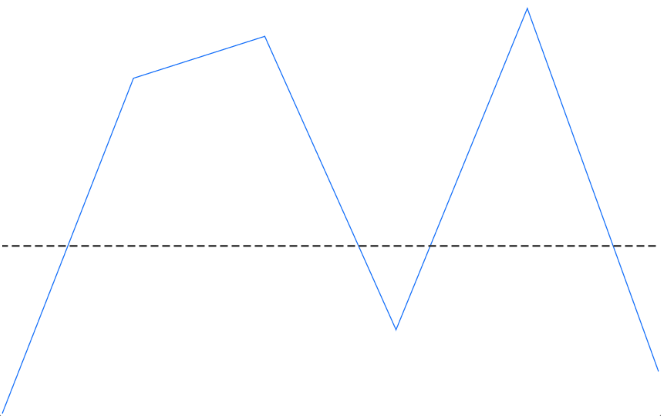
NOTE
Axis feature is applicable for all the SfSparkChart types except SfSparkWinLossChart.