Getting Started
20 Mar 201813 minutes to read
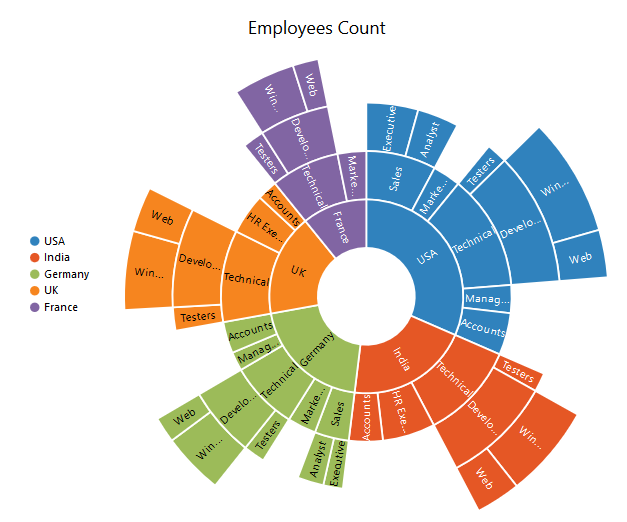
This section explains you the steps required to populate the Sunburst Chart with data, data labels, legend and title. This section covers only the minimal features that you need to know to get started with the Sunburst Chart.
Adding script reference
Create a HTML page and add the scripts references in the order mentioned in the following code example.
<!DOCTYPE html>
<html>
<head>
<!--  jquery script  -->
<script src="http://cdn.syncfusion.com/js/assets/external/jquery-2.1.4.min.js"></script>
<!-- Essential JS UI widget -->
<script src="http://cdn.syncfusion.com/14.2.0.26/js/web/ej.web.all.min.js"></script>
</head>
<body>
</body>
</html>
In the above code, ej.web.all.min.js script reference has been added for demonstration purpose. It is not recommended to use this for deployment purpose, as its file size is larger since it contains all the widgets. Instead, you can use ‘CSG’ utility to generate a custom script file with the required widgets for deployment purpose.
Initialize Sunburst Chart
- Add a div element that acts as a container for ejSunburstChart widget.
<!DOCTYPE html>
<html>
<body>
    <div id="chart"></div>
</body>
</html>
Populate Data source:
The datasource for the Sunburst Chart is populated as a JSON object. The “default_data” contains the JSON data for rendering the Sunburst Chart as shown in the sample.
var default_data = [

{ Category: "Employees", Country: "USA", JobDescription: "Sales", JobGroup: "Executive", EmployeesCount: 50 },
{ Category: "Employees", Country: "USA", JobDescription: "Sales", JobGroup: "Analyst", EmployeesCount: 40 },
{ Category: "Employees", Country: "USA", JobDescription: "Marketing", EmployeesCount: 40 },
{ Category: "Employees", Country: "USA", JobDescription: "Technical", JobGroup: "Testers", EmployeesCount: 55 },
{ Category: "Employees", Country: "USA", JobDescription: "Technical", JobGroup: "Developers", JobRole: "Windows", EmployeesCount: 175 },
{ Category: "Employees", Country: "USA", JobDescription: "Technical", JobGroup: "Developers", JobRole: "Web", EmployeesCount: 70 },
{ Category: "Employees", Country: "USA", JobDescription: "Management", EmployeesCount: 40 },
{ Category: "Employees", Country: "USA", JobDescription: "Accounts", EmployeesCount: 60 },

{ Category: "Employees", Country: "India", JobDescription: "Technical", JobGroup: "Testers", EmployeesCount: 43 },
{ Category: "Employees", Country: "India", JobDescription: "Technical", JobGroup: "Developers", JobRole: "Windows", EmployeesCount: 125 },
{ Category: "Employees", Country: "India", JobDescription: "Technical", JobGroup: "Developers", JobRole: "Web", EmployeesCount: 60 },
{ Category: "Employees", Country: "India", JobDescription: "HR Executives", EmployeesCount: 70 },
{ Category: "Employees", Country: "India", JobDescription: "Accounts", EmployeesCount: 45 },

{ Category: "Employees", Country: "Germany", JobDescription: "Sales", JobGroup: "Executive", EmployeesCount: 30 },
{ Category: "Employees", Country: "Germany", JobDescription: "Sales", JobGroup: "Analyst", EmployeesCount: 40 },
{ Category: "Employees", Country: "Germany", JobDescription: "Marketing", EmployeesCount: 50 },
{ Category: "Employees", Country: "Germany", JobDescription: "Technical", JobGroup: "Testers", EmployeesCount: 40 },
{ Category: "Employees", Country: "Germany", JobDescription: "Technical", JobGroup: "Developers", JobRole: "Windows", EmployeesCount: 65 },
{ Category: "Employees", Country: "Germany", JobDescription: "Technical", JobGroup: "Developers", JobRole: "Web", EmployeesCount: 27 },
{ Category: "Employees", Country: "Germany", JobDescription: "Management", EmployeesCount: 33 },
{ Category: "Employees", Country: "Germany", JobDescription: "Accounts", EmployeesCount: 55 },

{ Category: "Employees", Country: "UK", JobDescription: "Technical", JobGroup: "Testers", EmployeesCount: 45 },
{ Category: "Employees", Country: "UK", JobDescription: "Technical", JobGroup: "Developers", JobRole: "Windows", EmployeesCount: 96 },
{ Category: "Employees", Country: "UK", JobDescription: "Technical", JobGroup: "Developers", JobRole: "Web", EmployeesCount: 55 },
{ Category: "Employees", Country: "UK", JobDescription: "HR Executives", EmployeesCount: 60 },
{ Category: "Employees", Country: "UK", JobDescription: "Accounts", EmployeesCount: 30 },

{ Category: "Employees", Country: "France", JobDescription: "Technical", JobGroup: "Testers", EmployeesCount: 40 },
{ Category: "Employees", Country: "France", JobDescription: "Technical", JobGroup: "Developers", JobRole: "Windows", EmployeesCount: 65 },
{ Category: "Employees", Country: "France", JobDescription: "Technical", JobGroup: "Developers", JobRole: "Web", EmployeesCount: 27 },
{ Category: "Employees", Country: "France", JobDescription: "Marketing", EmployeesCount: 50 }

 ];
Initialize Sunburst Chart with data
Now, bind the default_Datasource to datasource property of the Sunburst Chart. Thelevels property determines the number of hierarchical levels. Each hierarchy level is formed based on the property specified in groupMemberPath property, and each arc segment size is calculated using valueMemberPath.
- Add a script tag anywhere in the web page and add the following code.
<script>
    $(function () {
        $("#chart").ejSunburstChart({
            dataSource: default_data,
            valueMemberPath: "EmployeesCount",
            levels: [
			{ groupMemberPath: "Country" },
            { groupMemberPath: "JobDescription" },
            { groupMemberPath: "JobGroup" },
            { groupMemberPath: "JobRole" }
            ],
        });
    });
</script>- The final HTML file appears as follows
<html>
<head>
    <script src="jquery-2.1.4.min.js" type="text/javascript"></script>
    <script src="ej.web.all.min.js"></script>
    <script src="Sunburst_Data.js"></script>
</head>
<body>
    <div id="chart"></div>
    <script>
        $(function () {
            $("#chart").ejSunburstChart({
                dataSource: default_DataSource,
                valueMemberPath: "EmployeesCount",
                levels: [
                { groupMemberPath: "Country" },
                { groupMemberPath: "JobDescription" },
                { groupMemberPath: "JobGroup" },
                { groupMemberPath: "JobRole" }
                ],
            });
        });

    </script>
</body>
</html>
Sunburst Chart Dimensions
You can set the size of the sunburst chart directly on the sunburst chart or to the container of the sunburst chart.
Set size for the container
You can customize the sunburst chart dimension by setting the width and height for the container element.
<body>
       <div id=”container” style=”width:820px; height:500px;”></div>
         <script type="text/javascript" language="javascript ">

            $(function () {
                $("#chart").ejSunburstChart();
            });
         </script>
    </body>
You can also set the sunburst chart dimension by using the size property of the sunburst chart. The width and height are set using the size property.
$("#chart").ejSunburstChart({
    // ...

    //Set size to sunburst chart container
    size: { width: '600', height: '450' },

});
Margin
Options to customize the left, right, top and bottom margins of sunburst area.
We can also place the sunburst area to the specified position by using the margin property.
The margin property of the sunburst area can further be customized in right,
left,top and bottom directions.
$("#chart").ejSunburstChart({

   margin : { right: 10 , top: 10, bottom: 10, left: 10 }

});
Segment border
By customizing the sunburst chart, the appearance of the sunburst chart can be improved. The sunburst chart segment border is modified with the object called border. It has two border property such as color and width. These are used to customize the border color and border width of the sunburst chart.
$("#chart").ejSunburstChart({

   segmentBorder: { color: "green", width:2 }

});
Add Title to the Sunburst Chart
The title of the Sunburst chart is used to provide quick information to the user about the data being plotted in the Sunburst Chart. You can add it by using the text property of the title
Using font property, you can customize font family, font style, font weight, opacity, size options.
$("#chart").ejSunburstChart ({

  title: {text: "Employees Count",font: {color:"black",fontWeight:"bold",size:"15px"}},

   });
Add Subtitle to the Sunburst Chart
By using the subTitle option, you can add the subTitle to the sunburst chart title and customize its border, background color and font.
You can customize font family, font style, font weight, opacity,
size options.
$("#chart").ejSunburstChart ({

  title: { subtitle : {text: "Employees Count",font: {color:"black",fontWeight:"bold",size:"15px"}}},

   });
Enable Legend
You can enable or disable the legend by using the visible property present inside the legend
$("#chart").ejSunburstChart ({

  legend: { visible:true, position: "left" }

   });
Add Data Labels
The data labels are used to improve the readability of the Sunburst chart. This can be achieved by enabling the visible property in the datalabelSettings.
$("#chart").ejSunburstChart ({

  datalabelSettings: { visible:true}

   });
Now the Sunburst Chart is rendered along with the specified customizations
Sunburst Chart Visibility
You can enable or disable it by using the visible option.
$("#chart").ejSunburstChart({

   visible : true

});
Click here to view the default sample of the SunburstChart