How can I help you?
Data Label in JavaScript SunburstChart
Sunburst data labels are used to display the data related to the segment. It helps to provide the information about the data points to the users.
You can enable or disable the data labels by setting the visible property of the dataLabelSettings to true as shown in the below code
$("#chart"). ejSunburstChart ({

	 dataLabelSettings:{visible:true},
   });
Label Overflow mode
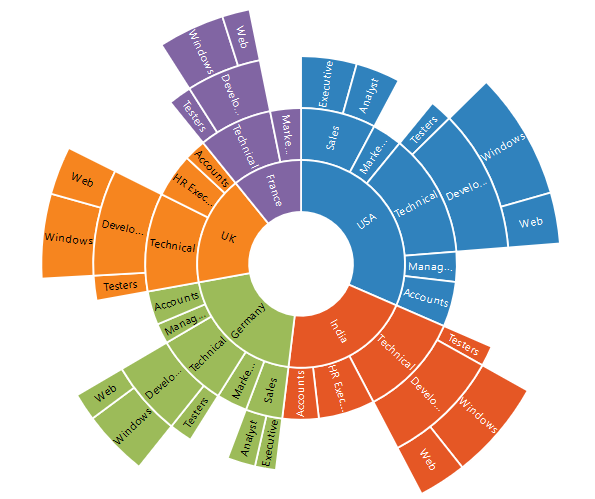
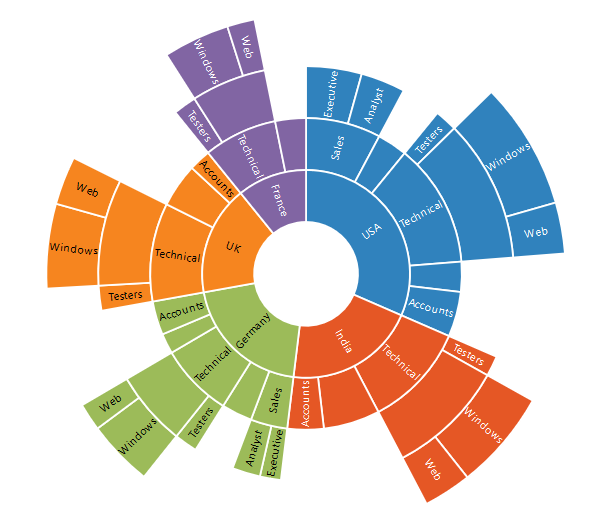
When you represent huge data with data labels, they may intersect each other. You can avoid this using the labelOverflowMode property.
The following properties are used to avoid the overlapping.
- Trim – To trim the large data labels.
- Hide – To hide the overlapped data labels.
The following code shows how to set Hide and Trim mode.
$("#chart"). ejSunburstChart ({

	dataLabelSettings: {visible: true,labelOverflowMode:"hide"},
   });
$("#chart"). ejSunburstChart ({

	dataLabelSettings: {visible: true,labelOverflowMode:"trim"},
   });
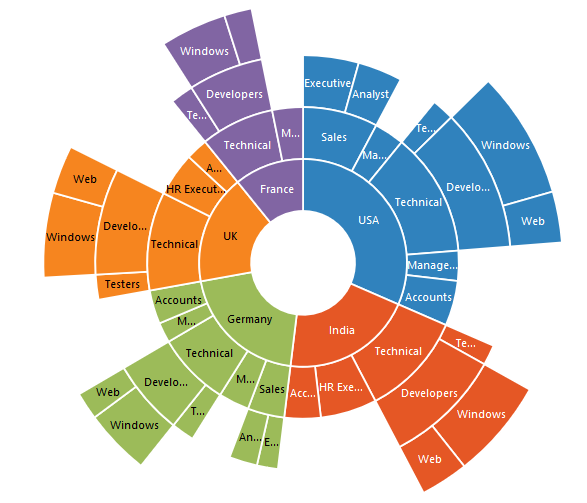
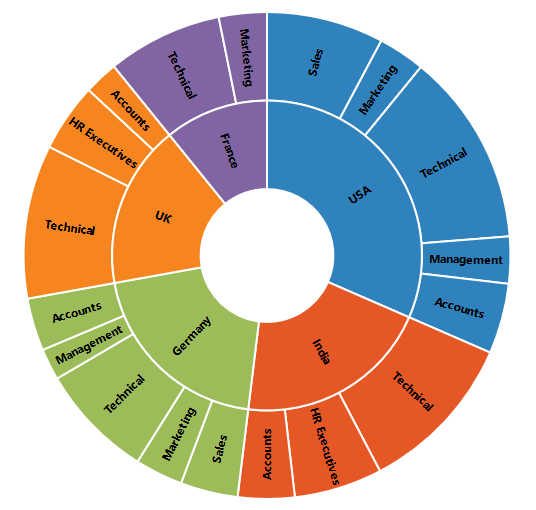
Label Rotation Mode
You can rotate the data label by using labelRotationMode property. By default, the labelRotationMode is set as angle.
The following code shows how to set labelRotationMode as normal and angle.
$("#chart"). ejSunburstChart ({

	dataLabelSettings: {visible: true,labelRotationMode:"normal"},
   });
$("#chart"). ejSunburstChart ({

	dataLabelSettings: {visible: true,labelRotationMode:"angle"},
   });
Customizing the data labels
You can customize the appearance of the data point using the font property.
Using font property, you can customize font color, font family, font style, font weight, opacity, size options.
The color for the datalabel text is set by using the fill property.
$("#chart"). ejSunburstChart ({
	dataLabelSettings: {visible: true, font: {color:"black",fontWeight:"bold",size:"15px"}},
   });
Data Label Template
Label content can be formatted by using the template option.
<div id="item">
     <div id="left">
	<img src="../images/chart/icon_investments.png"/>
     </div>
     <div id="right">
          <div id="point">#point.y#%</div>
     </div>
</div>

$("#chart").ejSunburstChart({
    dataLabelSettings :{ template: "item" }
});