How can I help you?
Series in JavaScript PivotChart
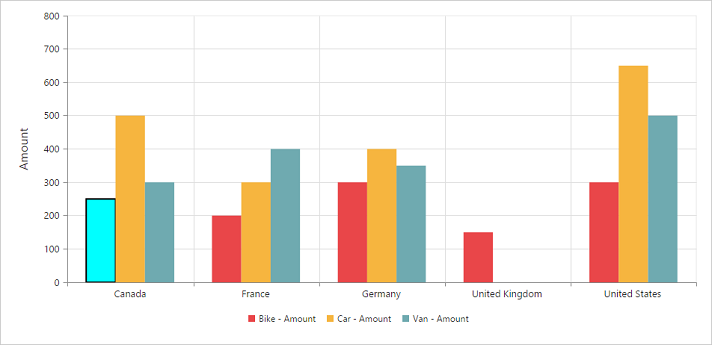
Series point customization
By using the fill and border properties of the chart series, you can customize the series color, border color, and border width of the pivot chart.
$(function()
{
    $("#PivotChart1").ejPivotChart(
    {
        ....
        commonSeriesOptions:
        {
            type: ej.PivotChart.ChartTypes.Column
        },
        seriesRendering: "onSeriesRender"
    });
});

function onSeriesRender(args)
{
    this.model.series[0].points[0].fill = "aqua";
    this.model.series[0].points[0].border = {
        color: "black",
        width: 2
    };
}