How can I help you?
Overview
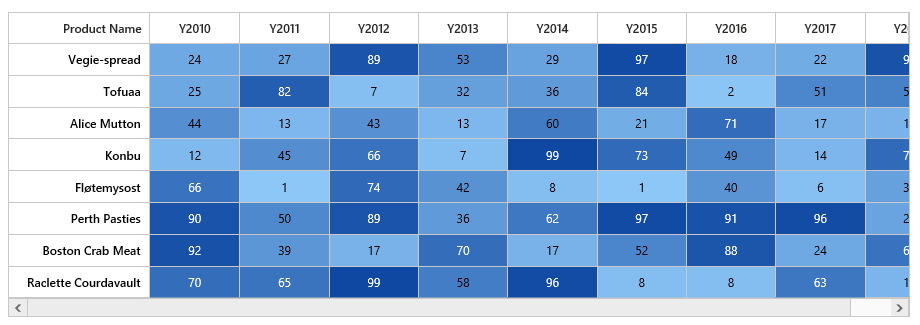
Essential HeatMap JS represents tabular data values as gradient colors instead of numbers. Low and high values are different colors with different gradients.
Key features:
- 2 types of data source mapping (TableMapping, CellMapping)
- Color mapping
- Legend
- Virtualization