Getting Started
13 Feb 201810 minutes to read
Initialize the HeatMap
1. Create an HTML file and add the necessary script references and style sheets in the Head tag as shown in the following code example.
<!DOCTYPE html>
<html>
<head>
	<title>Getting Started With Diagram Control For Javascript</title>
	<!-- jQuery Script -->
	<script src="http://code.jquery.com/jquery-2.1.4.min.js"></script>
	<script src="http://cdnjs.cloudflare.com/ajax/libs/jquery-easing/1.3/jquery.easing.min.js"></script>
	<!--script to create Diagram-->
	<script src="http://cdn.syncfusion.com/32.1.19/js/web/ej.web.all.min.js"></script>
</head>
<body></body>
</html>
2. Add a placeholder div element that can be used to initialize the heat map widget as shown below.
<body>
    <div id="heatmap"></div>
    <script type="text/javascript">
        $("#heatmap").ejHeatMap({
            width: "100%",
            height: "300px"
        });
    </script>
</body>
Prepare and Populate data
Populate product information in a collection.
var itemsSource = [];
var rows = ["Vegie-spread", "Tofuaa", "Alice Mutton", "Konbu", "Fløtemysost", "Perth Pasties", "Boston Crab Meat", "Raclette Courdavault"];
for (var i = 0; i < 8; i++) {
itemsSource.push({
ProductName: rows[i],
Y2010: getValue(),
Y2011: getValue(),
Y2012: getValue(),
Y2013: getValue(),
Y2014: getValue(),
Y2015: getValue(),
Y2016: getValue(),
Y2017: getValue(),
Y2018: getValue()
});
}
$("#heatmap").ejHeatMap({
itemsSource: itemsSource,
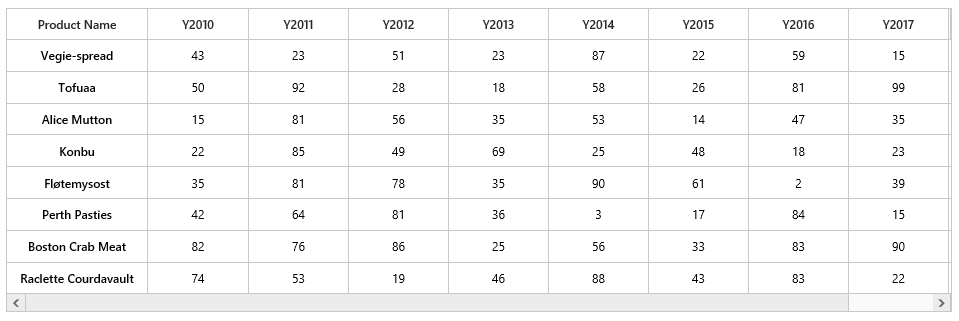
});Map data into HeatMap
Now data is ready, next we need to configure data source and map rows and columns to visualize.
-
Prepare itemsMapping and add it in resource.
var headerMapping = { "propertyName": "ProductName", "displayName": "Product Name", columnStyle: { width: 140 } };
var columnMapping = [
    { "propertyName": "Y2010", "displayName": "Y2010", columnStyle: { width: 100 } },
    { "propertyName": "Y2011", "displayName": "Y2011", columnStyle: { width: 100 } },
    { "propertyName": "Y2012", "displayName": "Y2012", columnStyle: { width: 100 } },
    { "propertyName": "Y2013", "displayName": "Y2013", columnStyle: { width: 100 } },
    { "propertyName": "Y2014", "displayName": "Y2014", columnStyle: { width: 100 } },
    { "propertyName": "Y2015", "displayName": "Y2015", columnStyle: { width: 100 } },
    { "propertyName": "Y2016", "displayName": "Y2016", columnStyle: { width: 100 } },
    { "propertyName": "Y2017", "displayName": "Y2017", columnStyle: { width: 100 } },
    { "propertyName": "Y2018", "displayName": "Y2018", columnStyle: { width: 100 } },
];- Set itemsSource and mapping
$("#heatmap").ejHeatMap({
    itemsSource: itemsSource,
    itemsMapping: {
        headerMapping: headerMapping,
        columnMapping: columnMapping,
    },
});
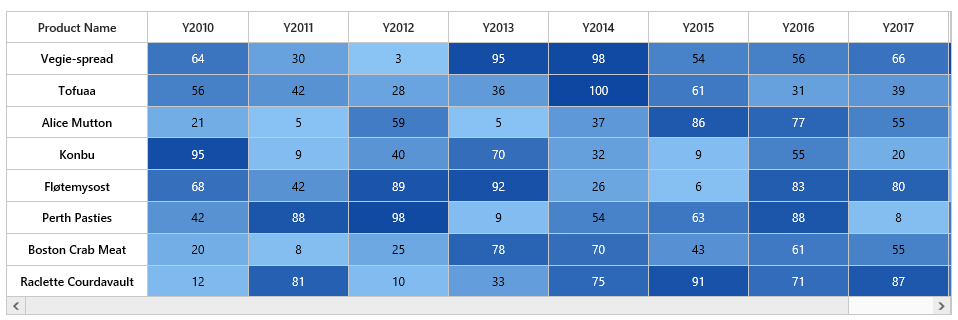
Color Mapping
Next we can configure color range for these values by using colorMappingCollection property of the HeatMap.
- Configure items mapping based on items source.
var colorMappingCollection = [
    { value: 0, color: "#8ec8f8", label: { text: "0" } },
    { value: 100, color: "#0d47a1", label: { text: "100" } },
];- Set ColorMapping
$("#heatmap").ejHeatMap({
    colorMappingCollection: colorMappingCollection,
    isResponsive: true,
    itemsSource: itemsSource,
    itemsMapping: {
        headerMapping: headerMapping,
        columnMapping: columnMapping,
    }
});- This will show the grid data with color based on the range given.
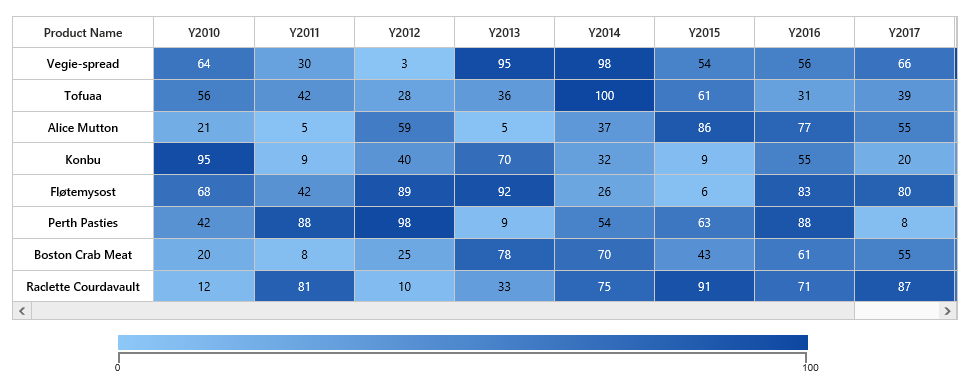
Legend
13 Feb 201810 minutes to read
-
A legend control is used to represent range value in a gradient, create a legend with the same color mapping as shown below.
-
You can use legendCollection to specify the number of legends that can sync with heat map.
$("#heatmap_legend").ejHeatMapLegend({
    width: "75%",
    height: "50px"
});
Final HTML page looks like this.
<html>
    <body>
        <div id="heatmap"></div>
        <div id="heatmap_legend"></div>
    </body>
</html>
Final script file looks like this.
var colorMappingCollection = [
    { value: 0, color: "#8ec8f8", label: { text: "0" } },
    { value: 100, color: "#0d47a1", label: { text: "100" } },
];

var itemsSource = [];
var rows = ["Vegie-spread", "Tofuaa", "Alice Mutton", "Konbu", "Fløtemysost", "Perth Pasties", "Boston Crab Meat", "Raclette Courdavault"];
for (var i = 0; i < 8; i++) {
    itemsSource.push({
        ProductName: rows[i], Y2010: getValue(), Y2011: getValue(), Y2012: getValue(), Y2013: getValue(),
        Y2014: getValue(), Y2015: getValue(), Y2016: getValue(), Y2017: getValue(), Y2018: getValue()
    });
}

var headerMapping = { "propertyName": "ProductName", "displayName": "Product Name", columnStyle: { width: 140 } };
var columnMapping = [
    { "propertyName": "Y2010", "displayName": "Y2010", columnStyle: { width: 100 } },
    { "propertyName": "Y2011", "displayName": "Y2011", columnStyle: { width: 100 } },
    { "propertyName": "Y2012", "displayName": "Y2012", columnStyle: { width: 100 } },
    { "propertyName": "Y2013", "displayName": "Y2013", columnStyle: { width: 100 } },
    { "propertyName": "Y2014", "displayName": "Y2014", columnStyle: { width: 100 } },
    { "propertyName": "Y2015", "displayName": "Y2015", columnStyle: { width: 100 } },
    { "propertyName": "Y2016", "displayName": "Y2016", columnStyle: { width: 100 } },
    { "propertyName": "Y2017", "displayName": "Y2017", columnStyle: { width: 100 } },
    { "propertyName": "Y2018", "displayName": "Y2018", columnStyle: { width: 100 } },
];

var heatmap = $("#heatmap").ejHeatMap({
    colorMappingCollection: colorMappingCollection,
    isResponsive: true,
    itemsSource: itemsSource,
    itemsMapping: {
        headerMapping: headerMapping,
        columnMapping: columnMapping,
    },
    legendCollection: ["heatmap_legend"]
});

var heatmaplegend = $("#heatmap_legend").ejHeatMapLegend({
    colorMappingCollection: colorMappingCollection,
    height: "50px",
    width: "75%",
    isResponsive: true,
});