How can I help you?
Tools
Drawing Tools
Drawing tool allows you to draw any kind of node/connector during runtime by clicking and dragging on the Diagram page.
Shapes
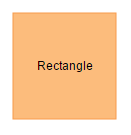
To draw a shape, you need to set the JSON of that shape to the drawType property of the Diagram model and you have to activate the drawing tool by using the tool property. The following code example illustrates how to draw a rectangle at run time.
var diagram = $("#diagram").ejDiagram("instance");

//JSON to create a rectangle
diagram.model.drawType = {
	type: ej.datavisualization.Diagram.Shapes.Basic,
	shape: "rectangle",
	//customize the appearance of the shape
	fillColor: "#fcbc7c",
	borderColor: "#f89b4c",
	labels: [{
		"text": "Rectangle"
	}]
};

//To draw an object once, activate draw once
diagram.update({
	tool: ej.datavisualization.Diagram.Tool.DrawOnce,
});

//To draw an object multiple times, activate continuous draw tool
diagram.update({
	tool: ej.datavisualization.Diagram.Tool.ContinuesDraw,
});
The following code example illustrates how to draw a path.
var diagram = $("#diagram").ejDiagram("instance");
diagram.model.drawType = {
	name: "Path",
	fillColor: "#fbe172",
	labels: [{
		text: "Path"
	}],
	shape: "path",
	pathData: "M13.560 67.524 L 21.941 41.731 L 0.000 25.790 L 27.120 25.790 L 35.501 0.000 L 43.882 25.790 L 71.000 25.790 L 49.061 41.731 L 57.441 67.524 L 35.501 51.583 z"
};

//To draw an object once, activate draw once
diagram.update({
	tool: ej.datavisualization.Diagram.Tool.DrawOnce,
});
Connectors
To draw connectors, you have to set the JSON of the connector to drawType property. The drawing tool can be activated by using the tool property as shown. The following code example illustrates how to draw a straight line connector.
var diagram = $("#diagram").ejDiagram("instance");
//JSON to create a straight line connector
diagram.model.drawType = {
	type: "connector",
	segments: [{
		type: "straight"
	}]
};
//To draw an object once, activate draw once
diagram.update({
	tool: ej.datavisualization.Diagram.Tool.DrawOnce
});
Text
Diagram allows you to create a textNode as soon as you click on the Diagram page. The following code illustrates how to draw a text.
var diagram = $("#diagram").ejDiagram("instance");

//JSON to draw a text
diagram.model.drawType = { type: "text" };

diagram.update({
	tool: ej.datavisualization.Diagram.Tool.DrawOnce
});
Once you activate the TextTool, you can also able to perform label editing of a node/connector.
Polygon Shape
Diagram allows to create the polygon shape by clicking and moving the mouse at run time on the diagram page.
The following code illustrates how to draw a polygon shape.
var diagram = $("#diagram").ejDiagram("instance");
    // set the default segment type as polyline
    diagram.model.drawType = {
        type: ej.datavisualization.Diagram.Shapes.Basic,
		shape: ej.datavisualization.Diagram.BasicShapes.Polygon
    };
    var tool = diagram.tool();
    //To draw an object once, activate draw once
    diagram.update({ tool: tool | ej.datavisualization.Diagram.Tool.DrawOnce })
Polyline Connector
Diagram allows to create the polyline segments with straight lines and angled vertices at the control points by clicking and moving the mouse at run time on the diagram page.
The following code illustrates how to draw a polyline connector.
var diagram = $("#diagram").ejDiagram("instance");
    // set the default segment type as polyline
    diagram.model.drawType = {
        type: "connector",
        segments: [{ type: "polyline" }]
    };
    var tool = diagram.tool();
    //To draw an object once, activate draw once
    diagram.update({ tool: tool | ej.datavisualization.Diagram.Tool.DrawOnce })
SetTool
-
The setTool method is provided for the purpose to decide which action needs to be performed when mouse hover on the port such as whether to draw connector on port hover or drag ports and it can be decided by using setTool’s
actionargument. -
You can get the parent of the port i.e. node by using port’s parent property.
-
The method will be triggered always when mouse hover on the diagram.
Tool Selection
There are some functionalities that can be achieved by clicking and dragging on the Diagram surface. They are as follows.
- Draw selection rectangle - MultipleSelect tool
- Pan the Diagram - Zoom pan
- Draw nodes/connectors - ContinuousDraw / DrawOnce
As all the three behaviors are completely different, You can achieve only one behavior at a time based on the tool that you choose.
When more than one of those tools are applied, a tool is activated based on the precedence given in the following table.
| Precedence | Tools | Description |
|---|---|---|
| 1st | ContinuesDraw | Allows you to draw the nodes or connectors continuously. Once it is activated, you cannot perform any other interaction in the Diagram. |
| 2nd | DrawOnce | Allows you to draw single node or connector. Once you complete the drawOnce action, SingleSelect and MultipleSelect tools are automatically enabled. |
| 3rd | ZoomPan | Allows you to pan the Diagram. When you enable both the SingleSelect and ZoomPan tools, you can perform the basic interaction as the cursor hovers node/connector. Panning is enabled when cursor hovers the Diagram. |
| 4th | MultipleSelect | Allows you to select multiple nodes and connectors. When you enable both the MultipleSelect and ZoomPan tools, cursor hovers the Diagram. When panning is enabled, you cannot select multiple nodes. |
| 5th | SingleSelect | Allows you to select individual nodes or connectors. |
| 6th | None | Disables all tools |
You can set the desired tool to the tool property of the Diagram model. The following code illustrates how to enable single/multiple tools.
// To Enable Single Tool
$("#diagram").ejDiagram({
	//Enables a Single Selection
	tool: ej.datavisualization.Diagram.Tool.SingleSelect
});

// Enables multiple tools
$("#diagram").ejDiagram({
	// Selects when you click a node and pans when you click the Diagram surface
	tool: ej.datavisualization.Diagram.Tool.SingleSelect | ej.datavisualization.Diagram.Tool.ZoomPan
});