Getting Started with the Vue Gantt Chart Component in Vue 2
This article provides a step-by-step guide for setting up a Vue 2 project using Vue CLI and integrating the Vue Gantt Chart component.
To get started quickly with Vue Gantt Chart, check this video:
This article uses the standard Vue 2 component registration pattern with Vue CLI.
Prerequisites
Before you begin, make sure that:
- Node.js and npm (or Yarn) are installed.
- Vue CLI is installed globally if it is not already available.
- You are using a Vue 2 project, since this example is intended for Vue 2.
- You are using a supported Node.js version for Vue CLI and the Syncfusion package; verify the installation with
node -vandnpm -v.
For compatibility details, see System requirements for Syncfusion® Vue UI components.
Set up the Vue 2 project
Create a new Vue 2 project using Vue CLI:
npm install -g @vue/cli
vue create quickstart
cd quickstart
or
yarn global add @vue/cli
vue create quickstart
cd quickstart
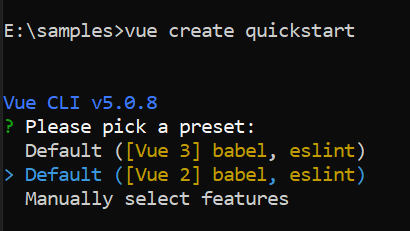
When creating a new project, choose the option Default ([Vue 2] babel, eslint) from the menu.
Add Syncfusion® Vue packages
Syncfusion® packages are available at npm package registry. To use Vue components, install the required npm package.
This article uses the Vue Gantt Chart component as an example. Install the @syncfusion/ej2-vue-gantt package by running the following command:
npm install @syncfusion/ej2-vue-gantt --saveor
yarn add @syncfusion/ej2-vue-ganttAdding CSS reference
Themes for Syncfusion® Gantt Chart components can be applied using CSS files provided through npm theme packages. For available themes, refer to the Themes documentation.
Install the Tailwind 3 theme package using the following command:
npm install @syncfusion/ej2-tailwind3-theme --saveThen add the following CSS reference to the src/App.vue file:
<style>
    @import "../node_modules/@syncfusion/ej2-tailwind3-theme/styles/gantt/index.css";
</style>
Create sample data
Define a simple task list with hierarchical relationships. Each task must have a StartDate and either a Duration or EndDate to render properly.
const data = [
  {
    TaskID: 1,
    TaskName: "Project initiation",
    StartDate: new Date("2024-04-01"),
    EndDate: new Date("2024-04-15"),
  },
  {
    TaskID: 2,
    TaskName: "Identify site location",
    StartDate: new Date("2024-04-01"),
    Duration: 4,
    Progress: 70,
    ParentID: 1,
  },
  {
    TaskID: 3,
    TaskName: "Perform site survey",
    StartDate: new Date("2024-04-01"),
    Duration: 4,
    Progress: 50,
    ParentID: 1,
  },
  {
    TaskID: 4,
    TaskName: "Soil testing",
    StartDate: new Date("2024-04-01"),
    Duration: 3,
    Progress: 40,
    ParentID: 1,
  },
  {
    TaskID: 5,
    TaskName: "Project estimation",
    StartDate: new Date("2024-04-08"),
    EndDate: new Date("2024-04-18"),
  },
  {
    TaskID: 6,
    TaskName: "Develop floor plan",
    StartDate: new Date("2024-04-08"),
    Duration: 5,
    Progress: 30,
    ParentID: 5,
  },
  {
    TaskID: 7,
    TaskName: "Estimate project cost",
    StartDate: new Date("2024-04-08"),
    Duration: 5,
    Progress: 20,
    ParentID: 5,
  },
];
Configure task fields
Each task object in the dataSource array should include a StartDate and either a Duration or an EndDate. The taskFields mapping connects your data properties to the Gantt Chart component.
const taskFields = {
  id: "TaskID",
  name: "TaskName",
  startDate: "StartDate",
  endDate: "EndDate",
  duration: "Duration",
  progress: "Progress",
  parentID: "ParentID",
};
Field mapping reference
| Property | Description | Required |
|---|---|---|
id |
Unique task identifier | Yes |
name |
Task display name | Yes |
startDate |
Task start date | Yes |
duration |
Task duration in days | Yes |
progress |
Task completion percentage (0-100) | No |
parentID |
Parent task ID for hierarchy | No |
Render the Gantt Chart component
Replace the default src/App.vue content with the following example, or add the sample code to the existing App.vue file. Ensure that the Gantt Chart component is imported and registered in the <script> section so that Vue can recognize and render it within the template.
To display the Gantt Chart, bind your task data using the dataSource property and map the corresponding fields using the taskFields property.
<template>
     <div>
        <ejs-gantt ref='gantt' :dataSource="data" :taskFields="taskFields"></ejs-gantt>
    </div>
</template>
<script>
import { GanttComponent } from "@syncfusion/ej2-vue-gantt";
export default {
name: "App",
  components: {
    'ejs-gantt': GanttComponent // Component registration
  },
  data: function() {
    return{
      data: [
        {TaskID: 1, TaskName: 'Project initiation', StartDate: new Date('2024-04-01'), EndDate: new Date('2024-04-15')},
        {TaskID: 2, TaskName: 'Identify site location', StartDate: new Date('2024-04-01'), Duration: 4, Progress: 70, ParentID: 1},
        {TaskID: 3, TaskName: 'Perform site survey', StartDate: new Date('2024-04-01'), Duration: 4, Progress: 50, ParentID: 1},
        {TaskID: 4, TaskName: 'Soil testing', StartDate: new Date('2024-04-01'), Duration: 3, Progress: 40, ParentID: 1},
        {TaskID: 5, TaskName: 'Project estimation', StartDate: new Date('2024-04-15'), EndDate: new Date('2024-04-25')},
        {TaskID: 6, TaskName: 'Develop floor plan', StartDate: new Date('2024-04-15'), Duration: 5, Progress: 30, ParentID: 5},
        {TaskID: 7, TaskName: 'Estimate project cost', StartDate: new Date('2024-04-15'), Duration: 5, Progress: 20, ParentID: 5}
      ],
      taskFields: {
        id: 'TaskID',
        name: 'TaskName',
        startDate: 'StartDate',
        duration: 'Duration',
        progress: 'Progress',
        parentID: 'ParentID'
      }
    };
  },
};
</script>
<style>
    @import "../node_modules/@syncfusion/ej2-tailwind3-theme/styles/gantt/index.css";
</style>
Run the application
Now run the following command in the console:
npm run serveIf you used Yarn to install the project dependencies, run the following command instead:
yarn serveIt will build your application and open it in the web browser.
If the app does not start, verify that the dependencies were installed successfully and that you are running the command from the project folder.
Output
You will see a Gantt Chart with:
- Task hierarchy with parent-child relationships
- Timeline view showing task bars
- Progress indicators on each task
- Automatically calculated dates based on duration
The chart displays two parent tasks (“Project initiation” and “Project estimation”) with their subtasks shown in a tree structure. Task bars are rendered on the timeline, sized according to their duration and start dates.
You can preview the following sample by clicking the Preview Sample button.
<template>
  <div>
    <ejs-gantt ref='gantt' :dataSource="data" :taskFields="taskFields"></ejs-gantt>
  </div>
</template>

<script>
import { GanttComponent } from "@syncfusion/ej2-vue-gantt";
export default {
  name: "App",
  components: {
    'ejs-gantt': GanttComponent
  },
  data: function () {
    return {
      data: [
        { TaskID: 1, TaskName: 'Project initiation', StartDate: new Date('2024-04-01'), EndDate: new Date('2024-04-15') },
        { TaskID: 2, TaskName: 'Identify site location', StartDate: new Date('2024-04-01'), Duration: 4, Progress: 70, ParentID: 1 },
        { TaskID: 3, TaskName: 'Perform site survey', StartDate: new Date('2024-04-01'), Duration: 4, Progress: 50, ParentID: 1 },
        { TaskID: 4, TaskName: 'Soil testing', StartDate: new Date('2024-04-01'), Duration: 3, Progress: 40, ParentID: 1 },
        { TaskID: 5, TaskName: 'Project estimation', StartDate: new Date('2024-04-08'), EndDate: new Date('2024-04-18') },
        { TaskID: 6, TaskName: 'Develop floor plan', StartDate: new Date('2024-04-08'), Duration: 5, Progress: 30, ParentID: 5 },
        { TaskID: 7, TaskName: 'Estimate project cost', StartDate: new Date('2024-04-08'), Duration: 5, Progress: 20, ParentID: 5 }
      ],
      taskFields: {
        id: 'TaskID',
        name: 'TaskName',
        startDate: 'StartDate',
        duration: 'Duration',
        progress: 'Progress',
        parentID: 'ParentID'
      }
    };
  },
};
</script>

<style>
@import "../node_modules/@syncfusion/ej2-tailwind3-theme/styles/gantt/index.css";
</style>Next Steps
- Key Elements - Learn about UI components and interactions
- Feature Modules - Enable advanced features with module injection
- Overview - Explore all available features