Task Markers and Milestones in ASP.NET Core Gantt Chart
Data markers are visual indicators that highlight significant events, milestones, or important dates within individual project tasks. These markers provide immediate visual context about critical moments in task timelines, enabling effective identification of key dates and tracking of important events at the task level. Understanding data markers implementation ensures effective project visualization and milestone tracking throughout project development cycles.
Data markers utilize specific properties to define their appearance, positioning, and interactive behavior within task timelines:
Date specification: The date property establishes the exact timeline position where the marker appears. This date value determines marker placement relative to the task’s start and end dates, ensuring accurate event representation.
Visual styling: The iconClass property defines the CSS class that controls marker visual appearance. This property enables custom styling through icon fonts, background images, or CSS-based graphics to distinguish different marker types.
Identification: The name property provides unique identification for each marker. This name serves as an internal reference and can be used for programmatic marker manipulation or event handling.
Interactive content: The tooltip property supplies descriptive text that displays when users hover over markers. This property enhances user experience by providing detailed context about marker significance and related event information.
Tooltip Rendering Requirements: Data marker tooltips render only when the tooltip property contains valid content values. Empty or undefined tooltip properties result in no tooltip display, maintaining clean visual presentation for markers without additional descriptions.
Data mapping and configuration properties
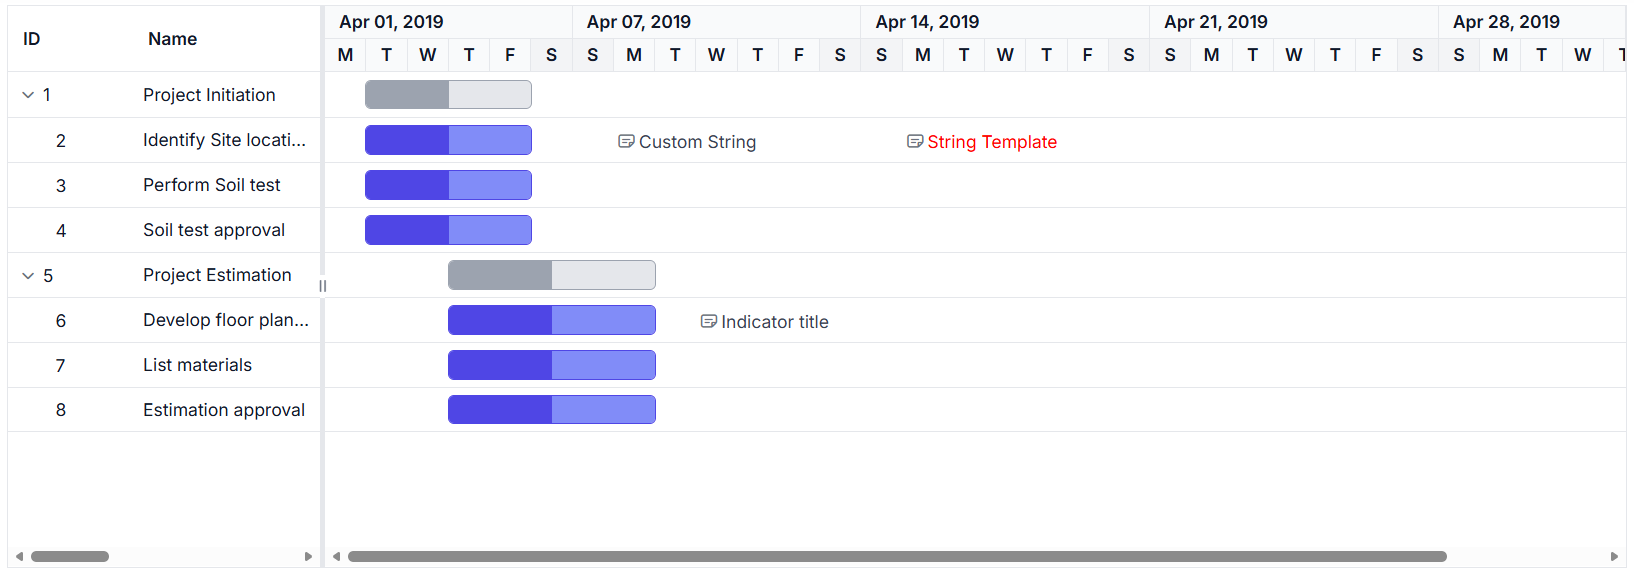
Data markers represent schedule events for specific tasks through visual indicators positioned at designated dates within task timelines. The control renders markers as icon-based elements that display at precise timeline locations, providing instant visual reference for important task-related events.
Data structure requirements: Data markers are defined in the data source as arrays of objects containing marker specifications. Each marker object includes date information, visual styling, identification details, and optional tooltip content for enhanced user interaction.
Mapping configuration: The marker array connects to the Gantt Chart control through the taskFields.indicators property mapping. This configuration establishes the relationship between data source marker definitions and control rendering logic.
Multiple marker support: Tasks can display multiple data markers simultaneously, allowing comprehensive event tracking within individual task contexts. Each marker maintains independent configuration while sharing the same task timeline space.
The following implementation demonstrates comprehensive data marker integration within a Gantt chart, showcasing multiple markers per task with varied styling and tooltip configurations:
@page
@model IndexModel

<ejs-gantt id='Gantt' dataSource="@Model.GanttDataSourceCollection" height="450px">
    <e-gantt-taskfields id="TaskId" name="TaskName" startDate="StartDate"
          endDate="EndDate" duration="Duration" progress="Progress" parentId="ParentId" indicators="Indicators">
    </e-gantt-taskfields>
</ejs-gantt>
using Microsoft.AspNetCore.Mvc.RazorPages;
namespace CoreSamples.Pages
{
public class IndexModel : PageModel
{
public List<GanttDataSource> GanttDataSourceCollection { get; set; }
public void OnGet()
{
GanttDataSourceCollection = GetTaskCollection();
}
private List<GanttDataSource> GetTaskCollection()
{
return new List<GanttDataSource>()
{
new GanttDataSource
{
TaskId = 1,
TaskName = "Project Initiation",
StartDate = new DateTime(2019, 4, 2),
EndDate = new DateTime(2019, 4, 21)
},
new GanttDataSource
{
TaskId = 2,
TaskName = "Identify Site location",
StartDate = new DateTime(2019, 4, 2),
Duration = 4,
Progress = 50,
ParentId = 1,
Indicators = new List<IndicatorsModel>()
{
new IndicatorsModel { date = "04/08/2019", iconClass = "e-btn-icon e-notes-info e-icons e-icon-left e-gantt e-notes-info::before", name = "Custom String", tooltip = "Follow up" },
new IndicatorsModel { date = "04/15/2019", iconClass = "e-btn-icon e-notes-info e-icons e-icon-left e-gantt e-notes-info::before", name = "<span style='color:red'>String Template</span>" }
}
},
new GanttDataSource
{
TaskId = 3,
TaskName = "Perform Soil test",
StartDate = new DateTime(2019, 4, 2),
Duration = 4,
Progress = 50,
ParentId = 1
},
new GanttDataSource
{
TaskId = 4,
TaskName = "Soil test approval",
StartDate = new DateTime(2019, 4, 2),
Duration = 4,
Progress = 50,
ParentId = 1
},
new GanttDataSource
{
TaskId = 5,
TaskName = "Project Estimation",
StartDate = new DateTime(2019, 4, 2),
EndDate = new DateTime(2019, 4, 21)
},
new GanttDataSource
{
TaskId = 6,
TaskName = "Develop floor plan for estimation",
StartDate = new DateTime(2019, 4, 4),
Duration = 3,
Progress = 50,
ParentId = 5,
Indicators = new List<IndicatorsModel>()
{
new IndicatorsModel { date = "04/10/2019", iconClass = "e-btn-icon e-notes-info e-icons e-icon-left e-gantt e-notes-info::before", name = "Indicator title", tooltip = "tooltip" }
}
},
new GanttDataSource
{
TaskId = 7,
TaskName = "List materials",
StartDate = new DateTime(2019, 4, 4),
Duration = 3,
Progress = 50,
ParentId = 5
},
new GanttDataSource
{
TaskId = 8,
TaskName = "Estimation approval",
StartDate = new DateTime(2019, 4, 4),
Duration = 3,
Progress = 50,
ParentId = 5
}
};
}
}
public class GanttDataSource
{
public int TaskId { get; set; }
public string TaskName { get; set; }
public DateTime? StartDate { get; set; }
public DateTime? EndDate { get; set; }
public int? Duration { get; set; }
public int? Progress { get; set; }
public int? ParentId { get; set; }
public List<IndicatorsModel> Indicators { get; set; }
}
public class IndicatorsModel
{
public string date { get; set; }
public string iconClass { get; set; }
public string name { get; set; }
public string tooltip { get; set; }
}
}
Custom event bind to data markers
Data markers support interactive functionality through click event binding, enabling custom actions when markers are selected. This interaction capability allows the implementation of detailed views, status updates, or navigation to related information based on marker context.
Event binding implementation: Click events are bound to data markers using the dataBound event of the Gantt Chart control. This event fires after data binding completes, ensuring all marker elements are rendered and available for event attachment.
DOM element selection: Data markers render with the CSS class .e-indicator-span, which serves as the selector for identifying marker elements within the DOM. This class provides a reliable reference for event binding regardless of marker styling or content variations.
The following implementation demonstrates how to open the edit dialog for a specific task when its data marker is clicked:
@page
@model IndexModel

<ejs-gantt id='Gantt' height="450px" dataSource="@Model.GanttDataSourceCollection" editSettings="@(new Syncfusion.EJ2.Gantt.GanttEditSettings { AllowEditing = true })" toolbar="@(new List<string>() { "Edit" })" dataBound="dataBound">
    <e-gantt-taskfields id="TaskId" name="TaskName" startDate="StartDate"
                        endDate="EndDate" duration="Duration" progress="Progress" parentId="ParentId" indicators="Indicators">
    </e-gantt-taskfields>
</ejs-gantt>
<script>
    function dataBound() {
        var gantt = document.getElementById("Gantt").ej2_instances[0];
        var elements = document.querySelectorAll('.e-indicator-span');
        for (var i = 0; i < elements.length; i++) {
            elements[i].addEventListener('click', function(event) {
                // Find the task row that contains the clicked indicator.
                var indicatorElement = event.target;
                var taskRow = indicatorElement.closest('tr.e-chart-row');
                if (taskRow && gantt) {
                    // Get the task ID from the row data.
                    var rowIndex = parseInt(taskRow.getAttribute('data-rowindex') || '0', 10);
                    var record = gantt.flatData[rowIndex];
                    if (record && record.ganttProperties.taskId) {
                        // Open edit dialog for the specific task.
                        gantt.openEditDialog(record.ganttProperties.taskId);
                    }
                }
            });
        }
    }
</script>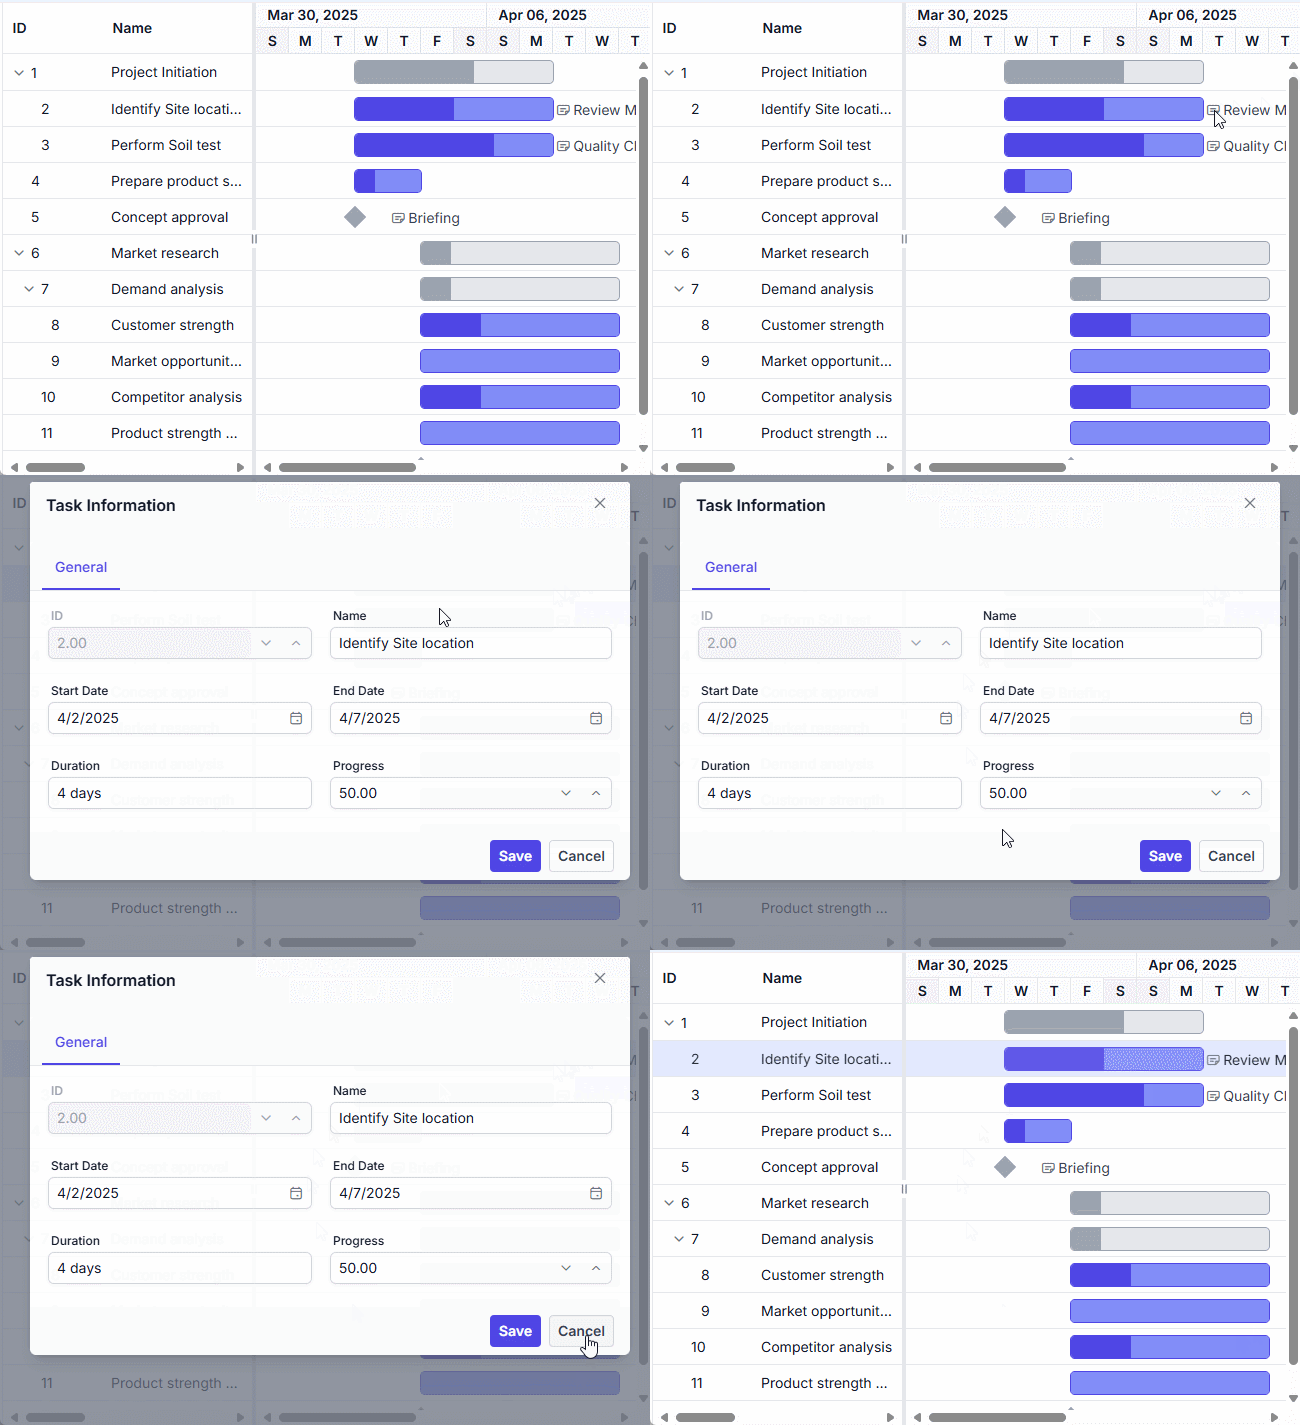
Event handler considerations: The click event handler locates the parent task row using DOM traversal methods, extracts the task information from the current view data, and calls the openEditDialog method with the appropriate task ID to display the edit dialog for the selected task.
Apply custom styling for indicator span
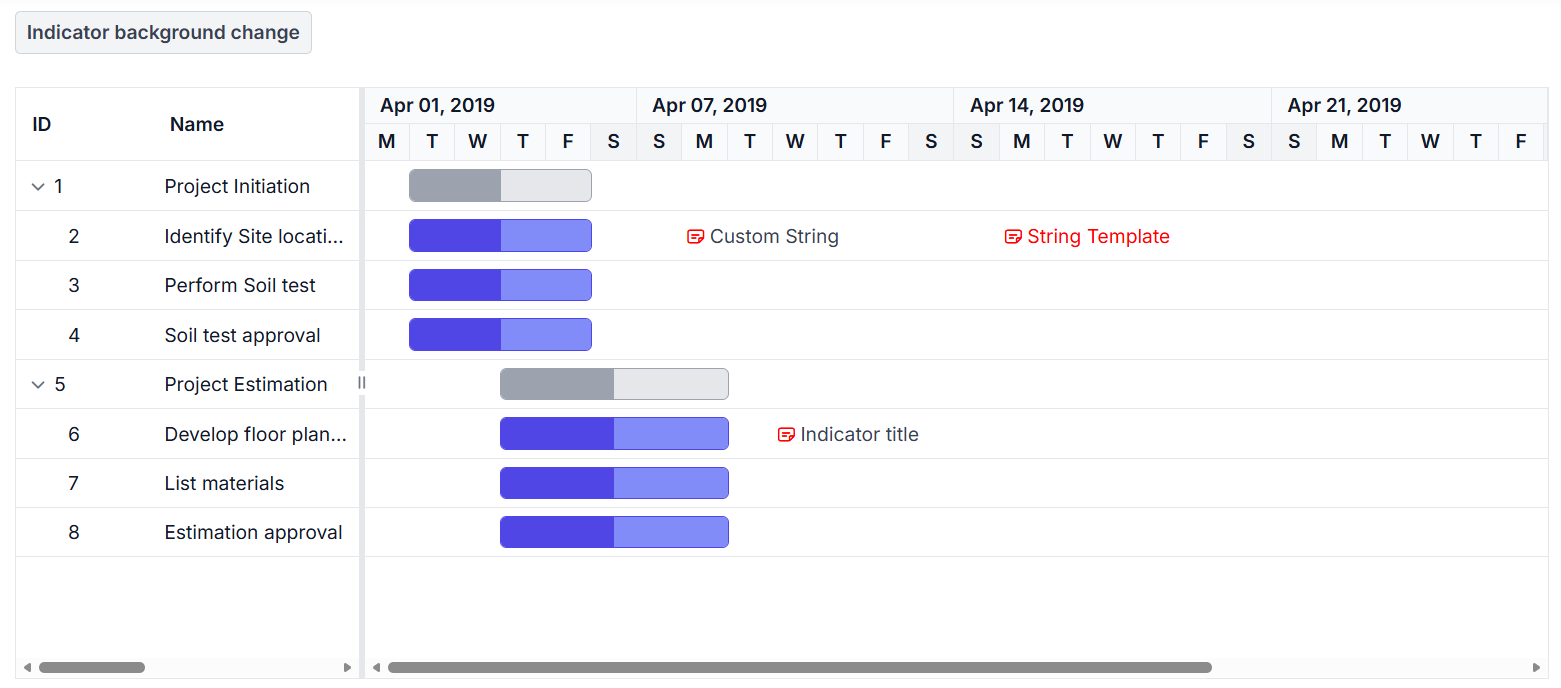
You can programmatically modify the styling of the indicator by targeting the .e-indicator-span class.
@page
@model IndexModel

<button id='btn' class="e-btn" onclick="indicator()">Indicator background change</button>
<br><br>
<ejs-gantt id='Gantt' height="430px" dataSource="@Model.GanttDataSourceCollection">
    <e-gantt-taskfields id="TaskId" name="TaskName" startDate="StartDate" duration="Duration" progress="Progress" parentId="ParentId" indicators="Indicators">
    </e-gantt-taskfields>
</ejs-gantt>
<script>
    function indicator() {
        var gantt = document.getElementById("Gantt").ej2_instances[0];
        var nodes = gantt.element.querySelectorAll('.e-indicator-span');
        nodes.forEach(function (box) {
            var child = box.children[0];
            child.style.color = 'red';
        });
    }
</script>
using Microsoft.AspNetCore.Mvc.RazorPages;
namespace CoreSamples.Pages
{
public class IndexModel : PageModel
{
public List<GanttDataSource> GanttDataSourceCollection { get; set; }
public void OnGet()
{
GanttDataSourceCollection = GetTaskCollection();
}
private List<GanttDataSource> GetTaskCollection()
{
return new List<GanttDataSource>()
{
new GanttDataSource
{
TaskId = 1,
TaskName = "Project Initiation",
StartDate = new DateTime(2019, 4, 2),
EndDate = new DateTime(2019, 4, 21)
},
new GanttDataSource
{
TaskId = 2,
TaskName = "Identify Site location",
StartDate = new DateTime(2019, 4, 2),
Duration = 4,
Progress = 50,
ParentId = 1,
Indicators = new List<IndicatorsModel>()
{
new IndicatorsModel { date = "04/08/2019", iconClass = "e-btn-icon e-notes-info e-icons e-icon-left e-gantt e-notes-info::before", name = "Custom String", tooltip = "Follow up" },
new IndicatorsModel { date = "04/15/2019", iconClass = "e-btn-icon e-notes-info e-icons e-icon-left e-gantt e-notes-info::before", name = "<span style='color:red'>String Template</span>" }
}
},
new GanttDataSource
{
TaskId = 3,
TaskName = "Perform Soil test",
StartDate = new DateTime(2019, 4, 2),
Duration = 4,
Progress = 50,
ParentId = 1
},
new GanttDataSource
{
TaskId = 4,
TaskName = "Soil test approval",
StartDate = new DateTime(2019, 4, 2),
Duration = 4,
Progress = 50,
ParentId = 1
},
new GanttDataSource
{
TaskId = 5,
TaskName = "Project Estimation",
StartDate = new DateTime(2019, 4, 2),
EndDate = new DateTime(2019, 4, 21)
},
new GanttDataSource
{
TaskId = 6,
TaskName = "Develop floor plan for estimation",
StartDate = new DateTime(2019, 4, 4),
Duration = 3,
Progress = 50,
ParentId = 5,
Indicators = new List<IndicatorsModel>()
{
new IndicatorsModel { date = "04/10/2019", iconClass = "e-btn-icon e-notes-info e-icons e-icon-left e-gantt e-notes-info::before", name = "Indicator title", tooltip = "tooltip" }
}
},
new GanttDataSource
{
TaskId = 7,
TaskName = "List materials",
StartDate = new DateTime(2019, 4, 4),
Duration = 3,
Progress = 50,
ParentId = 5
},
new GanttDataSource
{
TaskId = 8,
TaskName = "Estimation approval",
StartDate = new DateTime(2019, 4, 4),
Duration = 3,
Progress = 50,
ParentId = 5
}
};
}
}
public class GanttDataSource
{
public int TaskId { get; set; }
public string TaskName { get; set; }
public DateTime? StartDate { get; set; }
public DateTime? EndDate { get; set; }
public int? Duration { get; set; }
public int? Progress { get; set; }
public int? ParentId { get; set; }
public List<IndicatorsModel> Indicators { get; set; }
}
public class IndicatorsModel
{
public string date { get; set; }
public string iconClass { get; set; }
public string name { get; set; }
public string tooltip { get; set; }
}
}
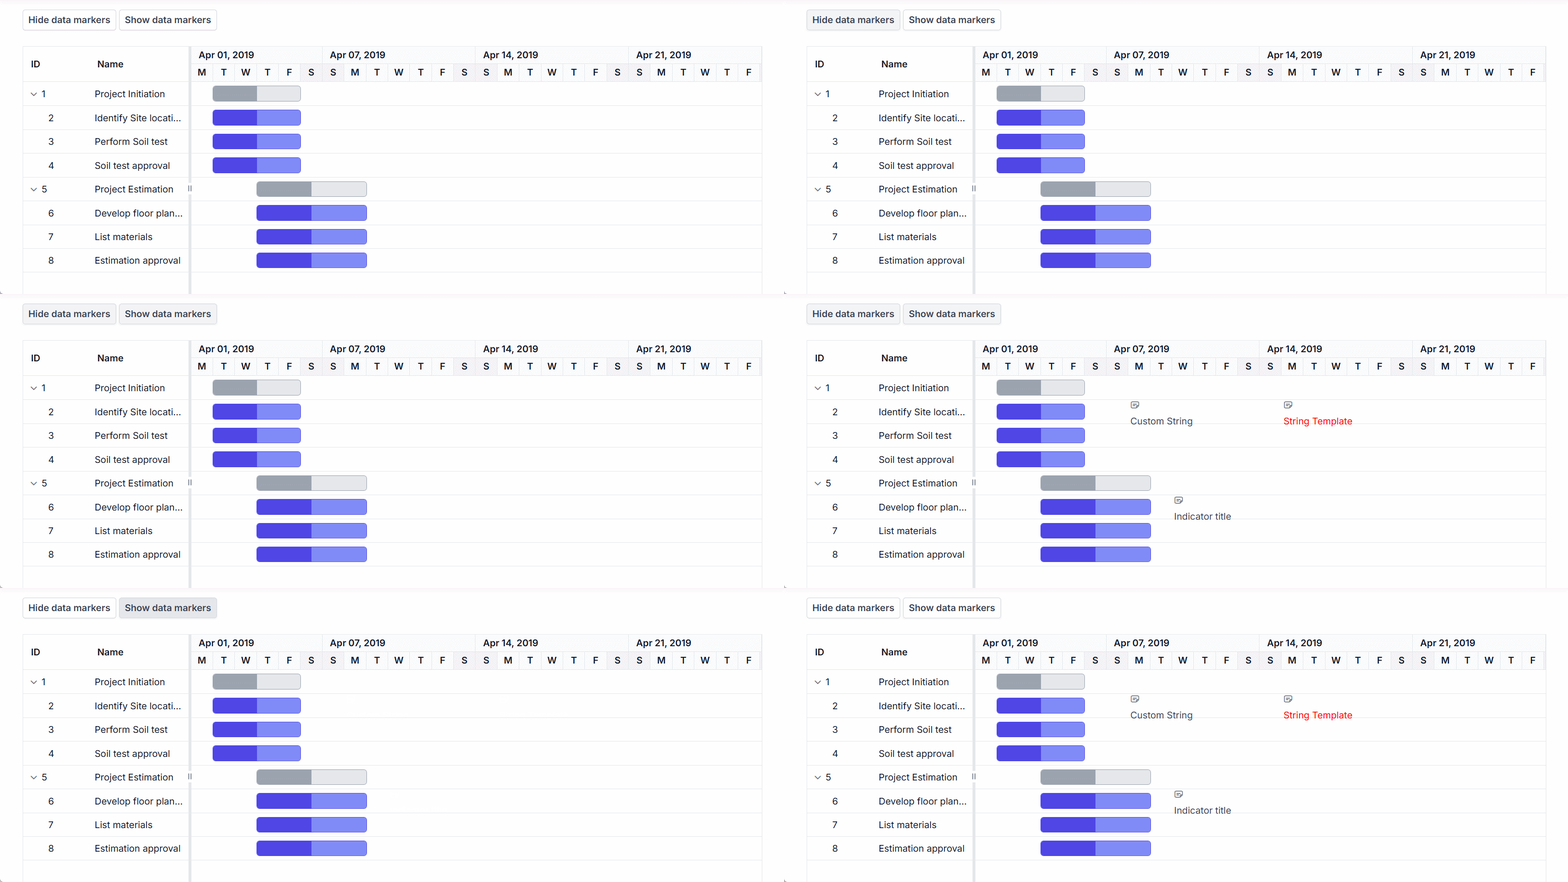
Hide data markers programmatically
You can hide data markers programmatically by targeting the .e-indicator-span class of the rendered marker elements and setting their display style. The following example shows how to hide and show all data markers using external buttons:
@page
@model IndexModel

<button id='hideBtn' class="e-btn" onclick="hideIndicators()">Hide data markers</button>
<button id='showBtn' class="e-btn" onclick="showIndicators()">Show data markers</button>
<br><br>
<ejs-gantt id='Gantt' height="430px" dataSource="@Model.GanttDataSourceCollection">
    <e-gantt-taskfields id="TaskId" name="TaskName" startDate="StartDate" duration="Duration" progress="Progress" parentId="ParentId" indicators="Indicators">
    </e-gantt-taskfields>
</ejs-gantt>
<script>
    function hideIndicators() {
        var gantt = document.getElementById("Gantt").ej2_instances[0];
        var nodes = gantt.element.querySelectorAll('.e-indicator-span');
        nodes.forEach(function (box) {
            box.style.display = 'none';
        });
    }

    function showIndicators() {
        var gantt = document.getElementById("Gantt").ej2_instances[0];
        var nodes = gantt.element.querySelectorAll('.e-indicator-span');
        nodes.forEach(function (box) {
            box.style.display = '';
        });
    }
</script>
using Microsoft.AspNetCore.Mvc.RazorPages;
namespace CoreSamples.Pages
{
public class IndexModel : PageModel
{
public List<GanttDataSource> GanttDataSourceCollection { get; set; }
public void OnGet()
{
GanttDataSourceCollection = GetTaskCollection();
}
private List<GanttDataSource> GetTaskCollection()
{
return new List<GanttDataSource>()
{
new GanttDataSource
{
TaskId = 1,
TaskName = "Project Initiation",
StartDate = new DateTime(2019, 4, 2),
EndDate = new DateTime(2019, 4, 21)
},
new GanttDataSource
{
TaskId = 2,
TaskName = "Identify Site location",
StartDate = new DateTime(2019, 4, 2),
Duration = 4,
Progress = 50,
ParentId = 1,
Indicators = new List<IndicatorsModel>()
{
new IndicatorsModel { date = "04/08/2019", iconClass = "e-btn-icon e-notes-info e-icons", name = "Review Meeting", tooltip = "Review and approve project requirements" }
}
},
new GanttDataSource
{
TaskId = 3,
TaskName = "Perform Soil test",
StartDate = new DateTime(2019, 4, 2),
Duration = 4,
Progress = 50,
ParentId = 1
},
new GanttDataSource
{
TaskId = 4,
TaskName = "Soil test approval",
StartDate = new DateTime(2019, 4, 2),
Duration = 4,
Progress = 50,
ParentId = 1
},
new GanttDataSource
{
TaskId = 5,
TaskName = "Project Estimation",
StartDate = new DateTime(2019, 4, 2),
EndDate = new DateTime(2019, 4, 21)
},
new GanttDataSource
{
TaskId = 6,
TaskName = "Develop floor plan for estimation",
StartDate = new DateTime(2019, 4, 4),
Duration = 3,
Progress = 50,
ParentId = 5,
Indicators = new List<IndicatorsModel>()
{
new IndicatorsModel { date = "04/10/2019", iconClass = "e-btn-icon e-notes-info e-icons", name = "Quality Check", tooltip = "Soil quality inspection checkpoint" }
}
},
new GanttDataSource
{
TaskId = 7,
TaskName = "List materials",
StartDate = new DateTime(2019, 4, 4),
Duration = 3,
Progress = 50,
ParentId = 5
},
new GanttDataSource
{
TaskId = 8,
TaskName = "Estimation approval",
StartDate = new DateTime(2019, 4, 4),
Duration = 3,
Progress = 50,
ParentId = 5
}
};
}
}
public class GanttDataSource
{
public int TaskId { get; set; }
public string TaskName { get; set; }
public DateTime? StartDate { get; set; }
public DateTime? EndDate { get; set; }
public int? Duration { get; set; }
public int? Progress { get; set; }
public int? ParentId { get; set; }
public List<IndicatorsModel> Indicators { get; set; }
}
public class IndicatorsModel
{
public string date { get; set; }
public string iconClass { get; set; }
public string name { get; set; }
public string tooltip { get; set; }
}
}