Charts in Word document in .NET Word
13 Aug 202624 minutes to read
A Chart is a graphical representation of data where the data is represented as symbols such as bars, lines, etc. Charts can represent numerical data, functions, or some kinds of qualitative structures. DocIO supports the following chart types:
- Bar chart
- Line chart
- Pie chart
- Area chart
- Column chart
- Scatter chart
- Surface chart
- Stock chart
- Radar chart
For the complete list of supported chart types, refer to the Supported Chart Types section.
DocIO supports chart only in DOCX and WordML format documents.
Creating a simple Chart from scratch
A new chart can be created or an existing chart can be modified by using the WChart instance. The following code example illustrates how to create a new chart.
Refer to the appropriate tabs in the code snippets section: C# [Cross-platform] for ASP.NET Core, Blazor, Xamarin, UWP, .NET MAUI, and WinUI; C# [Windows-specific] for WinForms and WPF; VB.NET [Windows-specific] for VB.NET applications.
//Creates a new instance of WordDocument (Empty Word Document)
using (WordDocument document = new WordDocument())
{
    //Adds section to the document
    IWSection sec = document.AddSection();
    //Adds paragraph to the section
    IWParagraph paragraph = sec.AddParagraph();
    //Creates and Appends chart to the paragraph
    WChart chart = paragraph.AppendChart(446, 270);
    //Sets chart type
    chart.ChartType = OfficeChartType.Pie;
    //Sets chart title
    chart.ChartTitle = "Best Selling Products";
    chart.ChartTitleArea.FontName = "Calibri";
    chart.ChartTitleArea.Size = 14;
    //Sets data for chart
    chart.ChartData.SetValue(1, 1, "");
    chart.ChartData.SetValue(1, 2, "Sales");
    chart.ChartData.SetValue(2, 1, "Phyllis Lapin");
    chart.ChartData.SetValue(2, 2, 141.396);
    chart.ChartData.SetValue(3, 1, "Stanley Hudson");
    chart.ChartData.SetValue(3, 2, 80.368);
    chart.ChartData.SetValue(4, 1, "Bernard Shah");
    chart.ChartData.SetValue(4, 2, 71.155);
    chart.ChartData.SetValue(5, 1, "Patricia Lincoln");
    chart.ChartData.SetValue(5, 2, 47.234);
    chart.ChartData.SetValue(6, 1, "Camembert Pierrot");
    chart.ChartData.SetValue(6, 2, 46.825);
    chart.ChartData.SetValue(7, 1, "Thomas Hardy");
    chart.ChartData.SetValue(7, 2, 42.593);
    chart.ChartData.SetValue(8, 1, "Hanna Moos");
    chart.ChartData.SetValue(8, 2, 41.819);
    chart.ChartData.SetValue(9, 1, "Alice Mutton");
    chart.ChartData.SetValue(9, 2, 32.698);
    chart.ChartData.SetValue(10, 1, "Christina Berglund");
    chart.ChartData.SetValue(10, 2, 29.171);
    chart.ChartData.SetValue(11, 1, "Elizabeth Lincoln");
    chart.ChartData.SetValue(11, 2, 25.696);
    //Creates a new chart series with the name "Sales"
    IOfficeChartSerie pieSeries = chart.Series.Add("Sales");
    pieSeries.Values = chart.ChartData[2, 2, 11, 2];
    //Sets data label
    pieSeries.DataPoints.DefaultDataPoint.DataLabels.IsValue = true;
    pieSeries.DataPoints.DefaultDataPoint.DataLabels.Position = OfficeDataLabelPosition.Outside;
    //Sets background color
    chart.ChartArea.Fill.ForeColor = Syncfusion.Drawing.Color.FromArgb(242, 242, 242);
    chart.PlotArea.Fill.ForeColor = Syncfusion.Drawing.Color.FromArgb(242, 242, 242);
    chart.ChartArea.Border.LinePattern = OfficeChartLinePattern.None;
    //Sets category labels
    chart.PrimaryCategoryAxis.CategoryLabels = chart.ChartData[2, 1, 11, 1];
    //Saves the Word document to MemoryStream
    using (MemoryStream stream = new MemoryStream())
    {
        document.Save(stream, FormatType.Docx);
    }
}
//Creates a new Word document
using (WordDocument document = new WordDocument())
{
//Adds section to the document
IWSection sec = document.AddSection();
//Adds paragraph to the section
IWParagraph paragraph = sec.AddParagraph();
//Creates and Appends chart to the paragraph
WChart chart = paragraph.AppendChart(446, 270);
//Sets chart type
chart.ChartType = OfficeChartType.Pie;
//Sets chart title
chart.ChartTitle = "Best Selling Products";
chart.ChartTitleArea.FontName = "Calibri";
chart.ChartTitleArea.Size = 14;
//Sets data for chart
chart.ChartData.SetValue(1, 1, "");
chart.ChartData.SetValue(1, 2, "Sales");
chart.ChartData.SetValue(2, 1, "Phyllis Lapin");
chart.ChartData.SetValue(2, 2, 141.396);
chart.ChartData.SetValue(3, 1, "Stanley Hudson");
chart.ChartData.SetValue(3, 2, 80.368);
chart.ChartData.SetValue(4, 1, "Bernard Shah");
chart.ChartData.SetValue(4, 2, 71.155);
chart.ChartData.SetValue(5, 1, "Patricia Lincoln");
chart.ChartData.SetValue(5, 2, 47.234);
chart.ChartData.SetValue(6, 1, "Camembert Pierrot");
chart.ChartData.SetValue(6, 2, 46.825);
chart.ChartData.SetValue(7, 1, "Thomas Hardy");
chart.ChartData.SetValue(7, 2, 42.593);
chart.ChartData.SetValue(8, 1, "Hanna Moos");
chart.ChartData.SetValue(8, 2, 41.819);
chart.ChartData.SetValue(9, 1, "Alice Mutton");
chart.ChartData.SetValue(9, 2, 32.698);
chart.ChartData.SetValue(10, 1, "Christina Berglund");
chart.ChartData.SetValue(10, 2, 29.171);
chart.ChartData.SetValue(11, 1, "Elizabeth Lincoln");
chart.ChartData.SetValue(11, 2, 25.696);
//Creates a new chart series with the name "Sales"
IOfficeChartSerie pieSeries = chart.Series.Add("Sales");
pieSeries.Values = chart.ChartData[2, 2, 11, 2];
//Sets data label
pieSeries.DataPoints.DefaultDataPoint.DataLabels.IsValue = true;
pieSeries.DataPoints.DefaultDataPoint.DataLabels.Position = OfficeDataLabelPosition.Outside;
//Sets background color
chart.ChartArea.Fill.ForeColor = Color.FromArgb(242, 242, 242);
chart.PlotArea.Fill.ForeColor = Color.FromArgb(242, 242, 242);
chart.ChartArea.Border.LinePattern = OfficeChartLinePattern.None;
//Sets category labels
chart.PrimaryCategoryAxis.CategoryLabels = chart.ChartData[2, 1, 11, 1];
//Saves the document
document.Save("Sample.docx", FormatType.Docx);
}'Creates a new Word document
Using document As New WordDocument()
'Adds section to the document
Dim sec As IWSection = document.AddSection()
'Adds paragraph to the section
Dim paragraph As IWParagraph = sec.AddParagraph()
'Creates and Appends chart to the paragraph
Dim chart As WChart = paragraph.AppendChart(446, 270)
'Sets chart type
chart.ChartType = OfficeChartType.Pie
'Sets chart title
chart.ChartTitle = "Best Selling Products"
chart.ChartTitleArea.FontName = "Calibri"
chart.ChartTitleArea.Size = 14
'Sets data for chart
chart.ChartData.SetValue(1, 1, "")
chart.ChartData.SetValue(1, 2, "Sales")
chart.ChartData.SetValue(2, 1, "Phyllis Lapin")
chart.ChartData.SetValue(2, 2, 141.396)
chart.ChartData.SetValue(3, 1, "Stanley Hudson")
chart.ChartData.SetValue(3, 2, 80.368)
chart.ChartData.SetValue(4, 1, "Bernard Shah")
chart.ChartData.SetValue(4, 2, 71.155)
chart.ChartData.SetValue(5, 1, "Patricia Lincoln")
chart.ChartData.SetValue(5, 2, 47.234)
chart.ChartData.SetValue(6, 1, "Camembert Pierrot")
chart.ChartData.SetValue(6, 2, 46.825)
chart.ChartData.SetValue(7, 1, "Thomas Hardy")
chart.ChartData.SetValue(7, 2, 42.593)
chart.ChartData.SetValue(8, 1, "Hanna Moos")
chart.ChartData.SetValue(8, 2, 41.819)
chart.ChartData.SetValue(9, 1, "Alice Mutton")
chart.ChartData.SetValue(9, 2, 32.698)
chart.ChartData.SetValue(10, 1, "Christina Berglund")
chart.ChartData.SetValue(10, 2, 29.171)
chart.ChartData.SetValue(11, 1, "Elizabeth Lincoln")
chart.ChartData.SetValue(11, 2, 25.696)
'Creates a new chart series with the name "Sales"
Dim pieSeries As IOfficeChartSerie = chart.Series.Add("Sales")
pieSeries.Values = chart.ChartData(2, 2, 11, 2)
'Sets data label
pieSeries.DataPoints.DefaultDataPoint.DataLabels.IsValue = True
pieSeries.DataPoints.DefaultDataPoint.DataLabels.Position = OfficeDataLabelPosition.Outside
'Sets background color
chart.ChartArea.Fill.ForeColor = Color.FromArgb(242, 242, 242)
chart.PlotArea.Fill.ForeColor = Color.FromArgb(242, 242, 242)
chart.ChartArea.Border.LinePattern = OfficeChartLinePattern.None
'Sets category labels
chart.PrimaryCategoryAxis.CategoryLabels = chart.ChartData(2, 1, 11, 1)
'Saves the document
document.Save("Sample.docx", FormatType.Docx)
End UsingYou can download a complete working sample from GitHub.
Creating a Chart from Excel file
The chart data can be set through the object array or can be loaded from an Excel stream. The specific range of the data from the Excel file can be used to set chart data.
The following code example illustrates the chart data loaded from the Excel file.
//Creates a new instance of WordDocument (Empty Word Document)
using (WordDocument document = new WordDocument())
{
    //Adds section to the document
    IWSection sec = document.AddSection();
    //Adds paragraph to the section
    IWParagraph paragraph = sec.AddParagraph();
    //Loads the excel file as stream
    using (Stream excelStream = File.OpenRead("Excel_Template.xlsx"))
    {
        //Creates and Appends chart to the paragraph with excel stream as parameter
        WChart chart = paragraph.AppendChart(excelStream, 1, "B2:C6", 470, 300);
        //Sets chart type and title
        chart.ChartType = OfficeChartType.Column_Clustered;
        chart.ChartTitle = "Purchase Details";
        chart.ChartTitleArea.FontName = "Calibri";
        chart.ChartTitleArea.Size = 14;
        chart.ChartArea.Border.LinePattern = OfficeChartLinePattern.None;
        //Sets name to chart series
        chart.Series[0].Name = "Sum of Purchases";
        chart.Series[1].Name = "Sum of Future Expenses";
        chart.PrimaryCategoryAxis.Title = "Products";
        chart.PrimaryValueAxis.Title = "In Dollars";
        //Sets position of legend
        chart.Legend.Position = OfficeLegendPosition.Bottom;
    }
    //Saves the Word document to  MemoryStream
    using (MemoryStream stream = new MemoryStream())
    {
        document.Save(stream, FormatType.Docx);
    }
}
//Creates a new Word document
using (WordDocument document = new WordDocument())
{
//Adds section to the document
IWSection sec = document.AddSection();
//Adds paragraph to the section
IWParagraph paragraph = sec.AddParagraph();
//Loads the excel file as stream
using (Stream excelStream = File.OpenRead("Excel_Template.xlsx"))
{
//Creates and Appends chart to the paragraph with excel stream as parameter
WChart chart = paragraph.AppendChart(excelStream, 1, "B2:C6", 470, 300);
//Sets chart type and title
chart.ChartType = OfficeChartType.Column_Clustered;
chart.ChartTitle = "Purchase Details";
chart.ChartTitleArea.FontName = "Calibri";
chart.ChartTitleArea.Size = 14;
chart.ChartArea.Border.LinePattern = OfficeChartLinePattern.None;
//Sets name to chart series
chart.Series[0].Name = "Sum of Purchases";
chart.Series[1].Name = "Sum of Future Expenses";
chart.PrimaryCategoryAxis.Title = "Products";
chart.PrimaryValueAxis.Title = "In Dollars";
//Sets position of legend
chart.Legend.Position = OfficeLegendPosition.Bottom;
}
//Saves the document
document.Save("Sample.docx", FormatType.Docx);
}'Creates a new Word document
Using document As New WordDocument()
'Adds section to the document
Dim sec As IWSection = document.AddSection()
'Adds paragraph to the section
Dim paragraph As IWParagraph = sec.AddParagraph()
'Loads the excel file as stream
Using excelStream As Stream = File.OpenRead("Excel_Template.xlsx")
'Creates and Appends chart to the paragraph with excel stream as parameter
Dim chart As WChart = paragraph.AppendChart(excelStream, 1, "B2:C6", 470, 300)
'Sets chart type and title
chart.ChartType = OfficeChartType.Column_Clustered
chart.ChartTitle = "Purchase Details"
chart.ChartTitleArea.FontName = "Calibri"
chart.ChartTitleArea.Size = 14
chart.ChartArea.Border.LinePattern = OfficeChartLinePattern.None
'Sets name to chart series
chart.Series(0).Name = "Sum of Purchases"
chart.Series(1).Name = "Sum of Future Expenses"
chart.PrimaryCategoryAxis.Title = "Products"
chart.PrimaryValueAxis.Title = "In Dollars"
'Sets position of legend
chart.Legend.Position = OfficeLegendPosition.Bottom
End Using
'Saves the document
document.Save("Sample.docx", FormatType.Docx)
End UsingYou can download a complete working sample from GitHub.
Creating Custom Charts
A chart is composed of data series. Each data series is represented by a series object. When creating a custom chart, you can specify different series types for each data series.
The following code example illustrates how to create custom charts.
//Creates a new instance of WordDocument (Empty Word Document)
using (WordDocument document = new WordDocument())
{
    //Adds section to the document
    IWSection sec = document.AddSection();
    //Adds paragraph to the section
    IWParagraph paragraph = sec.AddParagraph();
    //Inputs data for chart
    object[][] data = new object[6][];
    for (int i = 0; i < 6; i++)
        data[i] = new object[3];
    data[0][0] = "";
    data[1][0] = "Camembert Pierrot";
    data[2][0] = "Alice Mutton";
    data[3][0] = "Roasted Tigers";
    data[4][0] = "Orange Shake";
    data[5][0] = "Dried Apples";
    data[0][1] = "Sum of Purchases";
    data[1][1] = 286;
    data[2][1] = 680;
    data[3][1] = 288;
    data[4][1] = 200;
    data[5][1] = 731;
    data[0][2] = "Sum of Future Expenses";
    data[1][2] = 1300;
    data[2][2] = 700;
    data[3][2] = 1280;
    data[4][2] = 1200;
    data[5][2] = 2660;
    //Creates and Appends chart to the paragraph
    WChart chart = paragraph.AppendChart(data, 470, 300);
    //Sets chart type and title
    chart.ChartTitle = "Purchase Details";
    chart.ChartTitleArea.FontName = "Calibri";
    chart.ChartTitleArea.Size = 14;
    chart.ChartArea.Border.LinePattern = OfficeChartLinePattern.None;
    //Sets series type
    chart.Series[0].SerieType = OfficeChartType.Line_Markers;
    chart.Series[1].SerieType = OfficeChartType.Bar_Clustered;
    chart.PrimaryCategoryAxis.Title = "Products";
    chart.PrimaryValueAxis.Title = "In Dollars";
    //Sets position of legend
    chart.Legend.Position = OfficeLegendPosition.Bottom;
    //Saves the Word document to  MemoryStream
    using (MemoryStream stream = new MemoryStream())
    {
        document.Save(stream, FormatType.Docx);
    }
}
//Creates a new Word document
using (WordDocument document = new WordDocument())
{
//Adds section to the document
IWSection sec = document.AddSection();
//Adds paragraph to the section
IWParagraph paragraph = sec.AddParagraph();
//Inputs data for chart
object[][] data = new object[6][];
for (int i = 0; i < 6; i++)
data[i] = new object[3];
data[0][0] = "";
data[1][0] = "Camembert Pierrot";
data[2][0] = "Alice Mutton";
data[3][0] = "Roasted Tigers";
data[4][0] = "Orange Shake";
data[5][0] = "Dried Apples";
data[0][1] = "Sum of Purchases";
data[1][1] = 286;
data[2][1] = 680;
data[3][1] = 288;
data[4][1] = 200;
data[5][1] = 731;
data[0][2] = "Sum of Future Expenses";
data[1][2] = 1300;
data[2][2] = 700;
data[3][2] = 1280;
data[4][2] = 1200;
data[5][2] = 2660;
//Creates and Appends chart to the paragraph
WChart chart = paragraph.AppendChart(data, 470, 300);
//Sets chart type and title
chart.ChartTitle = "Purchase Details";
chart.ChartTitleArea.FontName = "Calibri";
chart.ChartTitleArea.Size = 14;
chart.ChartArea.Border.LinePattern = OfficeChartLinePattern.None;
//Sets series type
chart.Series[0].SerieType = OfficeChartType.Line_Markers;
chart.Series[1].SerieType = OfficeChartType.Bar_Clustered;
chart.PrimaryCategoryAxis.Title = "Products";
chart.PrimaryValueAxis.Title = "In Dollars";
//Sets position of legend
chart.Legend.Position = OfficeLegendPosition.Bottom;
//Saves the document
document.Save("Sample.docx", FormatType.Docx);
}'Creates a new Word document
Using document As New WordDocument()
'Adds section to the document
Dim sec As IWSection = document.AddSection()
'Adds paragraph to the section
Dim paragraph As IWParagraph = sec.AddParagraph()
'Inputs data for chart
Dim data As Object()() = New Object(5)() {}
For i As Integer = 0 To 5
data(i) = New Object(2) {}
Next
data(0)(0) = ""
data(1)(0) = "Camembert Pierrot"
data(2)(0) = "Alice Mutton"
data(3)(0) = "Roasted Tigers"
data(4)(0) = "Orange Shake"
data(5)(0) = "Dried Apples"
data(0)(1) = "Sum of Purchases"
data(1)(1) = 286
data(2)(1) = 680
data(3)(1) = 288
data(4)(1) = 200
data(5)(1) = 731
data(0)(2) = "Sum of Future Expenses"
data(1)(2) = 1300
data(2)(2) = 700
data(3)(2) = 1280
data(4)(2) = 1200
data(5)(2) = 2660
'Creates and Appends chart to the paragraph
Dim chart As WChart = paragraph.AppendChart(data, 470, 300)
'Sets chart type and title
chart.ChartTitle = "Purchase Details"
chart.ChartTitleArea.FontName = "Calibri"
chart.ChartTitleArea.Size = 14
chart.ChartArea.Border.LinePattern = OfficeChartLinePattern.None
'Sets series type
chart.Series(0).SerieType = OfficeChartType.Line_Markers
chart.Series(1).SerieType = OfficeChartType.Bar_Clustered
chart.PrimaryCategoryAxis.Title = "Products"
chart.PrimaryValueAxis.Title = "In Dollars"
'Sets position of legend
chart.Legend.Position = OfficeLegendPosition.Bottom
'Saves the document
document.Save("Sample.docx", FormatType.Docx)
End UsingYou can download a complete working sample from GitHub.
Creating a Chart from a Database
Create a chart in a Word document using the .NET Word Library by utilizing the values retrieved from the database.
The following code example illustrates how to create a chart in a Word document from a database.
//Create a new instance of WordDocument.
using (WordDocument document = new WordDocument())
{
    document.EnsureMinimal();
    //Get the data table.
    DataTable dataTable = GetDataTable();
    //Create and append the chart to the paragraph.
    WChart chart = document.LastParagraph.AppendChart(446, 270);
    chart.ChartType = OfficeChartType.Pie;
    //Assign the data.
    AddChartData(chart, dataTable);
    //Set a chart title.
    chart.ChartTitle = "Best Selling Products";
    IOfficeChartSerie pieSeries = chart.Series.Add("Sales");
    pieSeries.Values = chart.ChartData[2, 2, 11, 2];
    //Set the data label.
    pieSeries.DataPoints.DefaultDataPoint.DataLabels.IsValue = true;
    pieSeries.DataPoints.DefaultDataPoint.DataLabels.Position = OfficeDataLabelPosition.Outside;
    //Set the category labels.
    chart.PrimaryCategoryAxis.CategoryLabels = chart.ChartData[2, 1, 11, 1];
    //Set the legend.
    chart.HasLegend = true;
    //Save a Word document.
    using (MemoryStream stream = new MemoryStream())
    {
        document.Save(stream, FormatType.Docx);
    }
}

// Get the data to create a pie chart.
private static DataTable GetDataTable()
{
    string path = Path.GetFullPath(@"../../Data/DataBase.mdb");
    //Create a new instance of OleDbConnection.
    using (OleDbConnection connection = new OleDbConnection())
    {
        //Set the string to open a Database.
        connection.ConnectionString = "Provider=Microsoft.JET.OLEDB.4.0;Password=\"\";User ID=Admin;Data Source=" + path;
        //Open the Database connection.
        connection.Open();
        //Get all the data from the Database.
        OleDbCommand query = new OleDbCommand("select * from Products", connection);
        //Create a new instance of OleDbDataAdapter.
        OleDbDataAdapter adapter = new OleDbDataAdapter(query);
        //Create a new instance of DataSet.
        DataSet dataSet = new DataSet();
        //Add rows in the Dataset.
        adapter.Fill(dataSet);
        //Create a DataTable from the Dataset.
        DataTable table = dataSet.Tables[0];
        table.TableName = "Products";
        return table;
    }
}

// Set the value for the chart.
private static void AddChartData(WChart chart, DataTable dataTable)
{
    //Set the value for the chart data.
    chart.ChartData.SetValue(1, 1, "Names");
    chart.ChartData.SetValue(1, 2, "Product");

    int rowIndex = 2;
    int colIndex = 1;
    //Get the value from the DataTable and set the value for the chart data
    foreach (DataRow row in dataTable.Rows)
    {
        foreach (object val in row.ItemArray)
        {
            string value = val.ToString();
            chart.ChartData.SetValue(rowIndex, colIndex, value);
            colIndex++;
            if (colIndex == 3)
                break;
        }
        colIndex = 1;
        rowIndex++;
    }
}
//Create a new instance of WordDocument.
using (WordDocument document = new WordDocument())
{
document.EnsureMinimal();
//Get the data table.
DataTable dataTable = GetDataTable();
//Create and append the chart to the paragraph.
WChart chart = document.LastParagraph.AppendChart(446, 270);
chart.ChartType = OfficeChartType.Pie;
//Assign the data.
AddChartData(chart, dataTable);
//Set a chart title.
chart.ChartTitle = "Best Selling Products";
IOfficeChartSerie pieSeries = chart.Series.Add("Sales");
pieSeries.Values = chart.ChartData[2, 2, 11, 2];
//Set the data label.
pieSeries.DataPoints.DefaultDataPoint.DataLabels.IsValue = true;
pieSeries.DataPoints.DefaultDataPoint.DataLabels.Position = OfficeDataLabelPosition.Outside;
//Set the category labels.
chart.PrimaryCategoryAxis.CategoryLabels = chart.ChartData[2, 1, 11, 1];
//Set the legend.
chart.HasLegend = true;
//Save a Word document.
document.Save(Path.GetFullPath(@"../../Result.docx"));
}
// Get the data to create a pie chart.
private static DataTable GetDataTable()
{
string path = Path.GetFullPath(@"../../Data/DataBase.mdb");
//Create a new instance of OleDbConnection.
using (OleDbConnection connection = new OleDbConnection())
{
//Set the string to open a Database.
connection.ConnectionString = "Provider=Microsoft.JET.OLEDB.4.0;Password=\"\";User ID=Admin;Data Source=" + path;
//Open the Database connection.
connection.Open();
//Get all the data from the Database.
OleDbCommand query = new OleDbCommand("select * from Products", connection);
//Create a new instance of OleDbDataAdapter.
OleDbDataAdapter adapter = new OleDbDataAdapter(query);
//Create a new instance of DataSet.
DataSet dataSet = new DataSet();
//Add rows in the Dataset.
adapter.Fill(dataSet);
//Create a DataTable from the Dataset.
DataTable table = dataSet.Tables[0];
table.TableName = "Products";
return table;
}
}
// Set the value for the chart.
private static void AddChartData(WChart chart, DataTable dataTable)
{
//Set the value for the chart data.
chart.ChartData.SetValue(1, 1, "Names");
chart.ChartData.SetValue(1, 2, "Product");
int rowIndex = 2;
int colIndex = 1;
//Get the value from the DataTable and set the value for the chart data
foreach (DataRow row in dataTable.Rows)
{
foreach (object val in row.ItemArray)
{
string value = val.ToString();
chart.ChartData.SetValue(rowIndex, colIndex, value);
colIndex++;
if (colIndex == 3)
break;
}
colIndex = 1;
rowIndex++;
}
}' Create a new instance of WordDocument.
Using document As New WordDocument()
document.EnsureMinimal()
' Get the data table.
Dim dataTable As DataTable = GetDataTable()
' Create and append the chart to the paragraph.
Dim chart As WChart = document.LastParagraph.AppendChart(446, 270)
chart.ChartType = OfficeChartType.Pie
' Assign the data.
AddChartData(chart, dataTable)
' Set a chart title.
chart.ChartTitle = "Best Selling Products"
Dim pieSeries As IOfficeChartSerie = chart.Series.Add("Sales")
pieSeries.Values = chart.ChartData(2, 2, 11, 2)
' Set the data label.
pieSeries.DataPoints.DefaultDataPoint.DataLabels.IsValue = True
pieSeries.DataPoints.DefaultDataPoint.DataLabels.Position = OfficeDataLabelPosition.Outside
' Set the category labels.
chart.PrimaryCategoryAxis.CategoryLabels = chart.ChartData(2, 1, 11, 1)
' Set the legend.
chart.HasLegend = True
' Save a Word document.
document.Save(Path.GetFullPath("..\..\Result.docx"))
End Using
' Get the data to create a pie chart.
Private Function GetDataTable() As DataTable
Dim path As String = System.IO.Path.GetFullPath("..\..\Data\DataBase.mdb")
' Create a new instance of OleDbConnection.
Using connection As New OleDbConnection()
' Set the string to open a Database.
connection.ConnectionString = "Provider=Microsoft.JET.OLEDB.4.0;Password="""";User ID=Admin;Data Source=" & path
' Open the Database connection.
connection.Open()
' Get all the data from the Database.
Dim query As New OleDbCommand("select * from Products", connection)
' Create a new instance of OleDbDataAdapter.
Dim adapter As New OleDbDataAdapter(query)
' Create a new instance of DataSet.
Dim dataSet As New DataSet()
' Add rows in the Dataset.
adapter.Fill(dataSet)
' Create a DataTable from the Dataset.
Dim table As DataTable = dataSet.Tables(0)
table.TableName = "Products"
Return table
End Using
End Function
' Set the value for the chart.
Private Sub AddChartData(ByVal chart As WChart, ByVal dataTable As DataTable)
' Set the value for the chart data.
chart.ChartData.SetValue(1, 1, "Names")
chart.ChartData.SetValue(1, 2, "Product")
Dim rowIndex As Integer = 2
Dim colIndex As Integer = 1
' Get the value from the DataTable and set the value for the chart data
For Each row As DataRow In dataTable.Rows
For Each val As Object In row.ItemArray
Dim value As String = val.ToString()
chart.ChartData.SetValue(rowIndex, colIndex, value)
colIndex += 1
If colIndex = 3 Then
Exit For
End If
Next
colIndex = 1
rowIndex += 1
Next
End SubYou can download a complete working sample from GitHub.
Refreshing the Chart
The chart may not have the data in the referred Excel file; instead, it may represent some other data. For those charts to display the Excel data, the chart should be refreshed.
The following code example illustrates how to refresh the chart.
FileStream fileStreamPath = new FileStream(@"Data/Template.docx", FileMode.Open, FileAccess.Read, FileShare.ReadWrite);
//Opens an existing document from file system through constructor of WordDocument class
using (WordDocument document = new WordDocument(fileStreamPath, FormatType.Docx))
{
    //Gets the last paragraph
    WParagraph paragraph = document.LastParagraph;
    //Gets the chart entity from the paragraph items
    WChart chart = paragraph.ChildEntities[1] as WChart;
    // Refreshes the chart data. Set true to evaluate Excel formulas before refreshing,
    // or false to refresh only the data without evaluating formulas.
    chart.Refresh(false);
    //Saves the Word document to MemoryStream
    using (MemoryStream stream = new MemoryStream())
    {
        document.Save(stream, FormatType.Docx);
    }
    //Closes the Word document
}
//Loads the template document
using (WordDocument document = new WordDocument("Template.docx"))
{
//Gets the last paragraph
WParagraph paragraph = document.LastParagraph;
//Gets the chart entity from the paragraph items
WChart chart = paragraph.ChildEntities[1] as WChart;
// Refreshes the chart data. Set true to evaluate Excel formulas before refreshing,
// or false to refresh only the data without evaluating formulas.
chart.Refresh(false);
//Saves the document
document.Save("Sample.docx", FormatType.Docx);
}'Loads the template document
Using document As New WordDocument("Template.docx")
'Gets the last paragraph
Dim paragraph As WParagraph = document.LastParagraph
'Gets the chart entity from the paragraph items
Dim chart As WChart = TryCast(paragraph.ChildEntities(1), WChart)
'Refreshes the chart data. Set True to evaluate Excel formulas before refreshing,
'or False to refresh only the data without evaluating formulas.
chart.Refresh(False)
'Saves the document
document.Save("Sample.docx", FormatType.Docx)
End UsingYou can download a complete working sample from GitHub.
Modifying the Chart data
The following code example illustrates how to modify an existing chart data.
FileStream fileStreamPath = new FileStream("Template.docx", FileMode.Open, FileAccess.Read, FileShare.ReadWrite);
//Opens an existing document from file system through constructor of WordDocument class
using (WordDocument document = new WordDocument(fileStreamPath, FormatType.Docx))
{
    //Gets the last paragraph
    WParagraph paragraph = document.LastParagraph;
    //Gets the chart entity from the paragraph items
    WChart chart = paragraph.ChildEntities[0] as WChart;
    //Modifies the data values of chart
    chart.ChartData.SetValue(2, 2, 120);
    chart.ChartData.SetValue(3, 2, 60);
    chart.ChartData.SetValue(4, 2, 70);
    //Refreshes chart data to set the modified values
    chart.Refresh();
    //Saves the Word document to MemoryStream
    using (MemoryStream stream = new MemoryStream())
    {
        document.Save(stream, FormatType.Docx);
    }
    //Closes the Word document
}
//Loads the template document
using (WordDocument document = new WordDocument("Template.docx"))
{
//Gets the last paragraph
WParagraph paragraph = document.LastParagraph;
//Gets the chart entity from the paragraph items
WChart chart = paragraph.ChildEntities[0] as WChart;
//Modifies the data values of chart
chart.ChartData.SetValue(2, 2, 120);
chart.ChartData.SetValue(3, 2, 60);
chart.ChartData.SetValue(4, 2, 70);
//Refreshes chart data to set the modified values
chart.Refresh();
//Saves the document
document.Save("Sample.docx", FormatType.Docx);
}'Loads the template document
Using document As New WordDocument("Template.docx")
'Gets the last paragraph
Dim paragraph As WParagraph = document.LastParagraph
'Gets the chart entity from the paragraph items
Dim chart As WChart = TryCast(paragraph.ChildEntities(0), WChart)
'Modifies the data values of chart
chart.ChartData.SetValue(2, 2, 120)
chart.ChartData.SetValue(3, 2, 60)
chart.ChartData.SetValue(4, 2, 70)
'Refreshes chart data to set the modified values
chart.Refresh()
'Saves the document
document.Save("Sample.docx", FormatType.Docx)
End UsingYou can download a complete working sample from GitHub.
Customizing the Chart & its elements
A Chart is composed of various elements such as plot area, chart area, title area, legend, data labels, axis, etc. The following screenshot illustrates the various elements of a chart.
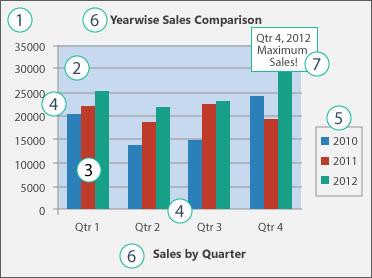
- The chart area of the chart.
- The plot area of the chart.
- The data points of the data series that are plotted in the chart.
- The horizontal (category) and vertical (value) axis along where the data is plotted in the chart.
- The legend of the chart.
- The chart title and axis.
- A data label that you can use to identify the details of a data point in a data series.
Chart Title
Customize the chart title by modifying its name, appearance, and resizing it using the Word (DocIO) library. For further information, click here.
Chart Area
Customize the chart area by changing its border, colors, transparency, and more using the Word (DocIO) library. For further information, click here.
Chart Plot Area
Customize the chart plot area by changing its border, colors, transparency, position and adding image using the Word (DocIO) library. For further information, click here.
Chart Series
Customize the chart series by changing the series name, type, color, border, and more using the Word (DocIO) library. For further information, click here.
Chart Legend
Customize the chart legend by changing the position, border, and modifying the legend entry using the Word (DocIO) library. For further information, click here.
Chart Data Labels
Customize the chart data labels by changing the position, size and more using the Word (DocIO) library. For further information, click here.
Chart Axis
Customize the chart axes by changing the title, border, font, rotation angle and more using the Word (DocIO) library. For further information, click here.
Add Data Table
To add a data table to a chart, enable the HasDataTable property of the WChart class. By default, it is false, hiding the data table. Setting this property to true displays the data table beneath the chart.
Ensure the DataRange property of the
WChartis set before enablingHasDataTable; otherwise the data table renders without values.
The following code example illustrates how to add data table for chart.
//Creates a new instance of WordDocument (Empty Word Document)
using (WordDocument document = new WordDocument())
{
    // Add a section to the document.
    IWSection section = document.AddSection();
    // Add a paragraph to the section.
    IWParagraph paragraph = section.AddParagraph();
    // Create and append the chart to the paragraph.
    WChart chart = paragraph.AppendChart(446, 270);
    // Set chart type.
    chart.ChartType = OfficeChartType.Column_Clustered;
    // Set chart data.
    chart.ChartData.SetValue(2, 1, "Apples");
    chart.ChartData.SetValue(3, 1, "Grapes");
    chart.ChartData.SetValue(4, 1, "Banana");
    chart.ChartData.SetValue(1, 2, "Joey");
    chart.ChartData.SetValue(2, 2, 5);
    chart.ChartData.SetValue(3, 2, 4);
    chart.ChartData.SetValue(4, 2, 4);
    // Define the data range for the chart.
    chart.DataRange = chart.ChartData[1, 1, 4, 2];
    // Add data table to the chart.
    chart.HasDataTable = true;
    IOfficeChartDataTable officeChartDataTable = chart.DataTable;
    // Customize the data table appearance.
    officeChartDataTable.ShowSeriesKeys = true;
    officeChartDataTable.HasBorders = true;
    officeChartDataTable.HasHorzBorder = true;
    officeChartDataTable.HasVertBorder = true;
    //Saves the Word document to MemoryStream
    using (MemoryStream stream = new MemoryStream())
    {
        document.Save(stream, FormatType.Docx);
    }
}
// Create a new Word document.
using (WordDocument document = new WordDocument())
{
// Add a section to the document.
IWSection section = document.AddSection();
// Add a paragraph to the section.
IWParagraph paragraph = section.AddParagraph();
// Create and append the chart to the paragraph.
WChart chart = paragraph.AppendChart(446, 270);
// Set chart type.
chart.ChartType = OfficeChartType.Column_Clustered;
// Set chart data.
chart.ChartData.SetValue(2, 1, "Apples");
chart.ChartData.SetValue(3, 1, "Grapes");
chart.ChartData.SetValue(4, 1, "Banana");
chart.ChartData.SetValue(1, 2, "Joey");
chart.ChartData.SetValue(2, 2, 5);
chart.ChartData.SetValue(3, 2, 4);
chart.ChartData.SetValue(4, 2, 4);
// Define the data range for the chart.
chart.DataRange = chart.ChartData[1, 1, 4, 2];
// Add data table to the chart.
chart.HasDataTable = true;
IOfficeChartDataTable officeChartDataTable = chart.DataTable;
// Customize the data table appearance.
officeChartDataTable.ShowSeriesKeys = true;
officeChartDataTable.HasBorders = true;
officeChartDataTable.HasHorzBorder = true;
officeChartDataTable.HasVertBorder = true;
//Saves the document
document.Save("Sample.docx", FormatType.Docx);
}' Create a new Word document.
Using document As New WordDocument()
' Add a section to the document.
Dim section As IWSection = document.AddSection()
' Add a paragraph to the section.
Dim paragraph As IWParagraph = section.AddParagraph()
' Create and append the chart to the paragraph.
Dim chart As WChart = paragraph.AppendChart(446, 270)
' Set chart type.
chart.ChartType = OfficeChartType.Column_Clustered
' Set chart data.
chart.ChartData.SetValue(2, 1, "Apples")
chart.ChartData.SetValue(3, 1, "Grapes")
chart.ChartData.SetValue(4, 1, "Banana")
chart.ChartData.SetValue(1, 2, "Joey")
chart.ChartData.SetValue(2, 2, 5)
chart.ChartData.SetValue(3, 2, 4)
chart.ChartData.SetValue(4, 2, 4)
' Define the data range for the chart.
chart.DataRange = chart.ChartData(1, 1, 4, 2)
' Add data table to the chart.
chart.HasDataTable = True
Dim officeChartDataTable As IOfficeChartDataTable = chart.DataTable
' Customize the data table appearance.
officeChartDataTable.ShowSeriesKeys = True
officeChartDataTable.HasBorders = True
officeChartDataTable.HasHorzBorder = True
officeChartDataTable.HasVertBorder = True
' Save the document.
document.Save("Sample.docx", FormatType.Docx)
End UsingYou can download a complete working sample from GitHub.
Applying 3D Formats
Essential® DocIO allows you to modify the side wall, back wall, and floor of a 3D chart. The following code snippet illustrates how to apply properties for the side wall, floor, and back wall of a 3D chart.
//Creates a new Word document
using (WordDocument document = new WordDocument())
{
    //Adds section to the document
    IWSection sec = document.AddSection();
    //Adds paragraph to the section
    IWParagraph paragraph = sec.AddParagraph();
    //Loads the excel file as stream
    using (Stream excelStream = File.OpenRead("Excel_Template.xlsx"))
    {
        //Creates and Appends chart to the paragraph with excel stream as parameter
        WChart chart = paragraph.AppendChart(excelStream, 1, "B2:C6", 470, 300);
        //Sets chart type and title
        chart.ChartType = OfficeChartType.Column_Clustered_3D;
        chart.ChartTitle = "Purchase Details";
        chart.ChartTitleArea.FontName = "Calibri";
        chart.ChartTitleArea.Size = 14;
        chart.ChartArea.Border.LinePattern = OfficeChartLinePattern.None;
        //Sets name to chart series
        chart.Series[0].Name = "Sum of Purchases";
        chart.Series[1].Name = "Sum of Future Expenses";
        chart.PrimaryCategoryAxis.Title = "Products";
        chart.PrimaryValueAxis.Title = "In Dollars";
        //Sets position of legend
        chart.Legend.Position = OfficeLegendPosition.Bottom;
        //Sets rotation and elevation values
        chart.Rotation = 20;
        chart.Elevation = 15;
        //Sets side wall properties
        chart.SideWall.Fill.FillType = OfficeFillType.SolidColor;
chart.SideWall.Fill.ForeColor = Color.White;
chart.SideWall.Fill.BackColor = Color.White;
        chart.SideWall.Border.LineColor = Syncfusion.Drawing.Color.Beige;
        //Sets floor fill option.
        chart.Floor.Fill.FillType = OfficeFillType.Pattern;
        //Sets the floor pattern Type.
        chart.Floor.Fill.Pattern = OfficeGradientPattern.Pat_Divot;
        //Sets the floor fore and Back ground color.
        chart.Floor.Fill.ForeColor = Syncfusion.Drawing.Color.Blue;
        chart.Floor.Fill.BackColor = Syncfusion.Drawing.Color.White;
        //Sets the floor thickness.
        chart.Floor.Thickness = 3;
        //Sets the back wall fill option.
        chart.BackWall.Fill.FillType = OfficeFillType.Gradient;
        //Sets the gradient color type.
        chart.BackWall.Fill.GradientColorType = OfficeGradientColor.TwoColor;
        chart.BackWall.Fill.GradientStyle = OfficeGradientStyle.Diagonl_Down;
chart.BackWall.Fill.ForeColor = Color.WhiteSmoke;
chart.BackWall.Fill.BackColor = Color.LightBlue;
        //Sets the Border Line color.
        chart.BackWall.Border.LineColor = Syncfusion.Drawing.Color.Wheat;
        //Sets the Picture Type.
        chart.BackWall.PictureUnit = OfficeChartPictureType.stretch;
        //Sets the back wall thickness.
        chart.BackWall.Thickness = 10;
    }
    //Saves and closes the document
    using (MemoryStream stream = new MemoryStream())
    {
        document.Save(stream, FormatType.Docx);
    }
}
//Creates a new Word document
using (WordDocument document = new WordDocument())
{
//Adds section to the document
IWSection sec = document.AddSection();
//Adds paragraph to the section
IWParagraph paragraph = sec.AddParagraph();
//Loads the excel file as stream
using (Stream excelStream = File.OpenRead("Excel_Template.xlsx"))
{
//Creates and Appends chart to the paragraph with excel stream as parameter
WChart chart = paragraph.AppendChart(excelStream, 1, "B2:C6", 470, 300);
//Sets chart type and title
chart.ChartType = OfficeChartType.Column_Clustered_3D;
chart.ChartTitle = "Purchase Details";
chart.ChartTitleArea.FontName = "Calibri";
chart.ChartTitleArea.Size = 14;
chart.ChartArea.Border.LinePattern = OfficeChartLinePattern.None;
//Sets name to chart series
chart.Series[0].Name = "Sum of Purchases";
chart.Series[1].Name = "Sum of Future Expenses";
chart.PrimaryCategoryAxis.Title = "Products";
chart.PrimaryValueAxis.Title = "In Dollars";
//Sets position of legend
chart.Legend.Position = OfficeLegendPosition.Bottom;
//Sets rotation and elevation values
chart.Rotation = 20;
chart.Elevation = 15;
//Sets side wall properties
chart.SideWall.Fill.FillType = OfficeFillType.SolidColor;
chart.SideWall.Fill.ForeColor = Color.White;
chart.SideWall.Fill.BackColor = Color.White;
chart.SideWall.Border.LineColor = System.Drawing.Color.Beige;
//Sets floor fill option.
chart.Floor.Fill.FillType = OfficeFillType.Pattern;
//Sets the floor pattern Type.
chart.Floor.Fill.Pattern = OfficeGradientPattern.Pat_Divot;
//Sets the floor fore and Back ground color.
chart.Floor.Fill.ForeColor = System.Drawing.Color.Blue;
chart.Floor.Fill.BackColor = System.Drawing.Color.White;
//Sets the floor thickness.
chart.Floor.Thickness = 3;
//Sets the back wall fill option.
chart.BackWall.Fill.FillType = OfficeFillType.Gradient;
//Sets the gradient color type.
chart.BackWall.Fill.GradientColorType = OfficeGradientColor.TwoColor;
chart.BackWall.Fill.GradientStyle = OfficeGradientStyle.Diagonl_Down;
chart.BackWall.Fill.ForeColor = Color.WhiteSmoke;
chart.BackWall.Fill.BackColor = Color.LightBlue;
//Sets the Border Line color.
chart.BackWall.Border.LineColor = System.Drawing.Color.Wheat;
//Sets the Picture Type.
chart.BackWall.PictureUnit = OfficeChartPictureType.stretch;
//Sets the back wall thickness.
chart.BackWall.Thickness = 10;
}
//Saves and closes the document
document.Save("Sample.docx", FormatType.Docx);
}'Creates a new Word document
Using document As New WordDocument()
'Adds section to the document
Dim sec As IWSection = document.AddSection()
'Adds paragraph to the section
Dim paragraph As IWParagraph = sec.AddParagraph()
'Loads the excel file as stream
Using excelStream As Stream = File.OpenRead("Excel_Template.xlsx")
'Creates and Appends chart to the paragraph with excel stream as parameter
Dim chart As WChart = paragraph.AppendChart(excelStream, 1, "B2:C6", 470, 300)
'Sets chart type and title
chart.ChartType = OfficeChartType.Column_Clustered_3D
chart.ChartTitle = "Purchase Details"
chart.ChartTitleArea.FontName = "Calibri"
chart.ChartTitleArea.Size = 14
chart.ChartArea.Border.LinePattern = OfficeChartLinePattern.None
'Sets name to chart series
chart.Series(0).Name = "Sum of Purchases"
chart.Series(1).Name = "Sum of Future Expenses"
chart.PrimaryCategoryAxis.Title = "Products"
chart.PrimaryValueAxis.Title = "In Dollars"
'Sets position of legend
chart.Legend.Position = OfficeLegendPosition.Bottom
'Sets rotation and elevation values
chart.Rotation = 20
chart.Elevation = 15
'Sets side wall properties
chart.SideWall.Fill.FillType = OfficeFillType.SolidColor
chart.SideWall.Fill.ForeColor = Color.White
chart.SideWall.Fill.BackColor = Color.White
chart.SideWall.Border.LineColor = System.Drawing.Color.Beige
'Sets floor fill option.
chart.Floor.Fill.FillType = OfficeFillType.Pattern
'Sets the floor pattern Type.
chart.Floor.Fill.Pattern = OfficeGradientPattern.Pat_Divot
'Sets the floor fore and Back ground color.
chart.Floor.Fill.ForeColor = System.Drawing.Color.Blue
chart.Floor.Fill.BackColor = System.Drawing.Color.White
'Sets the floor thickness.
chart.Floor.Thickness = 3
'Sets the back wall fill option.
chart.BackWall.Fill.FillType = OfficeFillType.Gradient
'Sets the gradient color type.
chart.BackWall.Fill.GradientColorType = OfficeGradientColor.TwoColor
chart.BackWall.Fill.GradientStyle = OfficeGradientStyle.Diagonl_Down
chart.BackWall.Fill.ForeColor = Color.WhiteSmoke
chart.BackWall.Fill.BackColor = Color.LightBlue
'Sets the Border Line color.
chart.BackWall.Border.LineColor = System.Drawing.Color.Wheat
'Sets the Picture Type.
chart.BackWall.PictureUnit = OfficeChartPictureType.stretch
'Sets the back wall thickness.
chart.BackWall.Thickness = 10
End Using
'Saves and closes the document
document.Save("Sample.docx", FormatType.Docx)
End UsingYou can download a complete working sample from GitHub.
Removing Chart
The following code example illustrates how to remove the chart from the document.
//Loads the template document
FileStream fileStreamPath = new FileStream("Template.docx", FileMode.Open, FileAccess.Read, FileShare.ReadWrite);
using (WordDocument document = new WordDocument(fileStreamPath, FormatType.Docx))
{
    //Gets the last paragraph
    WParagraph paragraph = document.LastParagraph;
    //Gets the chart entity and remove it from paragraph
    foreach (ParagraphItem item in paragraph.ChildEntities)
    {
        if (item is WChart)
        {
            paragraph.ChildEntities.Remove(item);
            break;
        }
    }
    //Saves the Word document to  MemoryStream
    using (MemoryStream stream = new MemoryStream())
    {
        document.Save(stream, FormatType.Docx);
    }
}
//Loads the template document
using (WordDocument document = new WordDocument("Template.docx"))
{
//Gets the last paragraph
WParagraph paragraph = document.LastParagraph;
//Gets the chart entity and remove it from paragraph
foreach (ParagraphItem item in paragraph.ChildEntities)
{
if (item is WChart)
{
paragraph.ChildEntities.Remove(item);
break;
}
}
//Saves the document
document.Save("Sample.docx", FormatType.Docx);
}'Loads the template document
Using document As New WordDocument("Template.docx")
'Gets the last paragraph
Dim paragraph As WParagraph = document.LastParagraph
'Gets the chart entity and removes it from paragraph
For Each item As ParagraphItem In paragraph.ChildEntities
If TypeOf item Is WChart Then
paragraph.ChildEntities.Remove(item)
Exit For
End If
Next
'Saves the document
document.Save("Sample.docx", FormatType.Docx)
End UsingYou can download a complete working sample from GitHub.
Convert chart to image
You can convert the chart in Word document as image using the SaveAsImage method in ChartToImageConverter.
To convert chart in Word document as an image, refer the below dependencies in your application.
| Platform(s) | NuGet for Chart to Image | Assemblies for Chart to image |
|---|---|---|
| Cross-platform, Xamarin | ||
| Windows-specific |
|
|
| UWP |
The following code example shows how to convert chart in the Word document as image.
//Open the file as Stream.
using (FileStream docStream = new FileStream("TemplateWithChart.docx", FileMode.Open))
{
    //Load file stream into Word document.
    using (WordDocument wordDocument = new WordDocument(docStream, Syncfusion.DocIO.FormatType.Automatic))
    {
        //Get the first paragraph from the section.
        WParagraph paragraph = wordDocument.LastSection.Paragraphs[0];
        //Get the chart element from the paragraph.
        WChart chart = paragraph.ChildEntities[0] as WChart;
        //Create an instance of DocIORenderer.
        using (DocIORenderer renderer = new DocIORenderer())
        {
            //Convert chart to an image.
            using (Stream stream = chart.SaveAsImage())
            {
                //Create the output image file stream.
                using (FileStream fileStreamOutput = File.Create("ChartToImage.jpeg"))
                {
                    //Copies the converted image stream into created output stream.
                    stream.CopyTo(fileStreamOutput);
                }
            }
        }
    }
}
//Loads an existing Word document.
using (WordDocument wordDocument = new WordDocument("TemplateWithChart.docx", FormatType.Docx))
{
//Initializes the ChartToImageConverter for converting charts during Word to image conversion.
wordDocument.ChartToImageConverter = new ChartToImageConverter();
//Sets the scaling mode for charts. (Normal mode reduces the file size)
wordDocument.ChartToImageConverter.ScalingMode = ScalingMode.Normal;
//Gets the first paragraph from section.
WParagraph paragraph = wordDocument.LastSection.Paragraphs[0];
//Gets the chart element in the paragraph item.
WChart chart = paragraph.ChildEntities[0] as WChart;
//Creating the memory stream for chart image.
using (MemoryStream stream = new MemoryStream())
{
//Converts chart to image.
wordDocument.ChartToImageConverter.SaveAsImage(chart.OfficeChart, stream);
using (Image image = Image.FromStream(stream))
{
//Saving image stream to file.
image.Save("ChartToImage.jpeg", ImageFormat.Jpeg);
}
}
}'Loads an existing Word document.
Using wordDocument As New WordDocument("TemplateWithChart.docx", FormatType.Docx)
'Initializes the ChartToImageConverter for converting charts during Word to image conversion.
wordDocument.ChartToImageConverter = New ChartToImageConverter()
'Sets the scaling mode for charts. (Normal mode reduces the file size)
wordDocument.ChartToImageConverter.ScalingMode = ScalingMode.Normal
'Gets the first paragraph from section.
Dim paragraph As WParagraph = wordDocument.LastSection.Paragraphs(0)
'Gets the chart element in the paragraph item.
Dim chart As WChart = TryCast(paragraph.ChildEntities(0), WChart)
'Creating the memory stream for chart image.
Using stream As New MemoryStream()
'Converts chart to image.
wordDocument.ChartToImageConverter.SaveAsImage(chart.OfficeChart, stream)
Using image As Image = Image.FromStream(stream)
'Saving image stream to file.
image.Save("ChartToImage.jpeg", ImageFormat.Jpeg)
End Using
End Using
End UsingYou can download a complete working sample from GitHub.
- To convert chart in Word document as image, you need to refer chart conversion related assemblies or NuGet packages.
- The ChartToImageConverter is supported from .NET Framework 4.0 onwards.
Supported Chart Types
The following chart types are supported in DocIO.
- Area
- Area_3D
- Area_Stacked
- Area_Stacked_100
- Area_Stacked_100_3D
- Area_Stacked_3D
- Bar_Clustered
- Bar_Clustered_3D
- Bar_Stacked
- Bar_Stacked_100
- Bar_Stacked_100_3D
- Bar_Stacked_3D
- Bubble
- Bubble_3D
- Column_3D
- Column_Clustered
- Column_Clustered_3D
- Column_Stacked
- Column_Stacked_100
- Column_Stacked_100_3D
- Column_Stacked_3D
- Combination_Chart
- Cone_Bar_Clustered
- Cone_Bar_Stacked
- Cone_Bar_Stacked_100
- Cone_Clustered
- Cone_Clustered_3D
- Cone_Stacked
- Cone_Stacked_100
- Cylinder_Bar_Clustered
- Cylinder_Bar_Stacked
- Cylinder_Bar_Stacked_100
- Cylinder_Clustered
- Cylinder_Clustered_3D
- Cylinder_Stacked
- Cylinder_Stacked_100
- Doughnut
- Line
- Line_3D
- Line_Markers
- Line_Markers_Stacked
- Line_Markers_Stacked_100
- Line_Stacked
- Line_Stacked_100
- Pie
- Pie_3D
- Pie_Bar
- Pie_Exploded
- Pie_Exploded_3D
- PieOfPie
- Pyramid_Bar_Clustered
- Pyramid_Bar_Stacked
- Pyramid_Bar_Stacked_100
- Pyramid_Clustered
- Pyramid_Clustered_3D
- Pyramid_Stacked
- Pyramid_Stacked_100
- Radar
- Radar_Filled
- Radar_Markers
- Scatter_Line
- Scatter_Line_Markers
- Scatter_Markers
- Scatter_SmoothedLine
- Scatter_SmoothedLine_Markers
- Stock_HighLowClose
- Stock_OpenHighLowClose
- Stock_VolumeHighLowClose
- Stock_VolumeOpenHighLowClose
- Surface_3D
- Surface_Contour
- Surface_NoColor_3D
- Surface_NoColor_Contour
Word 2016 Charts
These charts are supported only in Word 2016 and are not supported in the previous versions.
Online Demo
- Explore how to insert a bar chart into the Word document using the .NET Word Library (DocIO) in a live demo here.
- See how to insert a pie chart into the Word document using the .NET Word Library (DocIO) in a live demo here.
See Also
- How to set Date format in X axis of chart in Word document
- How to change scatter chart marker color for each data points in Word document
- How to create line chart in Word document using C# and VB.NET
- How to create clustered column chart in Word document using C# and VB.NET
- How to create bubble chart in Word document using C# and VB.NET
- How to create line chart with different color series in Word document using C#?
- How to set column space for column charts in Word document?
- How to set Y-axis interval for column charts in Word document?
- How to change chart title position in the Word document?
- How to align text to the right of the stacked bar chart in a Word document
- How to set 2D array data values for a combination chart in a Word document
- How to find and edit a specific shape or chart by name in a Word document?
- How to Extract and Save Charts in a .NET Core Word Document?