Getting Started with TypeScript Diagram
This section explains the steps required to create a simple diagram and demonstrates the basic usage of the TypeScript Diagram control using a seed application.
Ready to streamline your Syncfusion® TypeScript development? Discover the full potential of Syncfusion® TypeScript control with Syncfusion® AI Coding Assistant. Effortlessly integrate, configure, and enhance your projects with intelligent, context-aware code suggestions, streamlined setups, and real-time insights—all seamlessly integrated into your preferred AI-powered IDEs like VS Code, Cursor, Syncfusion® CodeStudio and more. Explore Syncfusion® AI Coding Assistant.
Prerequisites
Ensure the following tools are installed on your machine:
Set up the development environment
Open the command prompt from the required directory, and run the following command to clone the Syncfusion® TypeScript (Essential® JS 2) quickstart project from GitHub.
git clone https://github.com/SyncfusionExamples/ej2-quickstart-webpack ej2-quickstart
After cloning the application in the ej2-quickstart folder, run the following command to navigate to the folder.
cd ej2-quickstart
Install Syncfusion TypeScript packages
Syncfusion® TypeScript (Essential® JS 2) packages are available on the npmjs.com public registry. The quickstart application is preconfigured with the dependent @syncfusion/ej2 package in the package.json file.
Use the following command to install the dependent npm packages from the command prompt.
npm install
Import Syncfusion® CSS styles
The TypeScript Diagram control needs Syncfusion® theme styles to display correctly. Syncfusion® theme packages include ready-to-use styles for supported control.
To add the styles, install the Tailwind theme package using the following command:
npm install @syncfusion/ej2-tailwind-theme
Then add the following CSS reference to the src/styles/styles.css file:
@import "../../node_modules/@syncfusion/ej2-tailwind-theme/styles/diagram/index.css";
For the list of available themes, refer to the Themes documentation.
Syncfusion® provides multiple built-in themes. If the application uses a different theme, replace @syncfusion/ej2-tailwind-theme/styles/diagram/index.css with the corresponding stylesheet from the desired theme package. For example, to use the Material 3 theme, import @syncfusion/ej2-material3-theme/styles/diagram/index.css.
Add the HTML element
Open the ~/src/index.html file and add the following HTML element for the TypeScript Diagram component.
<!DOCTYPE html>
<html lang="en">
<head>
    <title>Essential JS 2</title>
    <meta charset="utf-8" />
    <meta name="viewport" content="width=device-width, initial-scale=1.0, user-scalable=no" />
</head>
<body>
    <div>
        <!--HTML diagram element, which is going to render as Essential JS 2 Diagram-->
        <div id="diagram"></div>
    </div>
</body>
</html>
Create your first Diagram with nodes and connectors
This section explains how to create a simple flowchart by adding nodes, customizing their appearance, and connecting them using connectors.
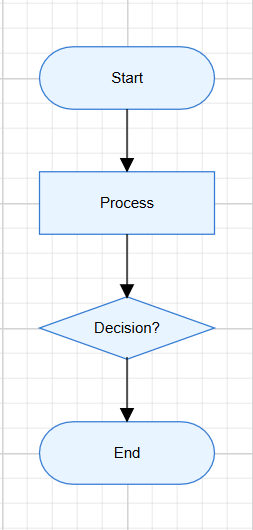
The following example creates a flowchart with four nodes: Start, Process, Decision, and End. It also applies common node and connector settings through the getNodeDefaults and getConnectorDefaults callback bindings.
Open the src/app/app.ts file and add the following code to render the TypeScript Diagram control.
import { Diagram, NodeModel, ConnectorModel } from '@syncfusion/ej2-diagrams';

// Node defaults function
function nodeDefaults(node: NodeModel): NodeModel {
    node.width = 140;
    node.height = 50;
    node.style = {
        fill: '#E8F4FF',
        strokeColor: '#357BD2'
    };
    return node;
}

// Connector defaults function
function connectorDefaults(connector: ConnectorModel): ConnectorModel {
    connector.type = 'Orthogonal';
    connector.targetDecorator = {
        shape: 'Arrow',
        width: 10,
        height: 10
    };
    return connector;
}

// Initialize the TypeScript Diagram control
let diagram: Diagram = new Diagram({
    width: '100%',
    height: '580px',
    getNodeDefaults: nodeDefaults,
    getConnectorDefaults: connectorDefaults,
    nodes: [
        {
            id: 'node1',
            offsetX: 300,
            offsetY: 100,
            shape: {
                type: 'Flow',
                shape: 'Terminator'
            },
            annotations: [{
                content: 'Start'
            }]
        },
        {
            id: 'node2',
            offsetX: 300,
            offsetY: 200,
            shape: {
                type: 'Flow',
                shape: 'Process'
            },
            annotations: [{
                content: 'Process'
            }]
        },
        {
            id: 'node3',
            offsetX: 300,
            offsetY: 300,
            shape: {
                type: 'Flow',
                shape: 'Decision'
            },
            annotations: [{
                content: 'Decision?'
            }]
        },
        {
            id: 'node4',
            offsetX: 300,
            offsetY: 400,
            shape: {
                type: 'Flow',
                shape: 'Terminator'
            },
            annotations: [{
                content: 'End'
            }]
        }
    ],
    connectors: [
        {
            id: 'connector1',
            sourceID: 'node1',
            targetID: 'node2'
        },
        {
            id: 'connector2',
            sourceID: 'node2',
            targetID: 'node3'
        },
        {
            id: 'connector3',
            sourceID: 'node3',
            targetID: 'node4'
        }
    ]
});

// Render initialized Diagram
diagram.appendTo('#diagram');
In this example:
-
offsetXandoffsetYdefine the position of each node. -
shapedefines the node shape configuration, and thetype: 'Flow'withshape: 'Terminator','Process', or'Decision'specifies flowchart shapes. -
annotationsadds text inside each node using thecontentproperty. -
sourceIDandtargetIDconnect one node to another. -
getNodeDefaultsapplies common width, height, fill color, and stroke color to all nodes. -
getConnectorDefaultsapplies common connector settings, such as orthogonal routing and target arrows.
Run the application
Run the application in the browser using the following command:
npm start
Then open the local URL shown in the terminal, such as http://localhost:4000. The application displays a flowchart diagram with four nodes connected by orthogonal connectors.
The output will appear as follows: