Types in WPF Surface Chart
The Essential Surface Chart provides the following types to plot three-dimensional data points.
- Surface
- WireframeSurface
- Contour
- WireframeContour
Surface
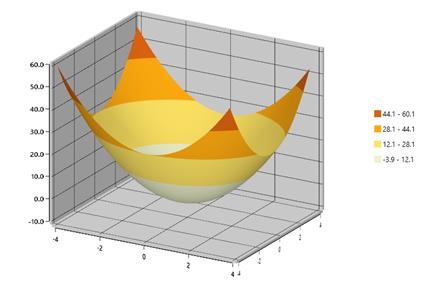
Surface charts are used to explore the relationship between three-dimensional data.
The following code shows how to set the type of surface.
<chart:SfSurfaceChart ItemsSource="{Binding DataValues}"  XBindingPath="X"  Type="Surface"
                              YBindingPath="Y" ZBindingPath="Z" RowSize="{Binding RowSize}"
                              ColumnSize="{Binding ColumnSize}" >
    </chart:SfSurfaceChart>
SfSurfaceChart chart = new SfSurfaceChart();
chart.Type = SurfaceType.Surface;
chart.SetBinding(SfSurfaceChart.ItemsSourceProperty, "DataValues");
chart.SetBinding(SfSurfaceChart.RowSizeProperty, "RowSize");
chart.SetBinding(SfSurfaceChart.ColumnSizeProperty, "ColumnSize");
chart.XBindingPath = "X";
chart.YBindingPath = "Y";
chart.ZBindingPath = "Z";
grid.Children.Add(chart);The following code specifies the view model data bound to the chart for the surface type.
public class Data
{
    public double X { get; set; }
    public double Y { get; set; }
    public double Z { get; set; }
}

public class DataViewModel
{
    public ObservableCollection<Data> DataValues { get; set; }

    public int RowSize { get; set; }

    public int ColumnSize { get; set; }

    public DataViewModel()
    {
        DataValues = new ObservableCollection<Data>();
        double inc = 8.0 / 35;
        for (double x = -4; x < 4; x += inc)
        {
            for (double z = -4; z < 4; z += inc)
            {
                double y = 2 * (x * x) + 2 * (z * z) - 4;
                DataValues.Add(new Data() { X = x, Y = y, Z = z });
            }
        }
        RowSize = 35;
        ColumnSize = 35;
    }
}
WireframeSurface
You can draw the wireframe or mesh for the surface chart.
<chart:SfSurfaceChart ItemsSource="{Binding DataValues}"  XBindingPath="X"  Type="WireframeSurface"
                              YBindingPath="Y" ZBindingPath="Z" RowSize="{Binding RowSize}"
                              ColumnSize="{Binding ColumnSize}" >
    </chart:SfSurfaceChart>
SfSurfaceChart chart = new SfSurfaceChart();
chart.Type = SurfaceType.WireframeSurface;
chart.SetBinding(SfSurfaceChart.ItemsSourceProperty, "DataValues");
chart.SetBinding(SfSurfaceChart.RowSizeProperty, "RowSize");
chart.SetBinding(SfSurfaceChart.ColumnSizeProperty, "ColumnSize");
chart.XBindingPath = "X";
chart.YBindingPath = "Y";
chart.ZBindingPath = "Z";
grid.Children.Add(chart);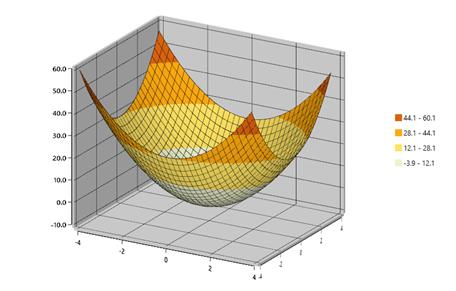
Contour
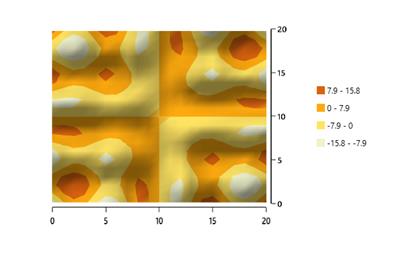
Viewing the surface chart from the top is called a contour. It is a graphical technique that represents the three-dimensional surface in a two-dimensional format.
<chart:SfSurfaceChart ItemsSource="{Binding DataValues}"  XBindingPath="X"  Type="Contour" Rotate="0"
                              YBindingPath="Y" ZBindingPath="Z" RowSize="{Binding RowSize}"
                              ColumnSize="{Binding ColumnSize}" >

            <chart:SfSurfaceChart.ColorBar>
                <chart:ChartColorBar ShowLabel="True" DockPosition="Right"/>
            </chart:SfSurfaceChart.ColorBar>

          </chart:SfSurfaceChart>
SfSurfaceChart chart = new SfSurfaceChart();
chart.Type = SurfaceType.Contour;
chart.Rotate = 0;
ChartColorBar colorBar = new ChartColorBar();
colorBar.DockPosition = ChartDock.Right;
colorBar.ShowLabel = true;
chart.ColorBar = colorBar;
SetData();
grid.Children.Add(chart);The following code specifies the view model data bound to the chart for contour type.
private void SetData()
        {
            int x = 0;
            for (double i = -10; i <= 10; i++, x++)
            {
                int z = 0;
                for (double j = -10; j <= 10; j++, z++)
                {
                    double y = i * Math.Sin(j) + j * Math.Sin(i);
                    chart.Data.AddPoints(x, y, z);
                }
            }

            chart.RowSize = 21;
            chart.ColumnSize = 21;
        }
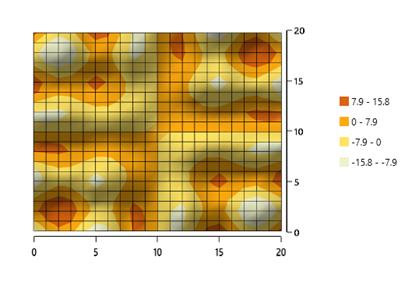
WireframeContour
You can draw the wireframe or mesh for the contour chart.
<chart:SfSurfaceChart ItemsSource="{Binding DataValues}"  XBindingPath="X"  Type="WireframeContour"
                              YBindingPath="Y" ZBindingPath="Z" RowSize="{Binding RowSize}" Rotate="0"
                              ColumnSize="{Binding ColumnSize}" >

            <chart:SfSurfaceChart.ColorBar>
                <chart:ChartColorBar ShowLabel="True" DockPosition="Right"/>
            </chart:SfSurfaceChart.ColorBar>
         </chart:SfSurfaceChart>
SfSurfaceChart chart = new SfSurfaceChart();
chart.Type = SurfaceType.WireframeContour;
chart.Rotate = 0;
ChartColorBar colorBar = new ChartColorBar();
colorBar.DockPosition = ChartDock.Right;
colorBar.ShowLabel = true;
chart.ColorBar = colorBar;
SetData();
grid.Children.Add(chart);