About Syncfusion WPF Charts Control
WPF Charts provides an excellent way to visualize data with a high level of user interactivity, focusing on development productivity and ease of use. It also offers a wide range of charting features for visualizing large volumes of data, flexible data binding, and extensive customization options.
Key features
- WPF Charts supports 38 different types of series, ranging from simple bar series to complex financial charts. Each chart type represents data with a unique style, providing more user-friendly and greater UI visualization.
- Capable of rendering large amounts of data within a few milliseconds (ms).
- Allows you to map data from the specified path by achieving data binding concept.
- Interactive zooming can be done with touch mode enabled, allowing you to explore portions of large charts in more detail, with excellent performance.
- When you need more information about a particular segment in a chart, hovering over the series provides more information through tooltip, crosshair, and trackball behavior.
- Supports 10 different types of technical indicators that determine financial, stock, or economic trends by analyzing a set of recorded data.
- Supports multiple axes that can be stacked and spanned for multiple panes.
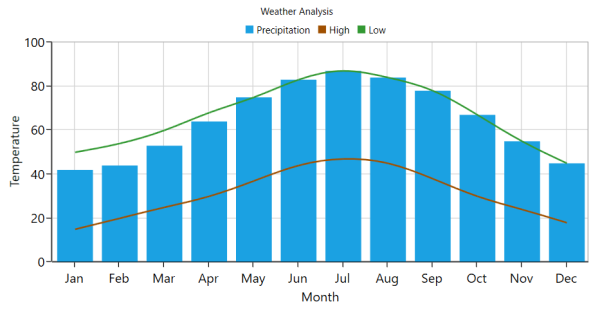
- WPF Charts provides support for rendering multiple series at the same time, with options to compare and visualize two different chart series simultaneously.
- User-friendly and provides various options for you to customize chart features like axis, labels, legends, series, etc., and visualize them accordingly.
You can refer to our WPF Charts feature tour page for its groundbreaking feature representations. You can also explore our WPF Charts example to know various chart types and how they can be easily configured with built-in support for creating stunning visual effects.