Measures in WPF Bullet Graph
Featured Measure
The featured measure is used to display the primary data, or the current value of the data that you are measuring. It should usually be encoded as a bar.
Customizing the featured measure
The value of the featured measure of the bullet graph is set by the FeaturedMeasure property. By setting the FeaturedMeasureBarStroke property, the stroke of the featured measure bar can be customized. The thickness of the featured measure bar is modified by using the FeaturedMeasureBarStrokeThickness property.
<syncfusion:SfBulletGraph FeaturedMeasure="5" FeaturedMeasureBarStroke="Red" ComparativeMeasure="7"
    FeaturedMeasureBarStrokeThickness="10" Minimum="0" Maximum="10" Interval="2" MinorTicksPerInterval="3"
                                  MinorTickSize="10" MajorTickSize="14">
            <syncfusion:SfBulletGraph.QualitativeRanges>
                <syncfusion:QualitativeRange RangeEnd="4.5" RangeStroke="#EBEBEB"></syncfusion:QualitativeRange>
                <syncfusion:QualitativeRange RangeEnd="10" RangeStroke="#7F7F7F"></syncfusion:QualitativeRange>
                <syncfusion:QualitativeRange RangeEnd="7.5" RangeStroke="#D8D8D8"></syncfusion:QualitativeRange>
            </syncfusion:SfBulletGraph.QualitativeRanges>
        </syncfusion:SfBulletGraph>
SfBulletGraph bulletgraph = new SfBulletGraph();
bulletgraph.Minimum = 0;
bulletgraph.Maximum = 10;
bulletgraph.Interval = 2;
bulletgraph.FeaturedMeasure = 5;
bulletgraph.ComparativeMeasure = 7;
bulletgraph.FeaturedMeasureBarStrokeThickness = 10;
bulletgraph.FeaturedMeasureBarStroke = new SolidColorBrush(Colors.Red);
bulletgraph.MinorTicksPerInterval = 3;
bulletgraph.MinorTickSize = 10;
bulletgraph.MajorTickSize = 14;
QualitativeRange range1 = new QualitativeRange();
range1.RangeEnd = 4.5;
range1.RangeStroke = (Brush)new BrushConverter().ConvertFrom("#EBEBEB");
QualitativeRange range2 = new QualitativeRange();
range2.RangeEnd = 10;
range2.RangeStroke = (Brush)new BrushConverter().ConvertFrom("#7F7F7F");
QualitativeRange range3 = new QualitativeRange();
range3.RangeEnd = 7.5;
range3.RangeStroke = (Brush)new BrushConverter().ConvertFrom("#D8D8D8");
bulletgraph.QualitativeRanges.Add(range1);
bulletgraph.QualitativeRanges.Add(range2);
bulletgraph.QualitativeRanges.Add(range3);
grid.Children.Add(bulletgraph);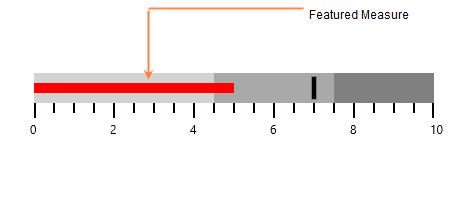
Comparative Measure
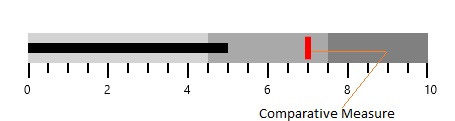
The comparative measure should be less visually dominant than the featured measure. It should always be encoded as a short line that runs perpendicular to the orientation of the graph. A good example would be a target for YTD revenue. Whenever the featured measure intersects a comparative measure, the comparative measure should appear behind the featured measure.
Customizing the comparative measure
The value of the comparative measure is set by using the ComparativeMeasure property. By setting the ComparativeMeasureSymbolStroke property, the stroke of the comparative measure symbol is customized. The thickness of the comparative measure symbol is modified by using the ComparativeMeasureSymbolStrokeThickness property.
<syncfusion:SfBulletGraph FeaturedMeasure="5" FeaturedMeasureBarStroke="Black" ComparativeMeasure="7"
    ComparativeMeasureSymbolStrokeThickness="6" ComparativeMeasureSymbolStroke="Red" Minimum="0" Maximum="10" Interval="2" MinorTicksPerInterval="3"
                                  MinorTickSize="10" MajorTickSize="14">
            <syncfusion:SfBulletGraph.QualitativeRanges>
                <syncfusion:QualitativeRange RangeEnd="4.5" RangeStroke="#EBEBEB"></syncfusion:QualitativeRange>
                <syncfusion:QualitativeRange RangeEnd="10" RangeStroke="#7F7F7F"></syncfusion:QualitativeRange>
                <syncfusion:QualitativeRange RangeEnd="7.5" RangeStroke="#D8D8D8"></syncfusion:QualitativeRange>
            </syncfusion:SfBulletGraph.QualitativeRanges>
        </syncfusion:SfBulletGraph>
SfBulletGraph bulletgraph = new SfBulletGraph();
bulletgraph.Minimum = 0;
bulletgraph.Maximum = 10;
bulletgraph.Interval = 2;
bulletgraph.FeaturedMeasure = 5;
bulletgraph.ComparativeMeasure = 7;
bulletgraph.ComparativeMeasureSymbolStroke = new SolidColorBrush(Colors.Red);
bulletgraph.ComparativeMeasureSymbolStrokeThickness = 6;
bulletgraph.FeaturedMeasureBarStroke = new SolidColorBrush(Colors.Black);
bulletgraph.MinorTicksPerInterval = 3;
bulletgraph.MinorTickSize = 10;
bulletgraph.MajorTickSize = 14;
QualitativeRange range1 = new QualitativeRange();
range1.RangeEnd = 4.5;
range1.RangeStroke = (Brush)new BrushConverter().ConvertFrom("#EBEBEB");
QualitativeRange range2 = new QualitativeRange();
range2.RangeEnd = 10;
range2.RangeStroke = (Brush)new BrushConverter().ConvertFrom("#7F7F7F");
QualitativeRange range3 = new QualitativeRange();
range3.RangeEnd = 7.5;
range3.RangeStroke = (Brush)new BrushConverter().ConvertFrom("#D8D8D8");
bulletgraph.QualitativeRanges.Add(range1);
bulletgraph.QualitativeRanges.Add(range2);
bulletgraph.QualitativeRanges.Add(range3);
grid.Children.Add(bulletgraph);