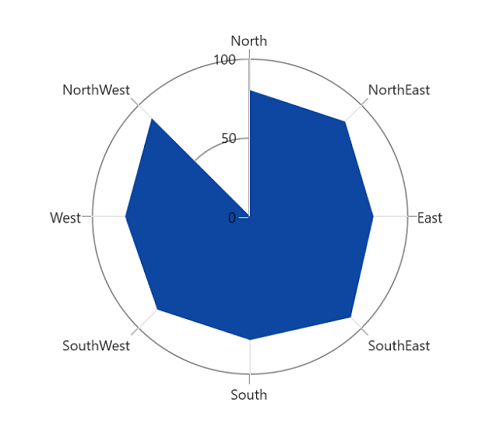
Area Chart in WinUI Polar Chart
To render an area series in the polar chart, create an instance of the PolarAreaSeries and add it to the Series collection property of SfPolarChart. To plot the series, the XBindingPath and YBindingPath properties must be configured, and the Label property can be set for legend purposes.
<chart:SfPolarChart>

    <!-- Configure additional chart elements -->
    <chart:SfPolarChart.Series>
        <chart:PolarAreaSeries
            ItemsSource="{Binding PlantDetails}"
            XBindingPath="Direction"
            YBindingPath="Tree" Label="Tree"/>

        <chart:PolarAreaSeries
            ItemsSource="{Binding PlantDetails}"
            XBindingPath="Direction"
            YBindingPath="Weed" Label="Weed"/>

        <chart:PolarAreaSeries
            ItemsSource="{Binding PlantDetails}"
            XBindingPath="Direction"
            YBindingPath="Flower" Label="Flower"/>
    </chart:SfPolarChart.Series>

</chart:SfPolarChart>
SfPolarChart chart = new SfPolarChart();
// Configure additional chart elements
PolarAreaSeries series1 = new PolarAreaSeries();
series1.XBindingPath = "Direction";
series1.YBindingPath = "Tree";
series1.ItemsSource = viewModel.PlantDetails;
PolarAreaSeries series2 = new PolarAreaSeries();
series2.XBindingPath = "Direction";
series2.YBindingPath = "Weed";
series2.ItemsSource = viewModel.PlantDetails;
PolarAreaSeries series3 = new PolarAreaSeries();
series3.XBindingPath = "Direction";
series3.YBindingPath = "Flower";
series3.ItemsSource = viewModel.PlantDetails;
chart.Series.Add(series1);
chart.Series.Add(series2);
chart.Series.Add(series3);
// Configure additional chart elements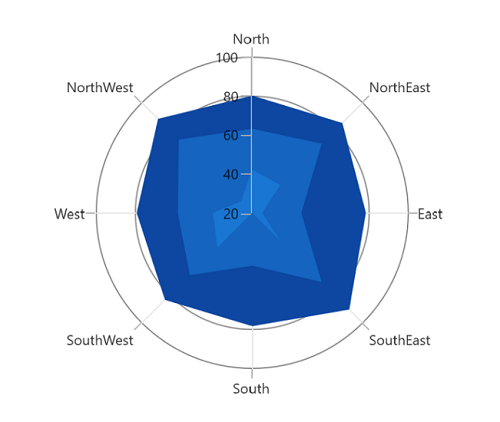
Grid line type
The GridLineType property is used to change the rendering type of axis grid lines. The default value of GridLineType is Circle. By changing the grid line type to Polygon, the polar chart can be shown similar to a spider chart or web chart.
<chart:SfPolarChart GridLineType="Polygon">

    <!-- Configure additional chart elements -->
    <chart:SfPolarChart.Series>
        <chart:PolarAreaSeries
            ItemsSource="{Binding PlantDetails}"
            XBindingPath="Direction"
            YBindingPath="Tree"/>
    </chart:SfPolarChart.Series>

</chart:SfPolarChart>
SfPolarChart chart = new SfPolarChart();
chart.GridLineType= PolarChartGridLineType.Polygon;
// Configure additional chart elements
PolarAreaSeries series = new PolarAreaSeries();
series.XBindingPath = "Direction";
series.YBindingPath = "Tree";
series.ItemsSource = viewModel.PlantDetails;
chart.Series.Add(series);
// Configure additional chart elements
Closing Path
IsClosed property is used to render the series with or without a closed path. The default value of IsClosed is true.
<chart:SfPolarChart GridLineType="Polygon">

    <!-- Configure additional chart elements -->
    <chart:SfPolarChart.Series>
        <chart:PolarAreaSeries
            ItemsSource="{Binding PlantDetails}"
            XBindingPath="Direction"
            YBindingPath="Tree"
            IsClosed="False"/>
    </chart:SfPolarChart.Series>

</chart:SfPolarChart>
SfPolarChart chart = new SfPolarChart();
chart.GridLineType= PolarChartGridLineType.Polygon;
// Configure additional chart elements
PolarAreaSeries series = new PolarAreaSeries();
series.XBindingPath = "Direction";
series.YBindingPath = "Tree";
series.ItemsSource = viewModel.PlantDetails;
series.IsClosed= false;
chart.Series.Add(series);