Appearance in WinUI Polar Chart
The appearance of the SfPolarChart can be customized by using predefined palettes, custom palettes, and gradients, which help enrich the application.
Default PaletteBrushes
Currently, the SfPolarChart supports only one predefined PaletteBrushes, and these are the default brushes for the SfPolarChart. The following screenshot shows the default appearance of multiple series.
<chart:SfPolarChart x:Name="chart" GridLineType="Polygon">

    <!-- Configure additional chart elements -->
    <chart:SfPolarChart.Series>
        <chart:PolarLineSeries
            ItemsSource="{Binding PlantDetails}"
            XBindingPath="Direction"
            YBindingPath="Tree" Label="Tree">
        </chart:PolarLineSeries>

        <chart:PolarLineSeries
            ItemsSource="{Binding PlantDetails}"
            XBindingPath="Direction"
            YBindingPath="Weed"
            Label="Weed">
        </chart:PolarLineSeries>

        <chart:PolarLineSeries
            ItemsSource="{Binding PlantDetails}"
            XBindingPath="Direction"
            YBindingPath="Flower"
            Label="Flower">
        </chart:PolarLineSeries>
    </chart:SfPolarChart.Series>

</chart:SfPolarChart>
SfPolarChart chart = new SfPolarChart();
chart.GridLineType = PolarChartGridLineType.Polygon;
// Configure additional chart elements
PolarLineSeries series1 = new PolarLineSeries();
series1.XBindingPath = "Direction";
series1.YBindingPath = "Tree";
series1.ItemsSource = viewModel.PlantDetails;
PolarLineSeries series2 = new PolarLineSeries();
series2.XBindingPath = "Direction";
series2.YBindingPath = "Weed";
series2.ItemsSource = viewModel.PlantDetails;
PolarLineSeries series3 = new PolarLineSeries();
series3.XBindingPath = "Direction";
series3.YBindingPath = "Flower";
series3.ItemsSource = viewModel.PlantDetails;
this.Content = chart;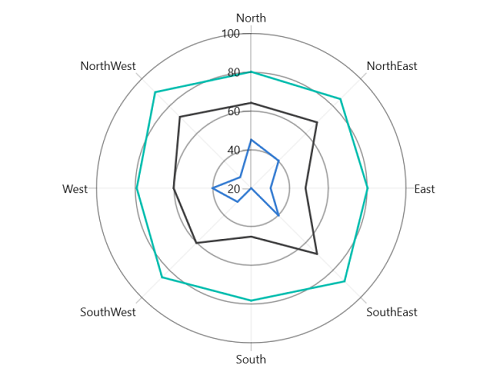
Custom PaletteBrushes
The SfPolarChart provides support to define your own brushes for the chart in the preferred order by using the PaletteBrushes property, as shown in the following code example.
<Grid>
    <Grid.Resources>
        <BrushCollection x:Key="customBrushes">
            <SolidColorBrush Color="#4dd0e1"/>
            <SolidColorBrush Color="#26c6da"/>
            <SolidColorBrush Color="#00bcd4"/>
            <SolidColorBrush Color="#00acc1"/>
            <SolidColorBrush Color="#0097a7"/>
            <SolidColorBrush Color="#00838f"/>
        </BrushCollection>
    </Grid.Resources>
    <chart:SfPolarChart x:Name="chart" PaletteBrushes="{StaticResource customBrushes}">

        <!-- Configure additional chart elements -->
    </chart:SfPolarChart>
</Grid>
SfPolarChart chart = new SfPolarChart();
// Configure additional chart elements
List<Brush> customBrushes = new List<Brush>();
customBrushes.Add(new SolidColorBrush(Color.FromArgb(255, 77, 208, 225)));
customBrushes.Add(new SolidColorBrush(Color.FromArgb(255, 38, 198, 218)));
customBrushes.Add(new SolidColorBrush(Color.FromArgb(255, 0, 188, 212)));
customBrushes.Add(new SolidColorBrush(Color.FromArgb(255, 0, 172, 193)));
customBrushes.Add(new SolidColorBrush(Color.FromArgb(255, 0, 151, 167)));
customBrushes.Add(new SolidColorBrush(Color.FromArgb(255, 0, 131, 143)));
chart.PaletteBrushes = customBrushes;
this.Content = chart;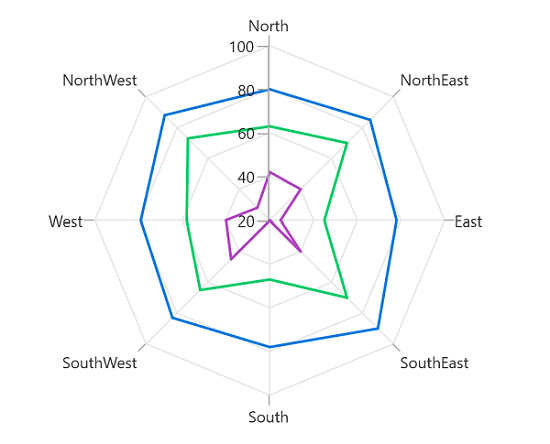
Applying Gradient
Gradient for the polar chart can be set by using the PaletteBrushes property of the polar chart with the help of the LinearGradientBrush or RadialGradientBrush.
<Grid>
    <Grid.Resources>
        <BrushCollection x:Key="customBrushes">
            <LinearGradientBrush>
                <GradientStop Offset="1" Color="#FFE7C7"/>
                <GradientStop Offset="0" Color="#FCB69F"/>
            </LinearGradientBrush>
            <LinearGradientBrush>
                <GradientStop Offset="1" Color="#fadd7d"/>
                <GradientStop Offset="0" Color="#fccc2d"/>
            </LinearGradientBrush>
            <LinearGradientBrush>
                <GradientStop Offset="1" Color="#DCFA97"/>
                <GradientStop Offset="0" Color="#96E6A1"/>
            </LinearGradientBrush>
        </BrushCollection>
    </Grid.Resources>

    <chart:SfPolarChart x:Name="chart" PaletteBrushes="{StaticResource customBrushes}">

    <!-- Configure additional chart elements -->
    </chart:SfPolarChart>
</Grid>
SfPolarChart chart = new SfPolarChart();
// Configure additional chart elements
List<Brush> customBrushes = new List<Brush>();
LinearGradientBrush gradientColor1 = new LinearGradientBrush();
GradientStop stop1 = new GradientStop()
{
Offset = 1,
Color = Color.FromArgb(255, 255, 231, 199)
};
GradientStop stop2 = new GradientStop()
{
Offset = 0,
Color = Color.FromArgb(255, 252, 182, 159)
};
gradientColor1.GradientStops.Add(stop1);
gradientColor1.GradientStops.Add(stop2);
LinearGradientBrush gradientColor2 = new LinearGradientBrush();
stop1 = new GradientStop()
{
Offset = 1,
Color = Color.FromArgb(255, 250, 221, 125)
};
stop2 = new GradientStop(){
Offset = 0,
Color = Color.FromArgb(255, 252, 204, 45)
};
gradientColor2.GradientStops.Add(stop1);
gradientColor2.GradientStops.Add(stop2);
customBrushes.Add(gradientColor1);
customBrushes.Add(gradientColor2);
chart.PaletteBrushes = customBrushes;
// Configure additional chart elements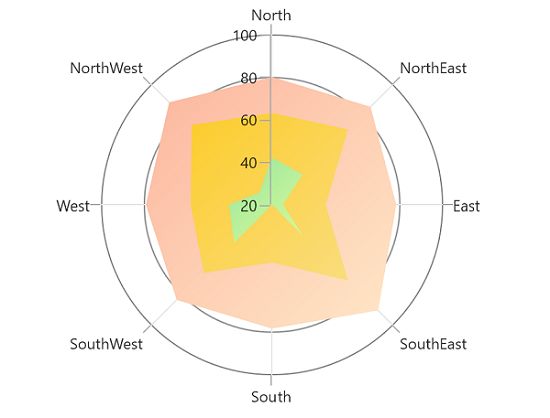
Gradient color using the Fill property of series with LinearGradientBrush.
<chart:SfPolarChart>

    <!-- Configure additional chart elements -->
    <chart:PolarAreaSeries
        ItemsSource="{Binding PlantDetails}"
        XBindingPath="Direction"
        YBindingPath="Tree" Label="Tree">
        <chart:PolarAreaSeries.Fill>
            <LinearGradientBrush>
                <GradientStop Offset="1" Color="#A8EAEE"/>
                <GradientStop Offset="0" Color="#7BB0F9"/>
            </LinearGradientBrush>
        </chart:PolarAreaSeries.Fill>
    </chart:PolarAreaSeries>

</chart:SfPolarChart>
SfPolarChart chart = new SfPolarChart();
// Configure additional chart elements
LinearGradientBrush gradientColor = new LinearGradientBrush();
GradientStop stop1 = new GradientStop()
{
Offset = 1,
Color = Color.FromArgb(255, 168, 234, 238)
};
GradientStop stop2 = new GradientStop()
{
Offset = 0,
Color = Color.FromArgb(255, 123, 176, 249)
};
gradientColor.GradientStops.Add(stop1);
gradientColor.GradientStops.Add(stop2);
PolarAreaSeries series = new PolarAreaSeries();
series.Fill = gradientColor;
// Configure additional chart elements