Getting Started with Vue Chart
This article provides a step-by-step guide to setting up a Vite project using JavaScript and integrating the Syncfusion® Vue Chart component with either the Composition API or the Options API.
The Composition API groups related logic into reusable functions and is recommended for larger, composition-friendly code bases. The Options API uses data, methods, and life cycle options and may be preferable for smaller components or teams familiar with Vue 2 patterns. Choose the API that best fits your project’s structure and long-term maintainability.
Prerequisites
- Node.js 24+ (LTS recommended).
- Syncfusion CLI.
Install the Syncfusion CLI
Install the Syncfusion CLI globally using the following command:
npm install -g @syncfusion/syncfusion-cliSet up the Vite project using Syncfusion CLI
You can create a Vue application with Vite using the Syncfusion CLI. The CLI provides two ways to create a project:
Non-interactive mode
Non-interactive mode allows you to create a project directly using a single command with the required command-line arguments.
sf new my-project --framework vue --template chartIn this mode, the project configuration is passed directly in the command. The above command creates a Vue application with Vite and configured it with the Syncfusion® Chart component. The generated project uses the TypeScript and the Composition API.
Interactive mode
Interactive mode guides you through the project creation process with step-by-step prompts.
sfWhen you run the sf command, the CLI prompts you to select the required project configuration options. To create a Vue application with Vite and the Syncfusion® Chart component, select the following options:
√ Project name? ... my-project
√ Choose Framework: » Vue
√ Choose Language: » JavaScript
√ Choose Template: » Chart
√ Choose Theme: » Material3
√ Choose Style Format: » CSS
√ Would you like to integrate the Syncfusion MCP Server (AI Assistant) into this project? ... no
√ Would you like to install Syncfusion Component Skills for AI-powered development? ... no
√ Install dependencies and start app now? ... no
The above selections generate a Vue application with Vite and configure it with the Syncfusion® Chart component. You can choose different values for language, theme, style format, MCP setup, and skills installation based on your project requirements.
The Syncfusion® CLI creates the project with a predefined template. After the project is generated, you can customize or replace the component code based on your application requirements.
Run the project
Once the project is created, navigate to the project directory and run the following commands in your terminal.
cd my-project
npm install
npm run dev
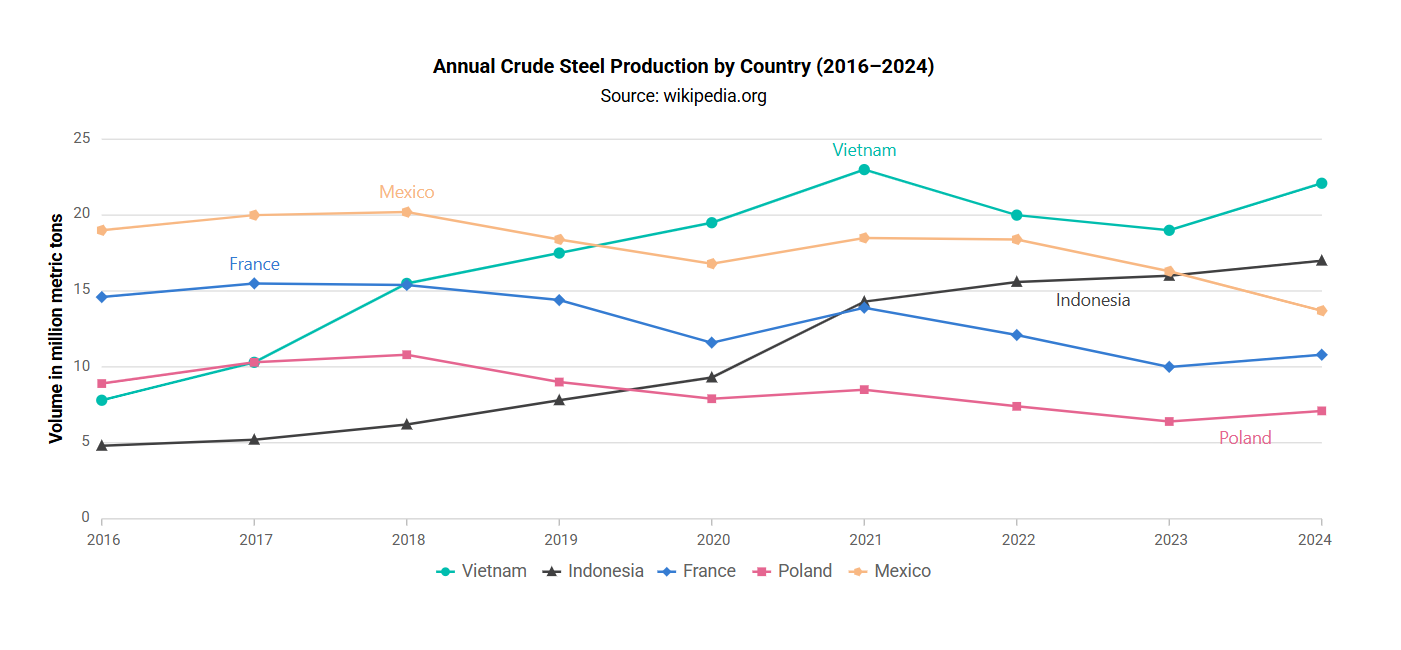
The output will appear as follows:
Prerequisites
Ensure your development environment meets the following requirements as listed in System requirements for Syncfusion® Vue UI components.
Set Up the Vite Project
Create a Vite project using either npm or Yarn.
npm
npm create vite@latest my-app -- --template vue
yarn
yarn create vite my-app --template vue
If Vite prompts you to install dependencies and start the project immediately, select No. The Syncfusion package is installed in a later step.
Navigate to the project directory:
cd my-app
Install the project dependencies using either npm or Yarn.
npm
npm install
yarn
yarn install
Now that my-project is ready, add Syncfusion® Vue components to the project.
Note: To create a TypeScript project, use
npm create vite@latest my-app -- --template vue-tsoryarn create vite my-app --template vue-ts.
Add Syncfusion® Vue Packages
Syncfusion® Vue component packages are available at npmjs.com. To use Syncfusion® Vue components in the project, install the corresponding npm package.
This article uses the Vue Chart component as an example. To use the Vue Chart component in the project, install the @syncfusion/ej2-vue-charts package using either npm or Yarn. The package is compatible with Vue 3.0 and later versions.
npm
npm install @syncfusion/ej2-vue-charts --save
yarn
yarn add @syncfusion/ej2-vue-charts
Note: For TypeScript support, refer to Getting Started with Vue UI Components using Composition API and TypeScript or Getting Started with Vue UI Components using Options API and TypeScript.
Add Syncfusion® Vue Chart Component
Follow the steps below to add the Vue Chart component using the Composition API or Options API:
Step 1: First, import and register the Chart component and its child directives in the script section of src/App.vue. If using the Composition API, add the setup attribute to the script tag.
<script setup>
import { ChartComponent as EjsChart, SeriesCollectionDirective as ESeriesCollection, SeriesDirective as ESeries, LineSeries, Category } from "@syncfusion/ej2-vue-charts";
</script><script>
import { ChartComponent, SeriesCollectionDirective, SeriesDirective, LineSeries, Category } from '@syncfusion/ej2-vue-charts';
// Register Chart component and its child directives
export default {
name: "App",
components: {
'ejs-chart' : ChartComponent,
'e-series-collection' : SeriesCollectionDirective,
'e-series' : SeriesDirective
}
}
</script>Step 2: Declare the values for the dataSource property in the script section.
<script setup>
let seriesData = [
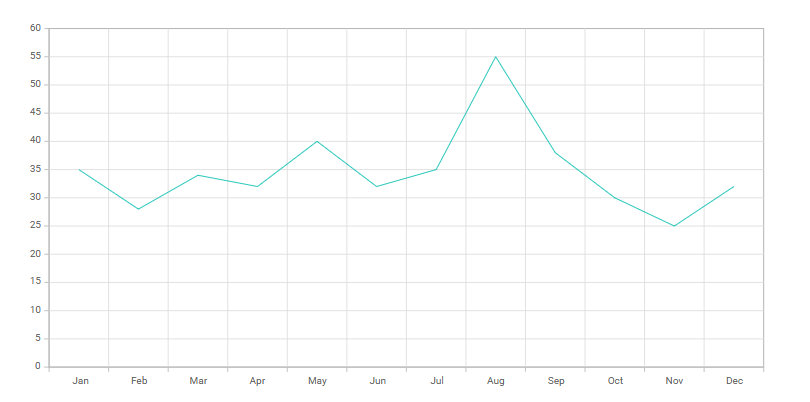
    { month: 'Jan', sales: 35 }, { month: 'Feb', sales: 28 },
    { month: 'Mar', sales: 34 }, { month: 'Apr', sales: 32 },
    { month: 'May', sales: 40 }, { month: 'Jun', sales: 32 },
    { month: 'Jul', sales: 35 }, { month: 'Aug', sales: 55 },
    { month: 'Sep', sales: 38 }, { month: 'Oct', sales: 30 },
    { month: 'Nov', sales: 25 }, { month: 'Dec', sales: 32 }
];
let primaryXAxis = { valueType: 'Category' };
</script><script>
data() {
return {
seriesData: [
{ month: 'Jan', sales: 35 }, { month: 'Feb', sales: 28 },
{ month: 'Mar', sales: 34 }, { month: 'Apr', sales: 32 },
{ month: 'May', sales: 40 }, { month: 'Jun', sales: 32 },
{ month: 'Jul', sales: 35 }, { month: 'Aug', sales: 55 },
{ month: 'Sep', sales: 38 }, { month: 'Oct', sales: 30 },
{ month: 'Nov', sales: 25 }, { month: 'Dec', sales: 32 }
],
primaryXAxis : { valueType: 'Category' }
};
}
</script>Step 3: In the template section, define the Chart component with the dataSource property.
<template>
<ejs-chart id="container" :primaryXAxis='primaryXAxis'>
    <e-series-collection>
        <e-series :dataSource='seriesData' type='Line' xName='month' yName='sales' name='Sales'></e-series>
    </e-series-collection>
</ejs-chart>
</template>
Here is the summarized code for the above steps in the src/App.vue file.
Note: The Composition API example uses an import alias for ChartComponent, while the Options API example uses ChartComponent directly. The names shown in each example match the corresponding imports.
<template>
  <ejs-chart id="container" :primaryXAxis='primaryXAxis'>
      <e-series-collection>
          <e-series :dataSource='seriesData' type='Line' xName='month' yName='sales' name='Sales'></e-series>
      </e-series-collection>
  </ejs-chart>
</template>
<script setup>
import { provide } from 'vue';
import { ChartComponent as EjsChart, SeriesCollectionDirective as ESeriesCollection, SeriesDirective as ESeries, LineSeries, Category } from "@syncfusion/ej2-vue-charts";

let seriesData = [
  { month: "Jan", sales: 35 }, { month: "Feb", sales: 28 },
  { month: "Mar", sales: 34 }, { month: "Apr", sales: 32 },
  { month: "May", sales: 40 }, { month: "Jun", sales: 32 },
  { month: "Jul", sales: 35 }, { month: "Aug", sales: 55 },
  { month: "Sep", sales: 38 }, { month: "Oct", sales: 30 },
  { month: "Nov", sales: 25 }, { month: "Dec", sales: 32 }
];
const primaryXAxis = {valueType: 'Category'};
const chart = [LineSeries, Category];
provide('chart', chart);
</script><template>
<ejs-chart id="container" :primaryXAxis="primaryXAxis">
<e-series-collection>
<e-series :dataSource="seriesData" type="Line" xName="month" yName="sales" name="Sales"></e-series>
</e-series-collection>
</ejs-chart>
</template>
<script>
import { ChartComponent, SeriesCollectionDirective, SeriesDirective, LineSeries, Category } from "@syncfusion/ej2-vue-charts";
export default {
name: "App",
components: {
'ejs-chart': ChartComponent,
'e-series-collection': SeriesCollectionDirective,
'e-series': SeriesDirective
},
data() {
return {
primaryXAxis: {
valueType: "Category"
},
seriesData: [
{ month: "Jan", sales: 35 }, { month: "Feb", sales: 28 },
{ month: "Mar", sales: 34 }, { month: "Apr", sales: 32 },
{ month: "May", sales: 40 }, { month: "Jun", sales: 32 },
{ month: "Jul", sales: 35 }, { month: "Aug", sales: 55 },
{ month: "Sep", sales: 38 }, { month: "Oct", sales: 30 },
{ month: "Nov", sales: 25 }, { month: "Dec", sales: 32 }
]
};
},
provide: {
chart: [LineSeries, Category]
}
};
</script>Run the Project
To run the project, use either npm or Yarn:
npm
npm run dev
yarn
yarn run dev
- Open the project URL shown in the terminal (usually
http://localhost:5173) and verify the chart displays.
The output will appear as follows:
Sample: You can explore the complete sample project in the
vue-3-chart-getting-startedrepository.
For migration information from Vue 2 to Vue 3, refer to the Vue 3 Migration Guide.
Troubleshooting
Chart not rendering:
- Ensure that the required chart modules (for example,
LineSeries,Category) are injected usingprovide()in the Composition API or theprovideoption in the Options API - Verify the
dataSourceis correctly assigned with proper field mappings - Check the browser console for any error messages
Module not found error:
- Confirm that the module is imported from
@syncfusion/ej2-vue-charts - Verify the module name is spelled correctly in the import statement and
provideoption
Incorrect package version:
- Verify that the installed
@syncfusion/ej2-vue-chartspackage is compatible with Vue 3.0 or later - Run
npm list @syncfusion/ej2-vue-chartsto check the installed version
Missing child directives:
- When using series directives, ensure that
SeriesCollectionDirectiveandSeriesDirectiveare imported and registered as shown in the examples - The component names must match the registration names in the template (e.g.,
e-series-collection,e-series)
Console errors:
- Check the browser console (F12 → Console tab) for import or runtime errors
- Verify that file paths and package installations are correct
- Ensure the development server is still running with
npm run dev
For additional assistance, refer to the Vue Charts API Documentation and the Feature Modules page.