Annotations in UWP Linear Gauge
The SfLinearGauge supports Annotations, which is used to mark the specific area of interest in the gauge area with texts, shapes, or images. You can add any number of annotations to the gauge.
Annotation
By using the ContentTemplate property of the annotation object, you can specify the new element that needs to be displayed in the gauge area.
<gauge:SfLinearGauge>
    <gauge:SfLinearGauge.Annotations>
        <gauge:LinearGaugeAnnotation OffsetX="0.5" OffsetY="0.4">
            <gauge:LinearGaugeAnnotation.ContentTemplate>
                <DataTemplate>
                    <TextBlock Text="CPU Utilization" Foreground="Black" Height="40" Width="120"/>
                </DataTemplate>
            </gauge:LinearGaugeAnnotation.ContentTemplate>
        </gauge:LinearGaugeAnnotation>
    </gauge:SfLinearGauge.Annotations>
    <gauge:SfLinearGauge.MainScale>
        <gauge:LinearScale MajorTickStroke="Gray" MajorTickSize="25"
                           MinorTickSize="15" LabelSize="15" MinorTickStroke="Gray" LabelStroke="#424242"
                           MinorTicksPerInterval="3" ScaleBarLength="300" />
    </gauge:SfLinearGauge.MainScale>
</gauge:SfLinearGauge>
SfLinearGauge linearGauge = new SfLinearGauge();
LinearGaugeAnnotation linearGaugeAnnotation = new LinearGaugeAnnotation();
linearGaugeAnnotation.OffsetX = 0.5;
linearGaugeAnnotation.OffsetY = 0.4;
var content = "<DataTemplate xmlns=\"http://schemas.microsoft.com/winfx/2006/xaml/presentation\">";
content += "<Grid>";
content += "<TextBlock Text=\"CPU Utilization\" Height=\"40\" Width=\"120\" Foreground=\"Black\">";
content += "</TextBlock>" + "</Grid>";
content += "</DataTemplate>";
linearGaugeAnnotation.ContentTemplate = (DataTemplate)XamlReader.Load(content);
linearGauge.Annotations.Add(linearGaugeAnnotation);
LinearScale linearScale = new LinearScale();
linearScale.ScaleBarLength = 300;
linearScale.ScaleBarStroke = new SolidColorBrush(Color.FromArgb(0xff, 0xe0, 0xe0, 0xe0));
linearScale.LabelStroke = new SolidColorBrush(Color.FromArgb(0xff, 0x42, 0x42, 0x42));
linearScale.LabelSize = 15;
linearScale.MajorTickSize = 25;
linearScale.MajorTickStroke = new SolidColorBrush(Colors.Gray);
linearScale.MinorTickStroke = new SolidColorBrush(Colors.Gray);
linearScale.MinorTickSize = 15;
linearGauge.MainScale = linearScale;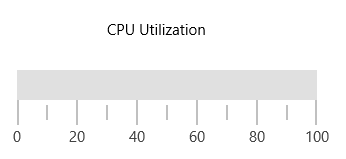
Positioning the annotation
You can place the annotation anywhere in the gauge area by using the OffsetX and OffsetY properties, or by using the ScaleValue property.
Change annotation position by using offset
You can position the annotation anywhere in the linear gauge by using the OffsetX and OffsetY properties. It ranges from 0 to 1.
<gauge:SfLinearGauge>
    <gauge:SfLinearGauge.Annotations>
        <gauge:LinearGaugeAnnotation OffsetX="0.5" OffsetY="0.6">
            <gauge:LinearGaugeAnnotation.ContentTemplate>
                <DataTemplate>
                    <TextBlock Text="CPU Utilization" Foreground="Black" Height="40" Width="120"/>
                </DataTemplate>
            </gauge:LinearGaugeAnnotation.ContentTemplate>
        </gauge:LinearGaugeAnnotation>
    </gauge:SfLinearGauge.Annotations>
    <gauge:SfLinearGauge.MainScale>
        <gauge:LinearScale MajorTickStroke="Gray" MajorTickSize="25"
                           MinorTickSize="15" LabelSize="15" MinorTickStroke="Gray" LabelStroke="#424242"
                           MinorTicksPerInterval="3" ScaleBarLength="300" />
    </gauge:SfLinearGauge.MainScale>
</gauge:SfLinearGauge>
SfLinearGauge linearGauge = new SfLinearGauge();
LinearGaugeAnnotation linearGaugeAnnotation = new LinearGaugeAnnotation();
linearGaugeAnnotation.OffsetX = 0.5;
linearGaugeAnnotation.OffsetY = 0.6;
var content = "<DataTemplate xmlns=\"http://schemas.microsoft.com/winfx/2006/xaml/presentation\">";
content += "<Grid>";
content += "<TextBlock Text=\"CPU Utilization\" Height=\"40\" Width=\"120\" Foreground=\"Black\">";
content += "</TextBlock>" + "</Grid>";
content += "</DataTemplate>";
linearGaugeAnnotation.ContentTemplate = (DataTemplate)XamlReader.Load(content);
linearGauge.Annotations.Add(linearGaugeAnnotation);
LinearScale linearScale = new LinearScale();
linearScale.ScaleBarLength = 300;
linearScale.ScaleBarStroke = new SolidColorBrush(Color.FromArgb(0xff, 0xe0, 0xe0, 0xe0));
linearScale.LabelStroke = new SolidColorBrush(Color.FromArgb(0xff, 0x42, 0x42, 0x42));
linearScale.LabelSize = 15;
linearScale.MajorTickSize = 25;
linearScale.MajorTickStroke = new SolidColorBrush(Colors.Gray);
linearScale.MinorTickStroke = new SolidColorBrush(Colors.Gray);
linearScale.MinorTickSize = 15;
linearGauge.MainScale = linearScale;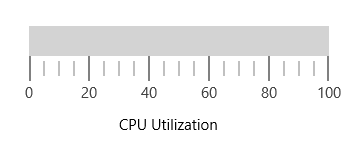
Change annotation position by using scale value
You can also place the annotation by specifying the ScaleValue property.
<gauge:SfLinearGauge>
    <gauge:SfLinearGauge.Annotations>
        <gauge:LinearGaugeAnnotation ScaleValue="60">
            <gauge:LinearGaugeAnnotation.ContentTemplate>
                <DataTemplate>
                    <TextBlock Text="60%" Foreground="Black" />
                </DataTemplate>
            </gauge:LinearGaugeAnnotation.ContentTemplate>
        </gauge:LinearGaugeAnnotation>
    </gauge:SfLinearGauge.Annotations>
    <gauge:SfLinearGauge.MainScale>
        <gauge:LinearScale Minimum="0" Maximum="90" ScaleBarSize="30" Interval="10"
                           MajorTickStroke="Gray" MajorTickSize="25"
                           MinorTickSize="15" LabelSize="15" MinorTickStroke="Gray" LabelStroke="#424242"
                           MinorTicksPerInterval="3" ScaleBarLength="300">
            <gauge:LinearScale.Pointers>
                <gauge:LinearPointer PointerType="BarPointer" Value="60" BarPointerStroke="#f95c85"
                                     BarPointerStrokeThickness="20" CornerRadius="0,10,10,0" />
            </gauge:LinearScale.Pointers>
        </gauge:LinearScale>
    </gauge:SfLinearGauge.MainScale>
</gauge:SfLinearGauge>
SfLinearGauge linearGauge = new SfLinearGauge();
LinearGaugeAnnotation linearGaugeAnnotation = new LinearGaugeAnnotation();
linearGaugeAnnotation.ScaleValue = 60;
var content = "<DataTemplate xmlns=\"http://schemas.microsoft.com/winfx/2006/xaml/presentation\">";
content += "<Grid>";
content += "<TextBlock Text=\"60%\" Foreground=\"Black\">";
content += "</TextBlock>" + "</Grid>";
content += "</DataTemplate>";
linearGaugeAnnotation.ContentTemplate = (DataTemplate)XamlReader.Load(content);
linearGauge.Annotations.Add(linearGaugeAnnotation);
LinearScale linearScale = new LinearScale();
linearScale.Minimum = 0;
linearScale.Maximum = 90;
linearScale.ScaleBarSize = 30;
linearScale.Interval = 10;
linearScale.ScaleBarLength = 300;
linearScale.ScaleBarStroke = new SolidColorBrush(Color.FromArgb(0xff, 0xe0, 0xe0, 0xe0));
linearScale.LabelStroke = new SolidColorBrush(Color.FromArgb(0xff, 0x42, 0x42, 0x42));
linearScale.LabelSize = 15;
linearScale.MajorTickSize = 25;
linearScale.MajorTickStroke = new SolidColorBrush(Colors.Gray);
linearScale.MinorTickStroke = new SolidColorBrush(Colors.Gray);
linearScale.MinorTickSize = 15;
LinearPointer linearPointer = new LinearPointer();
linearPointer.PointerType = LinearPointerType.BarPointer;
linearPointer.Value = 60;
linearPointer.BarPointerStrokeThickness = 20;
linearPointer.CornerRadius = new CornerRadius(0, 10, 10, 0);
linearPointer.BarPointerStroke = new SolidColorBrush(Color.FromArgb(0xff, 0xf9, 0x5c, 0x85));
linearScale.Pointers.Add(linearPointer);
linearGauge.MainScale = linearScale;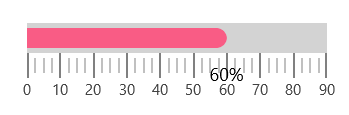
Set margin to the annotation
You can adjust the annotation by specifying the ViewMargin property in pixels, which adjusts the annotation element from its current position.
<gauge:SfLinearGauge>
    <gauge:SfLinearGauge.Annotations>
        <gauge:LinearGaugeAnnotation ScaleValue="60" ViewMargin="10,60">
            <gauge:LinearGaugeAnnotation.ContentTemplate>
                <DataTemplate>
                    <TextBlock Text="60%" Foreground="Black"/>
                </DataTemplate>
            </gauge:LinearGaugeAnnotation.ContentTemplate>
        </gauge:LinearGaugeAnnotation>
    </gauge:SfLinearGauge.Annotations>
    <gauge:SfLinearGauge.MainScale>
        <gauge:LinearScale Interval="10" Minimum="0" Maximum="90" ScaleBarSize="30"
                           MajorTickStroke="Gray" MajorTickSize="25"
                           MinorTickSize="15" LabelSize="15" MinorTickStroke="Gray" LabelStroke="#424242"
                           MinorTicksPerInterval="3" ScaleBarLength="300">
            <gauge:LinearScale.Pointers>
                <gauge:LinearPointer PointerType="BarPointer" Value="60" BarPointerStroke="#f95c85"
                                     BarPointerStrokeThickness="20" CornerRadius="0,10,10,0" />
            </gauge:LinearScale.Pointers>
        </gauge:LinearScale>
    </gauge:SfLinearGauge.MainScale>
</gauge:SfLinearGauge>
SfLinearGauge linearGauge = new SfLinearGauge();
LinearGaugeAnnotation linearGaugeAnnotation = new LinearGaugeAnnotation();
linearGaugeAnnotation.ScaleValue = 60;
linearGaugeAnnotation.ViewMargin = new Point(10, 60);
var content = "<DataTemplate xmlns=\"http://schemas.microsoft.com/winfx/2006/xaml/presentation\">";
content += "<Grid>";
content += "<TextBlock Text=\"60%\" Foreground=\"Black\">";
content += "</TextBlock>" + "</Grid>";
content += "</DataTemplate>";
linearGaugeAnnotation.ContentTemplate = (DataTemplate)XamlReader.Load(content);
linearGauge.Annotations.Add(linearGaugeAnnotation);
LinearScale linearScale = new LinearScale();
linearScale.Minimum = 0;
linearScale.Maximum = 90;
linearScale.ScaleBarSize = 30;
linearScale.Interval = 10;
linearScale.ScaleBarLength = 300;
linearScale.ScaleBarStroke = new SolidColorBrush(Color.FromArgb(0xff, 0xe0, 0xe0, 0xe0));
linearScale.LabelStroke = new SolidColorBrush(Color.FromArgb(0xff, 0x42, 0x42, 0x42));
linearScale.LabelSize = 15;
linearScale.MajorTickSize = 25;
linearScale.MajorTickStroke = new SolidColorBrush(Colors.Gray);
linearScale.MinorTickStroke = new SolidColorBrush(Colors.Gray);
linearScale.MinorTickSize = 15;
LinearPointer linearPointer = new LinearPointer();
linearPointer.PointerType = LinearPointerType.BarPointer;
linearPointer.Value = 60;
linearPointer.BarPointerStrokeThickness = 20;
linearPointer.CornerRadius = new CornerRadius(0, 10, 10, 0);
linearPointer.BarPointerStroke = new SolidColorBrush(Color.FromArgb(0xff, 0xf9, 0x5c, 0x85));
linearScale.Pointers.Add(linearPointer);
linearGauge.MainScale = linearScale;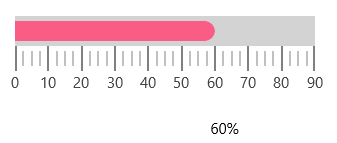
Alignment of annotation
You can align the annotation using the HorizontalPosition and VerticalPosition properties.
Setting horizontal position
<gauge:SfLinearGauge>
    <gauge:SfLinearGauge.Annotations>
        <gauge:LinearGaugeAnnotation ScaleValue="60" HorizontalPosition="Start">
            <gauge:LinearGaugeAnnotation.ContentTemplate>
                <DataTemplate>
                    <TextBlock Text="CPU Utilization" Foreground="Black"/>
                </DataTemplate>
            </gauge:LinearGaugeAnnotation.ContentTemplate>
        </gauge:LinearGaugeAnnotation>
    </gauge:SfLinearGauge.Annotations>
    <gauge:SfLinearGauge.MainScale>
        <gauge:LinearScale Interval="10" Minimum="0" Maximum="90" ScaleBarSize="30"
                           MajorTickStroke="Gray" MajorTickSize="25"
                           MinorTickSize="15" LabelSize="15" MinorTickStroke="Gray" LabelStroke="#424242"
                           MinorTicksPerInterval="3" ScaleBarLength="300">
            <gauge:LinearScale.Pointers>
                <gauge:LinearPointer PointerType="BarPointer" Value="60" BarPointerStroke="#f95c85"
                                     BarPointerStrokeThickness="20" CornerRadius="0,10,10,0" />
            </gauge:LinearScale.Pointers>
        </gauge:LinearScale>
    </gauge:SfLinearGauge.MainScale>
</gauge:SfLinearGauge>
SfLinearGauge linearGauge = new SfLinearGauge();
LinearGaugeAnnotation linearGaugeAnnotation = new LinearGaugeAnnotation();
linearGaugeAnnotation.ScaleValue = 60;
linearGaugeAnnotation.HorizontalPosition = ViewAlignment.Start;
var content = "<DataTemplate xmlns=\"http://schemas.microsoft.com/winfx/2006/xaml/presentation\">";
content += "<Grid>";
content += "<TextBlock Text=\"CPU Utilization\" Foreground=\"Black\">";
content += "</TextBlock>" + "</Grid>";
content += "</DataTemplate>";
linearGaugeAnnotation.ContentTemplate = (DataTemplate)XamlReader.Load(content);
linearGauge.Annotations.Add(linearGaugeAnnotation);
LinearScale linearScale = new LinearScale();
linearScale.ScaleBarLength = 300;
linearScale.Minimum = 0;
linearScale.Maximum = 90;
linearScale.ScaleBarSize = 30;
linearScale.Interval = 10;
linearScale.ScaleBarStroke = new SolidColorBrush(Color.FromArgb(0xff, 0xe0, 0xe0, 0xe0));
linearScale.LabelStroke = new SolidColorBrush(Color.FromArgb(0xff, 0x42, 0x42, 0x42));
linearScale.LabelSize = 15;
linearScale.MajorTickSize = 25;
linearScale.MajorTickStroke = new SolidColorBrush(Colors.Gray);
linearScale.MinorTickStroke = new SolidColorBrush(Colors.Gray);
linearScale.MinorTickSize = 15;
LinearPointer linearPointer = new LinearPointer();
linearPointer.PointerType = LinearPointerType.BarPointer;
linearPointer.Value = 60;
linearPointer.BarPointerStrokeThickness = 20;
linearPointer.CornerRadius = new CornerRadius(0, 10, 10, 0);
linearPointer.BarPointerStroke = new SolidColorBrush(Color.FromArgb(0xff, 0xf9, 0x5c, 0x85));
linearScale.Pointers.Add(linearPointer);
linearGauge.MainScale = linearScale;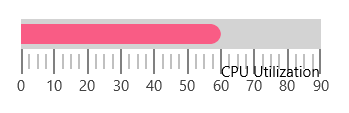
Setting vertical position
<gauge:SfLinearGauge>
    <gauge:SfLinearGauge.Annotations>
        <gauge:LinearGaugeAnnotation ScaleValue="60" VerticalPosition="Center">
            <gauge:LinearGaugeAnnotation.ContentTemplate>
                <DataTemplate>
                    <TextBlock Text="CPU Utilization" Foreground="Black"/>
                </DataTemplate>
            </gauge:LinearGaugeAnnotation.ContentTemplate>
        </gauge:LinearGaugeAnnotation>
    </gauge:SfLinearGauge.Annotations>
    <gauge:SfLinearGauge.MainScale>
        <gauge:LinearScale Interval="10" Minimum="0" Maximum="90" ScaleBarSize="30"
                           MajorTickStroke="Gray" MajorTickSize="25"
                           MinorTickSize="15" LabelSize="15" MinorTickStroke="Gray" LabelStroke="#424242"
                           MinorTicksPerInterval="3" ScaleBarLength="300">
            <gauge:LinearScale.Pointers>
                <gauge:LinearPointer PointerType="BarPointer" Value="60" BarPointerStroke="#f95c85"
                                     BarPointerStrokeThickness="20" CornerRadius="0,10,10,0" />
            </gauge:LinearScale.Pointers>
        </gauge:LinearScale>
    </gauge:SfLinearGauge.MainScale>
</gauge:SfLinearGauge>
SfLinearGauge linearGauge = new SfLinearGauge();
LinearGaugeAnnotation linearGaugeAnnotation = new LinearGaugeAnnotation();
linearGaugeAnnotation.ScaleValue = 60;
linearGaugeAnnotation.VerticalPosition = ViewAlignment.Center;
var content = "<DataTemplate xmlns=\"http://schemas.microsoft.com/winfx/2006/xaml/presentation\">";
content += "<Grid>";
content += "<TextBlock Text=\"CPU Utilization\" Foreground=\"Black\">";
content += "</TextBlock>" + "</Grid>";
content += "</DataTemplate>";
linearGaugeAnnotation.ContentTemplate = (DataTemplate)XamlReader.Load(content);
linearGauge.Annotations.Add(linearGaugeAnnotation);
LinearScale linearScale = new LinearScale();
linearScale.Minimum = 0;
linearScale.Maximum = 90;
linearScale.ScaleBarSize = 30;
linearScale.Interval = 10;
linearScale.ScaleBarLength = 300;
linearScale.ScaleBarStroke = new SolidColorBrush(Color.FromArgb(0xff, 0xe0, 0xe0, 0xe0));
linearScale.LabelStroke = new SolidColorBrush(Color.FromArgb(0xff, 0x42, 0x42, 0x42));
linearScale.LabelSize = 15;
linearScale.MajorTickSize = 25;
linearScale.MajorTickStroke = new SolidColorBrush(Colors.Gray);
linearScale.MinorTickStroke = new SolidColorBrush(Colors.Gray);
linearScale.MinorTickSize = 15;
LinearPointer linearPointer = new LinearPointer();
linearPointer.PointerType = LinearPointerType.BarPointer;
linearPointer.Value = 60;
linearPointer.BarPointerStrokeThickness = 20;
linearPointer.CornerRadius = new CornerRadius(0, 10, 10, 0);
linearPointer.BarPointerStroke = new SolidColorBrush(Color.FromArgb(0xff, 0xf9, 0x5c, 0x85));
linearScale.Pointers.Add(linearPointer);
linearGauge.MainScale = linearScale;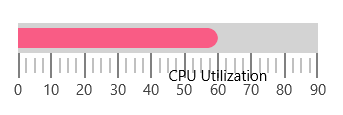
Multiple annotations
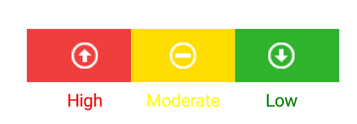
You can add multiple annotations to the gauge as demonstrated below.
<gauge:SfLinearGauge>
    <gauge:SfLinearGauge.Annotations>
        <gauge:LinearGaugeAnnotation ScaleValue="15" ViewMargin="0,30">
            <gauge:LinearGaugeAnnotation.ContentTemplate>
                <DataTemplate>
                    <Image Source="Low.png" Height="30" Width="30"/>
                </DataTemplate>
            </gauge:LinearGaugeAnnotation.ContentTemplate>
        </gauge:LinearGaugeAnnotation>
        <gauge:LinearGaugeAnnotation ScaleValue="45" ViewMargin="0,30">
            <gauge:LinearGaugeAnnotation.ContentTemplate>
                <DataTemplate>
                    <Image Source="Moderate.png" Height="30" Width="30"/>
                </DataTemplate>
            </gauge:LinearGaugeAnnotation.ContentTemplate>
        </gauge:LinearGaugeAnnotation>
        <gauge:LinearGaugeAnnotation ScaleValue="75" ViewMargin="0,30">
            <gauge:LinearGaugeAnnotation.ContentTemplate>
                <DataTemplate>
                    <Image Source="High.png" Height="30" Width="30"/>
                </DataTemplate>
            </gauge:LinearGaugeAnnotation.ContentTemplate>
        </gauge:LinearGaugeAnnotation>
        <gauge:LinearGaugeAnnotation ScaleValue="10" ViewMargin="0,80">
            <gauge:LinearGaugeAnnotation.ContentTemplate>
                <DataTemplate>
                    <TextBlock Text="Low" Foreground="#30b32d" FontSize="18" />
                </DataTemplate>
            </gauge:LinearGaugeAnnotation.ContentTemplate>
        </gauge:LinearGaugeAnnotation>
        <gauge:LinearGaugeAnnotation ScaleValue="40" ViewMargin="0,80">
            <gauge:LinearGaugeAnnotation.ContentTemplate>
                <DataTemplate>
                    <TextBlock Text="Moderate" Foreground="#ffdd00" FontSize="18" />
                </DataTemplate>
            </gauge:LinearGaugeAnnotation.ContentTemplate>
        </gauge:LinearGaugeAnnotation>
        <gauge:LinearGaugeAnnotation ScaleValue="70" ViewMargin="0,80">
            <gauge:LinearGaugeAnnotation.ContentTemplate>
                <DataTemplate>
                    <TextBlock Text="High" Foreground="#f03e3e" FontSize="18" />
                </DataTemplate>
            </gauge:LinearGaugeAnnotation.ContentTemplate>
        </gauge:LinearGaugeAnnotation>
    </gauge:SfLinearGauge.Annotations>
    <gauge:SfLinearGauge.MainScale>
        <gauge:LinearScale Minimum="0" Maximum="90" ShowLabels="False" ScaleBarStroke="Transparent"
                           ShowTicks="False" ScaleBarSize="13" ScaleDirection="Backward"
                           MinorTicksPerInterval="1" ScaleBarLength="300">
            <gauge:LinearScale.Ranges>
                <gauge:LinearRange StartValue="0" RangeStroke="#30b32d" EndValue="30" StartWidth="60" EndWidth="60" />
                <gauge:LinearRange StartValue="30" RangeStroke="#ffdd00" EndValue="60" StartWidth="60" EndWidth="60" />
                <gauge:LinearRange StartValue="60" RangeStroke="#f03e3e" EndValue="90" StartWidth="60" EndWidth="60" />
            </gauge:LinearScale.Ranges>
            <gauge:LinearScale.Pointers>
                <gauge:LinearPointer PointerType="SymbolPointer" Value="35" SymbolPointerStyle="InvertedTriangle"
                                     SymbolPointerStroke="Red" SymbolPointerHeight="20" SymbolPointerWidth="20" />
            </gauge:LinearScale.Pointers>
        </gauge:LinearScale>
    </gauge:SfLinearGauge.MainScale>
</gauge:SfLinearGauge>
SfLinearGauge linearGauge = new SfLinearGauge();
LinearGaugeAnnotation linearGaugeAnnotation = new LinearGaugeAnnotation();
linearGaugeAnnotation.ScaleValue = 75;
linearGaugeAnnotation.ViewMargin = new Point(0, 30);
var content = "<DataTemplate xmlns=\"http://schemas.microsoft.com/winfx/2006/xaml/presentation\">";
content += "<Grid>";
content += "<Image Height=\"30\" Width=\"30\" >";
content += "<Image.Source>";
content += "<BitmapImage UriSource=\"ms-appx:///" + "High.png" + "\"/>";
content += "</Image.Source>" + "</Image>" + "</Grid>";
content += "</DataTemplate>";
linearGaugeAnnotation.ContentTemplate = (DataTemplate)XamlReader.Load(content);
linearGauge.Annotations.Add(linearGaugeAnnotation);
LinearGaugeAnnotation linearGaugeAnnotation1 = new LinearGaugeAnnotation();
linearGaugeAnnotation1.ScaleValue = 45;
linearGaugeAnnotation1.ViewMargin = new Point(0, 30);
var content1 = "<DataTemplate xmlns=\"http://schemas.microsoft.com/winfx/2006/xaml/presentation\">";
content1 += "<Grid>";
content1 += "<Image Height=\"30\" Width=\"30\" >";
content1 += "<Image.Source>";
content1 += "<BitmapImage UriSource=\"ms-appx:///" + "Moderate.png" + "\"/>";
content1 += "</Image.Source>" + "</Image>" + "</Grid>";
content1 += "</DataTemplate>";
linearGaugeAnnotation1.ContentTemplate = (DataTemplate)XamlReader.Load(content1);
linearGauge.Annotations.Add(linearGaugeAnnotation1);
LinearGaugeAnnotation linearGaugeAnnotation2 = new LinearGaugeAnnotation();
linearGaugeAnnotation2.ScaleValue = 15;
linearGaugeAnnotation2.ViewMargin = new Point(0, 30);
var content2 = "<DataTemplate xmlns=\"http://schemas.microsoft.com/winfx/2006/xaml/presentation\">";
content2 += "<Grid>";
content2 += "<Image Height=\"30\" Width=\"30\" >";
content2 += "<Image.Source>";
content2 += "<BitmapImage UriSource=\"ms-appx:///" + "Low.png" + "\"/>";
content2 += "</Image.Source>" + "</Image>" + "</Grid>";
content2 += "</DataTemplate>";
linearGaugeAnnotation2.ContentTemplate = (DataTemplate)XamlReader.Load(content2);
linearGauge.Annotations.Add(linearGaugeAnnotation2);
LinearGaugeAnnotation linearGaugeAnnotation3 = new LinearGaugeAnnotation();
linearGaugeAnnotation3.ScaleValue = 70;
linearGaugeAnnotation3.ViewMargin = new Point(0, 80);
var content3 = "<DataTemplate xmlns=\"http://schemas.microsoft.com/winfx/2006/xaml/presentation\">";
content3 += "<Grid>";
content3 += "<TextBlock Text=\"High\" Height=\"40\" Width=\"120\" FontSize=\"18\" Foreground=\"Red\">";
content3 += "</TextBlock>" + "</Grid>";
content3 += "</DataTemplate>";
linearGaugeAnnotation3.ContentTemplate = (DataTemplate)XamlReader.Load(content3);
linearGauge.Annotations.Add(linearGaugeAnnotation3);
LinearGaugeAnnotation linearGaugeAnnotation4 = new LinearGaugeAnnotation();
linearGaugeAnnotation4.ScaleValue = 40;
linearGaugeAnnotation4.ViewMargin = new Point(0, 80);
var content4 = "<DataTemplate xmlns=\"http://schemas.microsoft.com/winfx/2006/xaml/presentation\">";
content4 += "<Grid>";
content4 += "<TextBlock Text=\"Moderate\" FontSize=\"18\" Foreground=\"Yellow\">";
content4 += "</TextBlock>" + "</Grid>";
content4 += "</DataTemplate>";
linearGaugeAnnotation4.ContentTemplate = (DataTemplate)XamlReader.Load(content4);
linearGauge.Annotations.Add(linearGaugeAnnotation4);
LinearGaugeAnnotation linearGaugeAnnotation5 = new LinearGaugeAnnotation();
linearGaugeAnnotation5.ScaleValue = 10;
linearGaugeAnnotation5.ViewMargin = new Point(0, 80);
var content5 = "<DataTemplate xmlns=\"http://schemas.microsoft.com/winfx/2006/xaml/presentation\">";
content5 += "<Grid>";
content5 += "<TextBlock Text=\"Low\" FontSize=\"18\" Foreground=\"Green\">";
content5 += "</TextBlock>" + "</Grid>";
content5 += "</DataTemplate>";
linearGaugeAnnotation5.ContentTemplate = (DataTemplate)XamlReader.Load(content5);
linearGauge.Annotations.Add(linearGaugeAnnotation5);
LinearScale linearScale = new LinearScale();
linearScale.Minimum = 0;
linearScale.Maximum = 90;
linearScale.ScaleBarSize = 30;
linearScale.Interval = 10;
linearScale.ShowLabels = false;
linearScale.ScaleBarStroke = new SolidColorBrush(Colors.Transparent);
linearScale.MinorTicksPerInterval = 1;
linearScale.ScaleBarLength = 300;
linearScale.ShowTicks = false;
linearScale.ScaleDirection = LinearScaleDirection.Backward;
linearGauge.MainScale = linearScale;
LinearRange linearRange = new LinearRange();
linearRange.StartValue = 0;
linearRange.RangeStroke = new SolidColorBrush(Color.FromArgb(0xff, 0x30, 0xb3, 0x2d));
linearRange.EndValue = 30;
linearRange.StartWidth = 60;
linearRange.EndWidth = 60;
linearScale.Ranges.Add(linearRange);
LinearRange linearRange1 = new LinearRange();
linearRange1.StartValue = 30;
linearRange1.RangeStroke = new SolidColorBrush(Color.FromArgb(0xff, 0xff, 0xdd, 0x00));
linearRange1.EndValue = 60;
linearRange1.StartWidth = 60;
linearRange1.EndWidth = 60;
linearScale.Ranges.Add(linearRange1);
LinearRange linearRange2 = new LinearRange();
linearRange2.StartValue = 60;
linearRange2.RangeStroke = new SolidColorBrush(Color.FromArgb(0xff, 0xf0, 0x3e, 0x3e));
linearRange2.EndValue = 90;
linearRange2.StartWidth = 60;
linearRange2.EndWidth = 60;
linearScale.Ranges.Add(linearRange2);