About Syncfusion® UWP HeatMap Control
Essential® HeatMap UWP visualizes tabular data by representing values with gradient colors instead of numeric text. Lower and higher values are displayed using different colors with varying gradients.
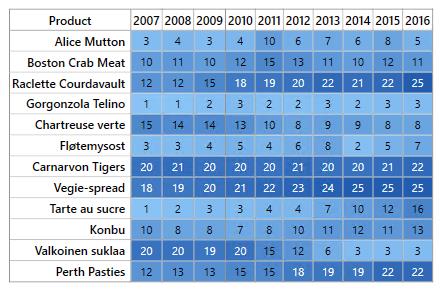
Key features:
- Two types of data source mapping: TableMapping and CellMapping
- Color mapping
- Legend
- Virtualization