Color Mapping in UWP HeatMap
Color mapping is used to represent values with colors instead of displaying the actual numerical values. For example, when a HeatMap displays data ranging from 0 to 100. ColorMapping defines colors for the minimum and maximum values, and intermediate values are represented with corresponding colors.
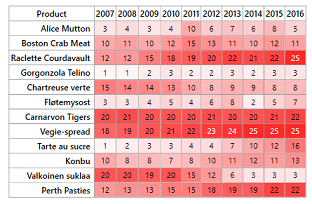
In color mapping, the value 0 is assigned the color white, and the value 30 is assigned the color red, as shown below.
<syncfusion:ColorMappingCollection x:Key="colorMapping">
	<syncfusion:ColorMapping Value="0" Color="White"/>
	<syncfusion:ColorMapping Value="30" Color="Red"/>
</syncfusion:ColorMappingCollection>
The resulting HeatMap will appear as shown below.