Getting started with Typescript Stock Chart control
This document explains how to create a simple Stock Chart and configure its features in TypeScript using the Essential JS 2 webpack quickstart seed repository.
This application is integrated with the
webpack.config.jsconfiguration and uses the latest version of the webpack-cli. It requires nodev14.15.0or higher. For more information about webpack and its features, refer to the webpack getting-started guide.
Prerequisites
Before you begin, ensure you have the following installed on your machine:
- Node.js (v14.15.0 or higher)
- Visual Studio Code (or any text editor)
- Git for cloning the quickstart repository
- A modern web browser (Chrome, Edge, Firefox, or Safari) to view the result
Dependencies
Below is the list of dependencies required to use the Stock Chart.
|-- @syncfusion/ej2-charts
    |-- @syncfusion/ej2-base
    |-- @syncfusion/ej2-data
    |-- @syncfusion/ej2-pdf-export
    |-- @syncfusion/ej2-file-utils
    |-- @syncfusion/ej2-compression
    |-- @syncfusion/ej2-svg-base
    |-- @syncfusion/ej2-navigations
    |-- @syncfusion/ej2-calendars
    |-- @syncfusion/ej2-popups
    |-- @syncfusion/ej2-lists
    |-- @syncfusion/ej2-inputs
    |-- @syncfusion/ej2-buttons
    |-- @syncfusion/ej2-splitbuttons
Note: Some dependencies like @syncfusion/ej2-navigations, @syncfusion/ej2-calendars, and others are used for advanced Stock Chart features like date-time navigation and tooltips.
Quick Setup
Step 1: Create a Project Folder
Create a folder named my-stock-chart in your desired location. This folder will contain your Syncfusion Stock Chart TypeScript project.
Step 2: Open Command Prompt
Open the command prompt and navigate to your desired directory where you want to create the project. You can do this by:
-
For Windows: Open Command Prompt (cmd) or PowerShell and use
cdcommand to navigate to your desired directory -
For macOS/Linux: Open Terminal and use
cdcommand to navigate to your desired directory
Step 3: Clone the Quickstart Repository
Run the following command to clone the Syncfusion JavaScript (Essential JS 2) quickstart project from GitHub.
git clone https://github.com/SyncfusionExamples/ej2-quickstart-webpack ej2-quickstartStep 4: Navigate to Project Folder
After cloning the application in the ej2-quickstart folder, run the following command to navigate to the project directory.
cd ej2-quickstartStep 5: Install Required Packages
Syncfusion JavaScript (Essential JS 2) packages are available on the npmjs.com public registry. You can install all Syncfusion JavaScript (Essential JS 2) controls in a single @syncfusion/ej2 package or individual packages for each control.
The quickstart application is already preconfigured with the dependent @syncfusion/ej2 package in the ~/package.json file. Use the following command to install all the dependent npm packages from the command prompt:
npm installThis command will download and install all necessary dependencies for your project.
Step 6: Import Syncfusion® CSS Styles
Syncfusion® JavaScript Stock Chart controls provide built-in themes, which are available from the npm theme packages. Additionally, themes can be loaded via CDN or customized using the Theme Studio. For more information, refer to the themes documentation.
The quickstart application is preconfigured to use the Fluent2 theme. To install the Fluent2 theme package, use the following command. Make sure the installed theme version matches the ej2-charts version declared in package.json.
npm install @syncfusion/ej2-fluent2-theme --saveThen add the following CSS reference to the src/styles/styles.css file:
@import "../../node_modules/@syncfusion/ej2-fluent2-theme/styles/stock-chart/index.css";Step 7: Update the HTML Template
Open the ej2-quickstart folder in Visual Studio Code or any text editor of your choice.
Locate the ~/src/index.html file in the project. Preserve any existing <link> and <script> tags that were generated by the seed, and add the HTML div tag with its id attribute as element inside <body> to initialize the Stock Chart container.
<!DOCTYPE html>
<html lang="en">

<head>
    <title>Essential JS 2 Stock Chart</title>
    <meta charset="utf-8" />
    <meta name="viewport" content="width=device-width, initial-scale=1.0" />
    <meta name="description" content="TypeScript UI Controls" />
    <meta name="author" content="Syncfusion" />
    <!-- existing head content from the seed template remains here -->
</head>

<body>
     <h1>Syncfusion Stock Chart</h1>
     <!--container which is going to render the Stock Chart-->
     <div id='element'>
     </div>
</body>

</html>
Step 8: Create the Stock Chart Component with Data
Locate the src/app/app.ts file in your project and add the Stock Chart component with module injection and sample data.
Module Injection: The Stock Chart component requires specific feature modules to be injected. For displaying stock data with a candle series and DateTime axis, we need to inject the CandleSeries and DateTime modules.
Populate Stock Chart with Data: Create sample JSON data with OHLC (Open, High, Low, Close) values and configure the chart series to display candlestick visualization of stock prices over time.
import { StockChart, CandleSeries, DateTime } from '@syncfusion/ej2-charts';

// Inject required modules
StockChart.Inject(CandleSeries, DateTime);

let chartData: Object[] = [
  { x: new Date('2012-04-02'), open: 320.71, high: 324.07, low: 317.74, close: 323.78, volume: 45638000 },
  { x: new Date('2012-04-03'), open: 323.03, high: 324.30, low: 319.64, close: 321.63, volume: 40857000 },
  { x: new Date('2012-04-04'), open: 319.54, high: 319.82, low: 315.87, close: 317.89, volume: 32519000 },
  { x: new Date('2012-04-05'), open: 316.44, high: 318.53, low: 314.60, close: 316.48, volume: 46327000 },
  { x: new Date('2012-04-06'), open: 317.20, high: 320.50, low: 315.30, close: 319.80, volume: 38200000 },
  { x: new Date('2012-04-07'), open: 320.00, high: 322.90, low: 318.50, close: 321.10, volume: 35500000 },
  { x: new Date('2012-04-08'), open: 321.50, high: 325.20, low: 320.80, close: 324.70, volume: 41200000 },
  { x: new Date('2012-04-09'), open: 325.00, high: 326.80, low: 322.40, close: 323.90, volume: 39800000 },
  { x: new Date('2012-04-10'), open: 324.20, high: 327.00, low: 323.10, close: 326.10, volume: 42100000 },
  { x: new Date('2012-04-11'), open: 326.30, high: 329.20, low: 325.50, close: 328.70, volume: 44500000 },
  { x: new Date('2012-04-12'), open: 328.90, high: 330.50, low: 326.70, close: 327.80, volume: 36700000 }
];

let stockchart: StockChart = new StockChart({
    series:[{
        dataSource: chartData,
        type: 'Candle',   // Series type: renders OHLC as candlesticks
        xName: 'x',       // Field mapped to the x-axis (date)
        open: 'open',     // Field mapped to the open price
        high: 'high',     // Field mapped to the high price
        low: 'low',       // Field mapped to the low price
        close: 'close'    // Field mapped to the close price
    }]
});
stockchart.appendTo("#element");
Series Property Reference
| Property | Description |
|---|---|
dataSource |
The data array used to render the chart |
type |
The series type. For Stock Chart, use 'Candle', 'OHLC', 'Line', 'Area', or 'Column'
|
xName |
The field in the data source that maps to the x-axis (typically a date) |
open |
The field in the data source that maps to the open price |
high |
The field in the data source that maps to the high price |
low |
The field in the data source that maps to the low price |
close |
The field in the data source that maps to the close price |
Tip: To add a volume pane below the price chart, append a second series to the
seriesarray withtype: 'Column'and bind its data source to avolumefield.
Step 9: Run the Application
Open the integrated terminal in Visual Studio Code or use your command prompt to run the application. Use the npm run start command:
npm run startThe application will compile and automatically start in your default web browser. The application typically runs at http://localhost:4000. You should see the Syncfusion® Stock Chart control displayed on the page. To stop the dev server, press Ctrl+C in the terminal. For a production build, use npm run build.
Step 10: View Your Stock Chart
Wait for the webpack dev server to complete the build process. Once completed, you will see the Stock Chart control rendering in your browser with candlestick data visualization. The chart is now successfully initialized and ready for further customization.
Output
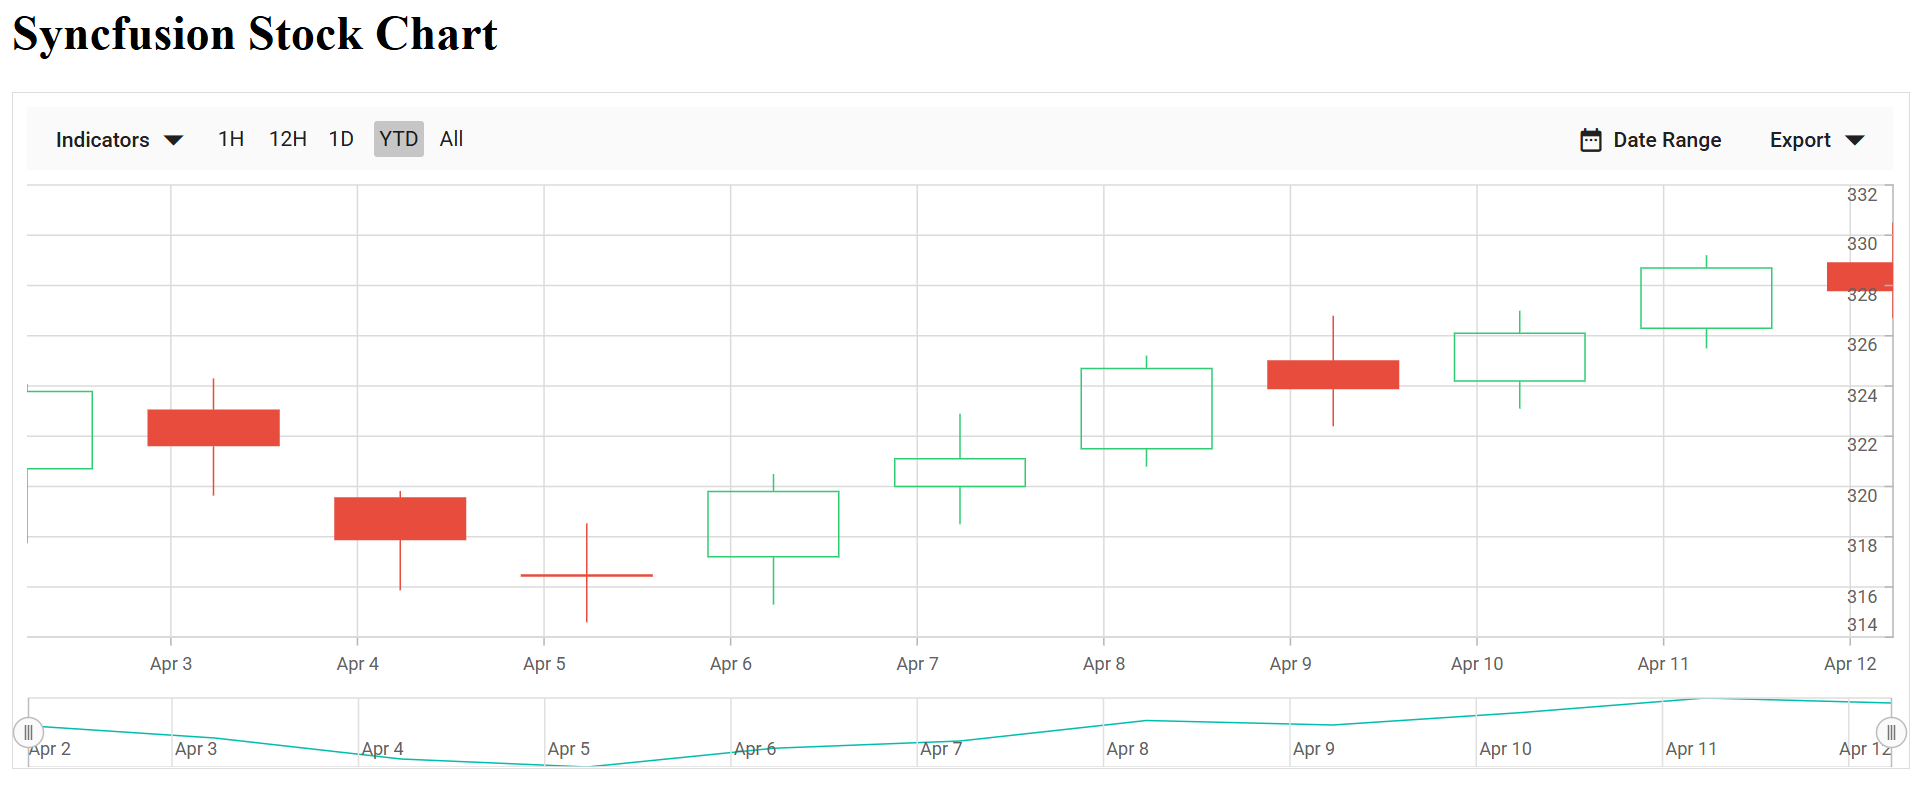
The following screenshot shows the output of the Syncfusion Stock Chart quick start application — a candle series rendering the sample OHLC data with date values on the x-axis and price values on the y-axis.
Troubleshooting
-
Blank page, no chart — The CDN script or npm package failed to load. Verify the network tab and that
npm installfinished successfully. -
Cannot find module '@syncfusion/ej2-charts'— Dependencies were not installed. Re-runnpm install. -
ej.charts is undefined—ej2-chartsis not imported into the bundle. Check that the import inapp.tsmatches the example and that the seed’s webpack config picks upsrc/app/app.ts. -
Chart renders without data — Mismatched field names between
dataSourceand series props. EnsurexName,open,high,low, andclosematch the data keys exactly. -
TypeScript compile errors after
npm install— Runnpm run buildto see the full error; common causes are mismatchedej2-chartsand theme package versions.