Getting started with TypeScript 3D Charts
This document explains how to create a simple 3D Chart and configure its features in TypeScript using the Essential JS 2 webpack quickstart seed repository.
This application is integrated with the
webpack.config.jsconfiguration and uses the latest version of the webpack-cli. It requires nodev14.15.0or higher. For more information about webpack and its features, refer to the webpack getting-started guide.
Prerequisites
Before you begin, ensure you have the following installed on your machine:
- Node.js (v14.15.0 or higher)
- Visual Studio Code (or any text editor)
- Git for cloning the quickstart repository
- A modern web browser (Chrome, Edge, Firefox, or Safari) to view the result
Dependencies
The 3D Chart control ships as part of the @syncfusion/ej2-charts package. Below is the list of minimum dependencies required.
|-- @syncfusion/ej2-charts
    |-- @syncfusion/ej2-base
    |-- @syncfusion/ej2-data
    |-- @syncfusion/ej2-pdf-export
    |-- @syncfusion/ej2-file-utils
    |-- @syncfusion/ej2-compression
    |-- @syncfusion/ej2-svg-base
Quick Setup
Step 1: Create a Project Folder
Create a folder named my-3d-chart in your desired location. This folder will contain your Syncfusion 3D Chart TypeScript project.
Step 2: Open Command Prompt
Open the command prompt and navigate to my-3d-chart folder created in Step 1. You can do this by:
-
For Windows: Open Command Prompt (cmd) or PowerShell and use the
cdcommand to navigate tomy-3d-chartfolder. -
For macOS/Linux: Open Terminal and use the
cdcommand to navigate tomy-3d-chartfolder.
Step 3: Clone the Quickstart Repository
Run the following command to clone the Syncfusion JavaScript (Essential JS 2) quickstart project from GitHub.
git clone https://github.com/SyncfusionExamples/ej2-quickstart-webpack ej2-quickstartStep 4: Navigate to Project Folder
After cloning the application in the ej2-quickstart folder, run the following command to navigate to the project directory.
cd ej2-quickstartStep 5: Install Required Packages
Syncfusion JavaScript (Essential JS 2) packages are available on the npmjs.com public registry. You can install all Syncfusion JavaScript (Essential JS 2) controls in a single @syncfusion/ej2 package or individual packages for each control.
The quickstart application is already preconfigured with the dependent @syncfusion/ej2 package in the ~/package.json file. Use the following command to install all the dependent npm packages from the command prompt:
npm installThis command will download and install all necessary dependencies for your project.
Step 6: Update the HTML Template
Open the ej2-quickstart folder in Visual Studio Code or any text editor of your choice.
Locate the ~/src/index.html file in the project, preserve any existing <link> and <script> tags that were generated by the seed, and add the HTML div tag with its id attribute as element inside <body> to initialize the 3D Chart container.
<!DOCTYPE html>
<html lang="en">

<head>
    <title>Essential JS 2 3D Chart</title>
    <meta charset="utf-8" />
    <meta name="viewport" content="width=device-width, initial-scale=1.0" />
    <meta name="description" content="TypeScript UI Controls" />
    <meta name="author" content="Syncfusion" />
    <!-- existing head content from the seed template remains here -->
</head>

<body>
    <h1>Syncfusion 3D Chart</h1>
    <!--container which is going to render the 3D Chart-->
    <div id='element'>
    </div>
</body>

</html>
Step 7: Create the 3D Chart Component with Data
Locate the src/app/app.ts file in your project and add the 3D Chart component with module injection and sample data.
Module Injection: The 3D Chart component is split into individual feature modules. To use a particular feature, inject its module using the Chart3D.Inject() method. The example below injects ColumnSeries3D and Category3D; add the others as needed.
Populate 3D Chart with Data: Create a chartData array of objects (each with a month and a sales field) and a single series object on the chart. Map the month and sales fields to the series xName and yName properties, and set the array as the dataSource. Since the month field contains category data, set the valueType for primaryXAxis to 'Category'. The sales values are in thousands, so set primaryYAxis.labelFormat to '${value}K' to add a $ prefix and K suffix. Finally, set a chart title for quick context.
import { Chart3D, ColumnSeries3D, Category3D } from '@syncfusion/ej2-charts';
Chart3D.Inject(ColumnSeries3D, Category3D);
let chartData: Object[] = [
      { month: 'Jan', sales: 35 }, { month: 'Feb', sales: 28 },
      { month: 'Mar', sales: 34 }, { month: 'Apr', sales: 32 },
      { month: 'May', sales: 40 }, { month: 'Jun', sales: 32 },
      { month: 'Jul', sales: 35 }, { month: 'Aug', sales: 55 },
      { month: 'Sep', sales: 38 }, { month: 'Oct', sales: 30 },
      { month: 'Nov', sales: 25 }, { month: 'Dec', sales: 32 }
];
let chart: Chart3D = new Chart3D({
    primaryXAxis: {
        valueType: 'Category'
    },
    primaryYAxis: {
        labelFormat: '${value}K'
    },
   series:[{
        dataSource: chartData,
        name:'Sales',
        xName: 'month',
        yName: 'sales',
        type: 'Column'
    }],
    title: 'Sales Analysis'
}, '#element');
You can refer to our JavaScript 3D Charts feature tour page for its groundbreaking feature representations. You can also explore our JavaScript 3D Charts example that shows various 3D Chart types.
Step 8: Run the Application
Open the integrated terminal in Visual Studio Code or use your command prompt to run the application. Use the npm run start command:
npm run startThe application will compile and automatically start in your default web browser. The application typically runs at http://localhost:4000. You should see the Syncfusion® 3D Chart control displayed on the page. To stop the dev server, press Ctrl+C in the terminal. For a production build, use npm run build.
Step 9: View Your 3D Chart
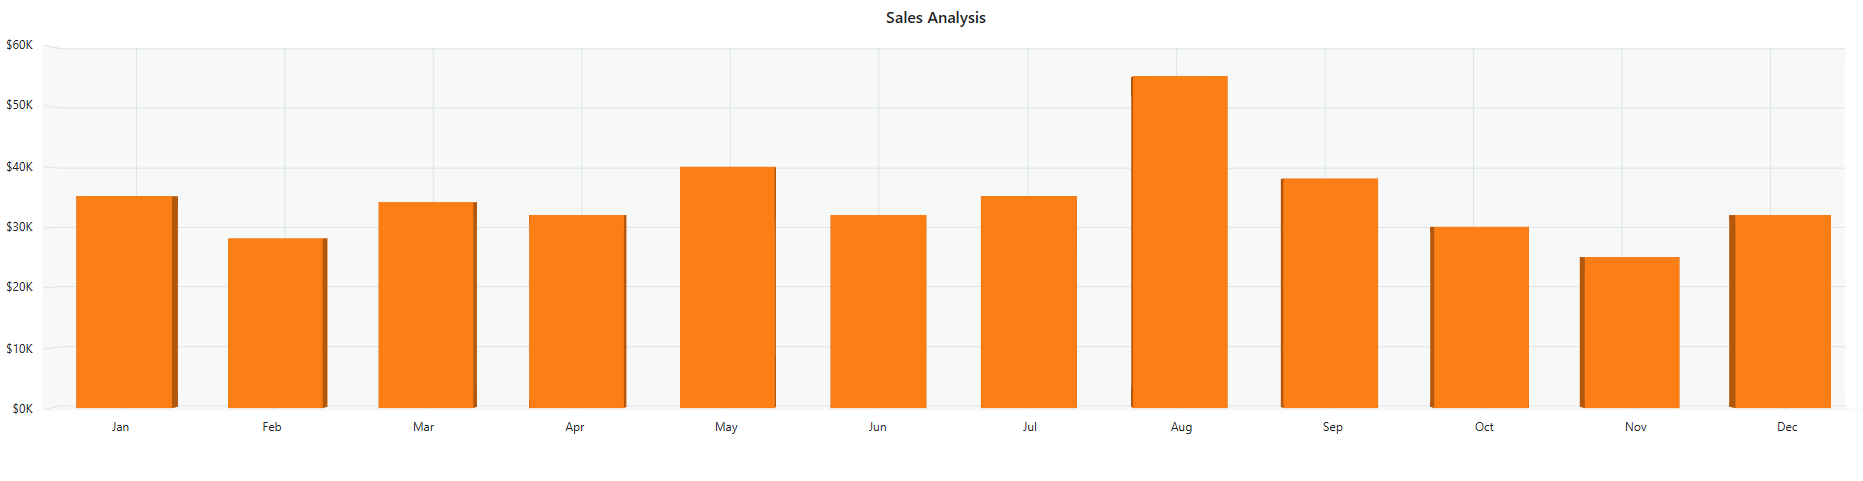
Wait for the webpack dev server to complete the build process. Once completed, you will see the 3D Chart control rendering in your browser with the sample monthly sales data, a Column series, a “Sales Analysis” title, and formatted axis labels.
Output
The following screenshot shows the output of the Syncfusion 3D Chart quick start application — a Column series rendering 12 months of sample sales data with a Category axis on the x-axis and a formatted vertical axis.
Troubleshooting
-
Blank page, no 3D Chart — The npm package failed to load. Verify the network tab and that
npm installfinished successfully. -
Cannot find module '@syncfusion/ej2-charts'— Dependencies were not installed. Re-runnpm install. -
Chart3D is undefined—Chart3D.Inject(...)was not called before thenew Chart3D(...)call. Add theInjectline at the top ofapp.ts. -
The 3D chart renders without data — Mismatched
xName/yNameand the field names in the data source. Ensure every series field matches the data keys exactly. -
TypeScript compile errors after
npm install— Runnpm run buildto see the full error; common causes are mismatchedej2-chartsand theme package versions.You can refer to our JavaScript 3D Charts feature tour page for its groundbreaking feature representations. You can also explore our JavaScript 3D Charts example that shows various 3D Chart types and how to represent time-dependent data, showing trends in data at equal intervals.