Getting Started with React Stock Chart
This section describes the steps to create a simple Stock Chart component.
A quick video overview of the React Stock Chart setup is available:
Prerequisites
Before getting started, ensure that your development environment meets the system requirements for Syncfusion® React UI components. That page documents the supported React, Node.js, and npm versions, and includes the React-version compatibility table for Syncfusion React components.
Before You Begin
This guide uses the React application structure generated by Vite with the TypeScript template. The following files are part of that scaffold and work together as follows:
-
src/App.tsx— Defines the root React component that hosts the Stock Chart component. This is the only file edited in this guide. -
src/main.tsx— Application entry point that rendersAppinto the#rootelement defined inindex.html. -
index.html— Root HTML file that contains the#rootcontainer element used to mount the React application.
Note: In a Vite React TypeScript application, the root component is commonly generated as
src/App.tsx. If your application uses JavaScript, the equivalent file is typicallysrc/App.jsx.
Note: This guide uses the TypeScript template for better type checking with Stock Chart models.
Installation and configuration
Note: As an alternative, you can create a React application using
create-react-appFor detailed instructions, refer to this documentation.
Step 1: Create a React application with Vite
Use Vite to create and manage React applications. Vite provides a fast development environment and optimized builds for modern React applications. Syncfusion® React documentation also recommends Vite for setting up React applications.
Start by opening a terminal on your system (Command Prompt, PowerShell, or Terminal). You may work from the default C: drive location or create a new folder and open the terminal in it.
Create a new React application using the following command. If Vite prompts you to install dependencies and start the project immediately, choose No. The Syncfusion package is installed in a later step.
npm create vite@latest my-chart-app -- --template react-tsNavigate to the project folder and install the application dependencies:
cd my-chart-app
npm install
Note: If you prefer JavaScript instead of TypeScript, create the application using
npm create vite@latest my-chart-app -- --template react.
Step 2: Install the Syncfusion® React Chart package
All Syncfusion Essential® JS 2 packages are published to the npm registry.
Install the React Chart package using the following command:
npm install @syncfusion/ej2-react-chartsInstalling
@syncfusion/ej2-react-chartsautomatically pulls in the required peer dependencies (for example,@syncfusion/ej2-baseand@syncfusion/ej2-charts). Runnpm installonce more if the package is not yet listed inpackage.json. Then open the project in your IDE to continue with the next step.
Step 3: Add the Stock Chart component
StockChartComponent is the root component for the Stock Chart. Open src/App.tsx (or src/App.jsx for the JavaScript template) and replace its contents with the following code.
import { StockChartComponent } from '@syncfusion/ej2-react-charts';

function App() {
  return (<StockChartComponent id="stock-chart" />);
}
export default App;
Note: Running
npm run dev(Step 7) at this point renders an empty Stock Chart area. Continue with the next steps to register a theme, inject modules, add data, and configure a series so the chart can render the data.
Step 4: Import Syncfusion® CSS styles
Themes for Syncfusion® React Stock Chart components can be applied using CSS or SASS files from the npm theme packages, CDN, CRG, or Theme Studio. For more information, see the themes documentation.
This guide uses the Tailwind 3 theme as an example, sourced from the theme package. In this package, each component includes an index.css file that automatically loads all the required dependency styles. To install the Tailwind 3 theme package, use the following command:
npm install @syncfusion/ej2-tailwind3-themeyarn add @syncfusion/ej2-tailwind3-themeBy default, Vite projects include a src/index.css file with default styles. These default styles may conflict with Syncfusion component styles, so clear all content from src/index.css to prevent style conflicts.
The required styles for the Stock Chart component are imported in the src/App.css file. Make sure src/App.tsx imports App.css (the Vite template already includes import './App.css';).
@import "@syncfusion/ej2-tailwind3-theme/styles/stock-chart/index.css";Step 5: Inject required modules
Stock Chart features are delivered as separate modules and must be explicitly injected. The Inject component takes a services array that registers the modules the Stock Chart component is allowed to use; injecting only the modules you need keeps the bundle small. Here, the CandleSeries and DateTime modules are used to render a basic stock chart:
-
CandleSeries— Inject this module intoservicesto render a candle series. -
DateTime— Inject this module intoservicesto enable the DateTime axis.
Import the modules from the Chart package and register them through the Inject component as follows.
import { StockChartComponent, CandleSeries, DateTime, Inject } from '@syncfusion/ej2-react-charts';

function App() {
  return (
    <StockChartComponent id="stock-chart">
      <Inject services={[CandleSeries, DateTime]} />
    </StockChartComponent>
  );
}
export default App;
Note: At this stage, no stock chart is rendered because the Stock Chart component has not yet been configured with a data source.
Step 6: Populate the Stock Chart with data
Stock chart data should be provided as a JSON array of objects, one object per candle. Each object uses the following fields:
-
x— the date for the candle. -
open— the opening price. -
high— the highest price during the period. -
low— the lowest price during the period. -
close— the closing price. -
volume— the trading volume (optional, used by volume series).
The example below keeps the data inline in src/App.tsx for clarity. The component-level props used in the snippet are:
-
title— the chart’s title. -
primaryXAxis— the horizontal axis.valueType: 'DateTime'makes the axis treat eachxvalue as a date. -
primaryYAxis— the vertical axis.labelFormat: 'n0'formats labels as plain numbers. -
height— the chart height in pixels. -
enablePeriodSelector— whether to show the period selector toolbar (set tofalseto hide it for this guide).
The series-level props used in the snippet are:
-
dataSource— the array of data objects. -
xName,high,low,close,open— the field names in each data object used for the candle’s date and OHLC values. -
type— the series type. Use"Candle"for a candle chart.
The following code snippet demonstrates the complete configuration required to render a basic candle chart:
import {
  StockChartComponent, StockChartSeriesCollectionDirective, StockChartSeriesDirective,
  Inject, DateTime, CandleSeries
} from '@syncfusion/ej2-react-charts';

const data = [
  { x: new Date('2012-04-02'), open: 320.71, high: 324.07, low: 317.74, close: 323.78, volume: 45638000 },
  { x: new Date('2012-04-03'), open: 323.03, high: 324.30, low: 319.64, close: 321.63, volume: 40857000 },
  { x: new Date('2012-04-04'), open: 319.54, high: 319.82, low: 315.87, close: 317.89, volume: 32519000 },
  { x: new Date('2012-04-05'), open: 316.44, high: 318.53, low: 314.60, close: 316.48, volume: 46327000 },
  { x: new Date('2012-04-06'), open: 317.20, high: 320.50, low: 315.30, close: 319.80, volume: 38200000 },
  { x: new Date('2012-04-07'), open: 320.00, high: 322.90, low: 318.50, close: 321.10, volume: 35500000 },
  { x: new Date('2012-04-08'), open: 321.50, high: 325.20, low: 320.80, close: 324.70, volume: 41200000 },
  { x: new Date('2012-04-09'), open: 325.00, high: 326.80, low: 322.40, close: 323.90, volume: 39800000 },
  { x: new Date('2012-04-10'), open: 324.20, high: 327.00, low: 323.10, close: 326.10, volume: 42100000 },
  { x: new Date('2012-04-11'), open: 326.30, high: 329.20, low: 325.50, close: 328.70, volume: 44500000 },
  { x: new Date('2012-04-12'), open: 328.90, high: 330.50, low: 326.70, close: 327.80, volume: 36700000 },
  { x: new Date('2012-04-13'), open: 327.60, high: 329.00, low: 324.90, close: 326.20, volume: 35200000 },
  { x: new Date('2012-04-14'), open: 326.40, high: 328.70, low: 325.20, close: 327.90, volume: 33900000 },
  { x: new Date('2012-04-15'), open: 328.00, high: 331.10, low: 327.30, close: 330.50, volume: 41000000 },
  { x: new Date('2012-04-16'), open: 330.80, high: 333.20, low: 329.60, close: 332.90, volume: 43800000 },
  { x: new Date('2012-04-17'), open: 333.10, high: 335.50, low: 331.80, close: 334.20, volume: 46200000 },
  { x: new Date('2012-04-18'), open: 334.40, high: 336.00, low: 332.20, close: 333.00, volume: 38900000 },
  { x: new Date('2012-04-19'), open: 333.20, high: 334.80, low: 330.90, close: 331.50, volume: 36000000 },
  { x: new Date('2012-04-20'), open: 331.70, high: 333.90, low: 329.50, close: 330.20, volume: 34800000 },
  { x: new Date('2012-04-21'), open: 330.40, high: 332.60, low: 328.80, close: 331.90, volume: 37000000 }
];

function App() {
  return (
    <StockChartComponent
      id="stock-chart"
      title="Stock Chart"
      height="350"
      enablePeriodSelector={false}
      primaryXAxis={{
        valueType: 'DateTime',
        majorGridLines: { width: 0 },
        majorTickLines: { color: 'transparent' },
        crosshairTooltip: { enable: true }
      }}
      primaryYAxis={{
        labelFormat: 'n0',
        lineStyle: { width: 0 },
        rangePadding: 'None',
        majorTickLines: { width: 0 }
      }}
    >
      <Inject services={[DateTime, CandleSeries]} />
      <StockChartSeriesCollectionDirective>
        <StockChartSeriesDirective
          dataSource={data}
          xName="x"
          high="high"
          low="low"
          close="close"
          open="open"
          type="Candle"
        />
      </StockChartSeriesCollectionDirective>
    </StockChartComponent>
  );
}

export default App;
Step 7: Run the application
Run the application using the following command:
npm run devOpen the generated local URL (for example, http://localhost:5173/) in the browser. The application displays the basic stock chart as shown below:
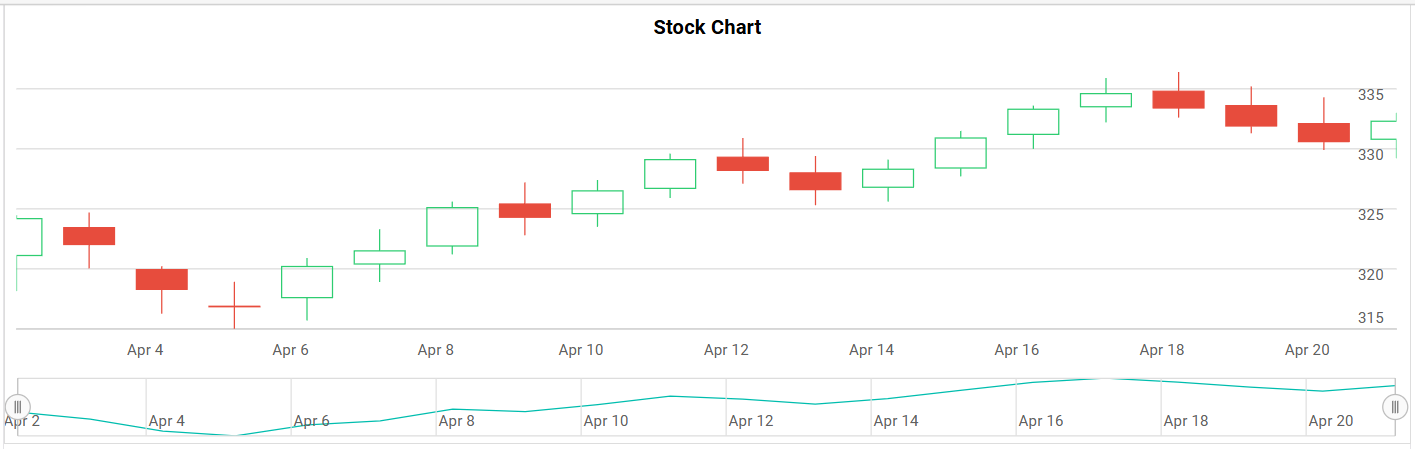
To stop the dev server, press Ctrl + C in the terminal. To create a production build and preview it, run:
npm run build
npm run preview