Getting Started with Syncfusion® JavaScript (ES5) Smith Chart Control
Build your first Syncfusion JavaScript (ES5) application with a simple Smith Chart in just a few minutes. This quickstart guides you through creating a minimal, runnable HTML page that loads the Syncfusion EJ2 (ES5) Smith Chart control from the CDN, binds it to sample transmission-line data, and renders an interactive impedance plot.
Prerequisites
- Visual Studio Code (or any text editor)
- A web browser to view the result
- A local web server such as the VS Code Live Server extension
Dependencies
The Smith Chart control ships as part of the @syncfusion/ej2-charts package. Below is the list of minimum dependencies required.
|-- @syncfusion/ej2-charts
    |-- @syncfusion/ej2-base
    |-- @syncfusion/ej2-data
    |-- @syncfusion/ej2-svg-base
    |-- @syncfusion/ej2-pdf-export
    |-- @syncfusion/ej2-compression
    |-- @syncfusion/ej2-file-utils
Quick Setup
Step 1: Create Folder and HTML file
- Create a folder named
quickstartin your desired directory. - Inside the
quickstartfolder, create two new files:index.htmlandindex.js.
Step 2: Add Syncfusion® CDN Resources
Include the following JavaScript and CSS links in the <head> section of index.html.
Scripts (JavaScript):
<script src="https://cdn.syncfusion.com/ej2/34.1.29/ej2-base/dist/global/ej2-base.min.js" type="text/javascript"></script>
<script src="https://cdn.syncfusion.com/ej2/34.1.29/ej2-svg-base/dist/global/ej2-svg-base.min.js" type="text/javascript"></script>
<script src="https://cdn.syncfusion.com/ej2/34.1.29/ej2-charts/dist/global/ej2-charts.min.js" type="text/javascript"></script>Or, to load all Syncfusion components in a single combined bundle:
<script src="https://cdn.syncfusion.com/ej2/34.1.29/dist/ej2.min.js" type="text/javascript"></script>Step 3: Add the Syncfusion® Smith Chart Control to the Application
The index.html file references a separate index.js file that contains the Smith Chart component initialization. This keeps your markup and script logic cleanly separated, which is the recommended pattern for Syncfusion® JavaScript (ES5) apps.
index.js imports nothing manually — the global scripts added in Step 2 register the ej.charts.Smithchart class on the ej namespace. The script then builds the Smith Chart with a single dataSource-bound series and renders the control into the #element container declared in index.html.
var smithchart = new ej.charts.Smithchart({
    series: [
        {
            dataSource: [
                { resistance: 0, reactance: 0.05 }, { resistance: 0, reactance: 0.05 },
                { resistance: 0, reactance: 0.05 }, { resistance: 0, reactance: 0.05 },
                { resistance: 0, reactance: 0.05 }, { resistance: 0, reactance: 0.05 },
                { resistance: 0, reactance: 0.05 }, { resistance: 0, reactance: 0.05 },
                { resistance: 0, reactance: 0.05 }, { resistance: 0, reactance: 0.05 },
                { resistance: 0.3, reactance: 0.1 }, { resistance: 0.5, reactance: 0.2 },
                { resistance: 1.5, reactance: 0.5 }, { resistance: 2.0, reactance: 0.5 },
                { resistance: 2.5, reactance: 0.4 }, { resistance: 3.5, reactance: 0.0 },
                { resistance: 2.5, reactance: 0.4 }, { resistance: 3.5, reactance: 0.0 },
                { resistance: 2.5, reactance: 0.4 }, { resistance: 3.5, reactance: 0.0 },
                { resistance: 4.5, reactance: -0.5 }, { resistance: 5.0, reactance: -1.0 }
            ],
            name: 'Transmission1',
            reactance: 'reactance', resistance: 'resistance'
        }
    ]
});
smithchart.appendTo('#element');
<!DOCTYPE html><html lang="en"><head>
<title>Essential JS 2 for Smith chart </title>
<meta charset="utf-8">
<meta name="viewport" content="width=device-width, initial-scale=1.0">
<meta name="description" content="Essential JS 2 for Smithchart UI Control">
<meta name="author" content="Syncfusion">
<link href="index.css" rel="stylesheet">
<link href="//cdn.syncfusion.com/ej2/21.2.3/ej2-charts/styles/material.css" rel="stylesheet">
<script src="https://cdn.syncfusion.com/ej2/34.2.2/dist/ej2.min.js" type="text/javascript"></script>
</head>
<body>
<div id="container">
<div id="element"></div>
</div>
<script>
var ele = document.getElementById('container');
if(ele) {
ele.style.visibility = "visible";
}
</script>
<script src="index.js" type="text/javascript"></script>
</body></html>The new ej.charts.Smithchart({...}) call creates the Smith Chart component. The configuration object accepts the following key options:
-
series— Array of series objects. Each series is rendered as a curve on the chart. -
series[].dataSource— Array of{ resistance, reactance }objects. Use this when you want to bind a dataset to the series. -
series[].resistance/series[].reactance— Names of the data fields that hold the resistance and reactance values when binding to adataSource.
Finally, smithchart.appendTo('#element') renders the control into the <div id="element"> element declared in index.html.
Step 4: Open in Browser
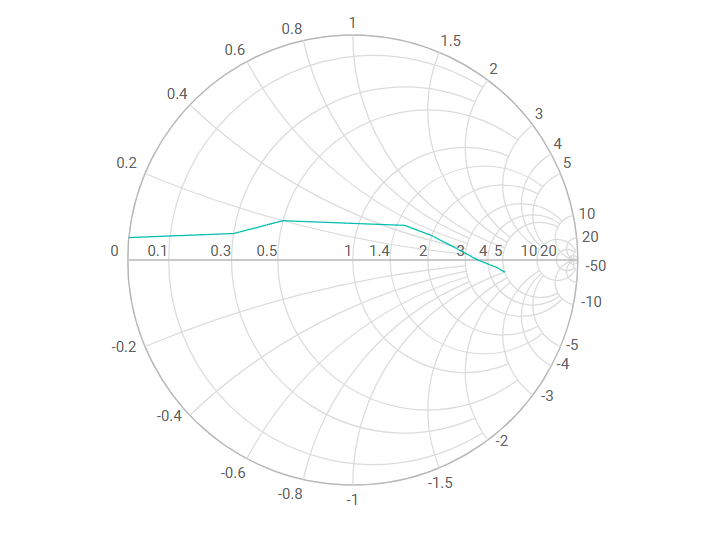
Open quickstart/index.html through a local web server. With the VS Code Live Server extension installed, right-click index.html in the Explorer and choose Open with Live Server, then visit the URL it prints (for example, http://127.0.0.1:5500/). You should see the Syncfusion Smith Chart control displaying the transmission-line sample data.
Output
The following screenshot shows the output of the Syncfusion Smith Chart quick start application:
Troubleshooting
-
ej is not defined. Confirm thatej2-charts.min.jsis loaded before your script. Place the<script>tag inside the<head>or just before your own<script src="index.js">tag. -
The container is empty. Make sure the
idin your markup (#element) matches the selector passed toappendTo('#element'). -
dataSourceis ignored. When usingseries[].dataSource, you must also set the matchingresistanceandreactancefield names; otherwise the series renders empty. Useseries[].pointsinstead if you want to pass values directly.