Blazor 3D Chart Data Labels
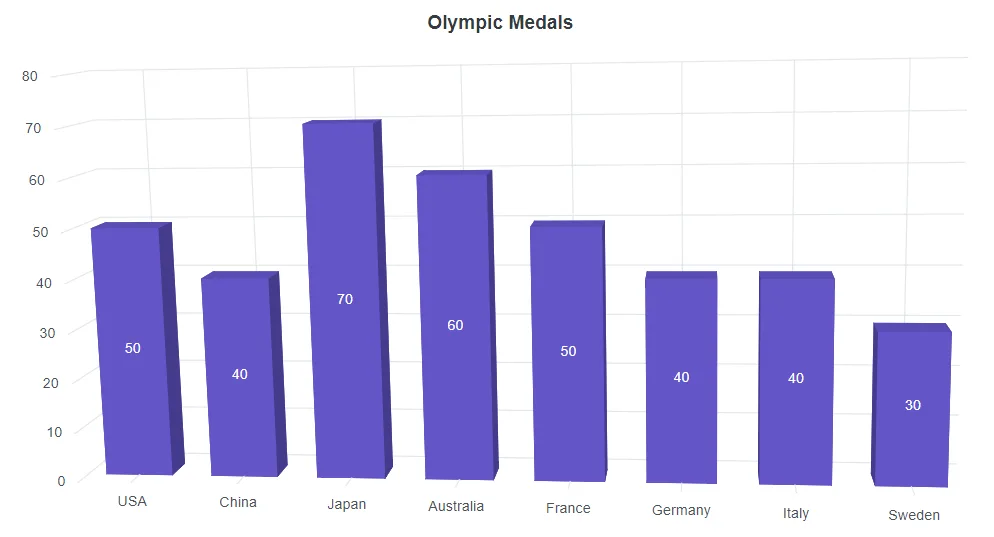
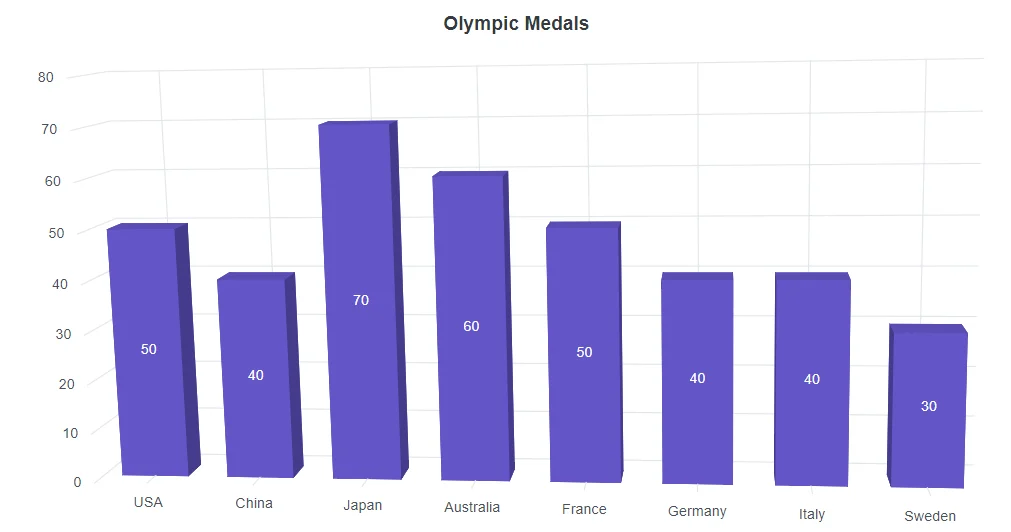
Data labels are fields that includes information about the sample point connected to an output. It can be added to a chart series by enabling the Visible property in the Chart3DDataLabel. By default, the labels will arrange smartly without overlapping.
@using Syncfusion.Blazor.Chart3D

<SfChart3D Title="Olympic Medals" WallColor="transparent" EnableRotation="true" RotationAngle="7" TiltAngle="10" Depth="100">
    <Chart3DPrimaryXAxis ValueType="Syncfusion.Blazor.Chart3D.ValueType.Category">
       </Chart3DPrimaryXAxis>

    <Chart3DSeriesCollection>
        <Chart3DSeries DataSource="@MedalDetails" XName="Country" YName="Gold" Type="Chart3DSeriesType.Column">
            <Chart3DDataLabel Visible="true"></Chart3DDataLabel>
        </Chart3DSeries>
    </Chart3DSeriesCollection>
</SfChart3D>

@code{
    public class Chart3DData
    {
        public string Country { get; set; }
        public double Gold { get; set; }
        public double Silver { get; set; }
    }

    public List<Chart3DData> MedalDetails = new List<Chart3DData>
    {
		new Chart3DData{ Country = "USA", Gold = 50, Silver = 70 },
		new Chart3DData{ Country = "China", Gold = 40, Silver = 60 },
		new Chart3DData{ Country = "Japan", Gold = 70, Silver = 60 },
		new Chart3DData{ Country = "Australia", Gold = 60, Silver = 56 },
		new Chart3DData{ Country = "France", Gold = 50, Silver = 45 },
		new Chart3DData{ Country = "Germany", Gold = 40, Silver = 30 },
		new Chart3DData{ Country = "Italy", Gold = 40, Silver = 35 },
		new Chart3DData{ Country = "Sweden", Gold = 30, Silver = 25 }
    };
}
Position
The Position property is used to place the label either on Top, Middle, or Bottom.
@using Syncfusion.Blazor.Chart3D

<SfChart3D Title="Olympic Medals" WallColor="transparent" EnableRotation="true" RotationAngle="7" TiltAngle="10" Depth="100">
    <Chart3DPrimaryXAxis ValueType="Syncfusion.Blazor.Chart3D.ValueType.Category">
       </Chart3DPrimaryXAxis>

    <Chart3DSeriesCollection>
        <Chart3DSeries DataSource="@MedalDetails" XName="Country" YName="Gold" Type="Chart3DSeriesType.Column">
            <Chart3DDataLabel Visible="true" Position="Syncfusion.Blazor.Chart3D.Chart3DDataLabelPosition.Middle"></Chart3DDataLabel>
        </Chart3DSeries>
    </Chart3DSeriesCollection>
</SfChart3D>

@code{
    public class Chart3DData
    {
        public string Country { get; set; }
        public double Gold { get; set; }
        public double Silver { get; set; }
    }

    public List<Chart3DData> MedalDetails = new List<Chart3DData>
    {
		new Chart3DData{ Country = "USA", Gold = 50, Silver = 70 },
		new Chart3DData{ Country = "China", Gold = 40, Silver = 60 },
		new Chart3DData{ Country = "Japan", Gold = 70, Silver = 60 },
		new Chart3DData{ Country = "Australia", Gold = 60, Silver = 56 },
		new Chart3DData{ Country = "France", Gold = 50, Silver = 45 },
		new Chart3DData{ Country = "Germany", Gold = 40, Silver = 30 },
		new Chart3DData{ Country = "Italy", Gold = 40, Silver = 35 },
		new Chart3DData{ Country = "Sweden", Gold = 30, Silver = 25 }
    };
}
Template
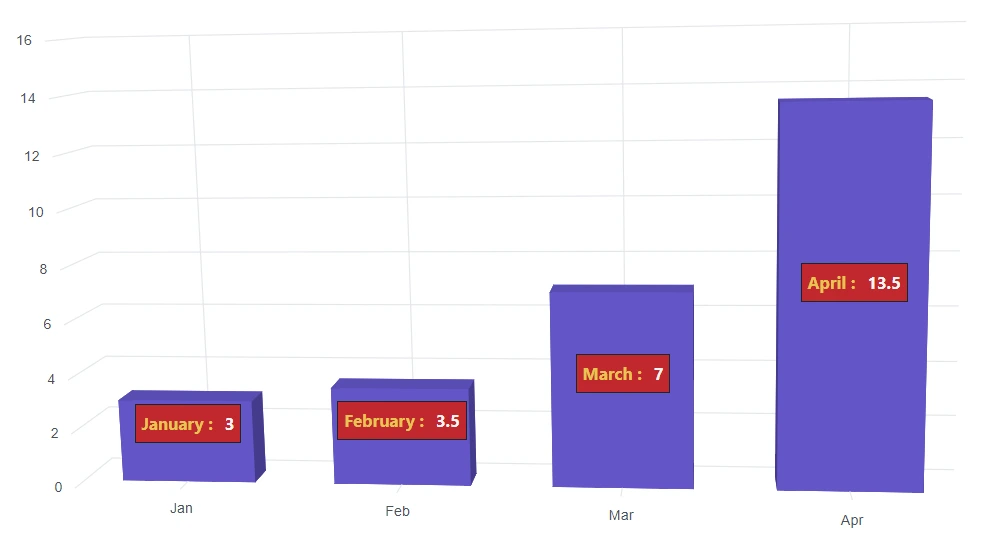
Label content can be formatted by using the template option. Inside the template, the placeholder text ${point.x} and ${point.y} can be added to display corresponding data points x & y value. Using Chart3DDataLabelTemplate property, the data label template can be set.
@using Syncfusion.Blazor.Chart3D

<SfChart3D WallColor="transparent" EnableRotation="true" RotationAngle="7" TiltAngle="10" Depth="100">
    <Chart3DPrimaryXAxis ValueType="Syncfusion.Blazor.Chart3D.ValueType.Category" />

    <Chart3DSeriesCollection>
        <Chart3DSeries DataSource="@SalesReports" XName="X" YName="Y">
                <Chart3DDataLabel Visible="true" NameField="Text">
                    <Chart3DDataLabelTemplate>
                        @{
                            var data = context as Chart3DDataPointInfo;
                        }
                        <table>
                            <tr>
                                <td align="center" style="background-color: #C1272D; font-size: 14px; color: #E7C554; font-weight: bold; padding: 5px"> @data.PointText :</td>
                                <td align="center" style="background-color: #C1272D; font-size: 14px; color: whitesmoke; font-weight: bold; padding: 5px"> @data.Y</td>
                            </tr>
                        </table>
                    </Chart3DDataLabelTemplate>
                </Chart3DDataLabel>
        </Chart3DSeries>
    </Chart3DSeriesCollection>
</SfChart3D>

@code{
    public class Data
    {
        public string X { get; set; }
        public double Y { get; set; }
        public string Text { get; set; }
    }

    public List<Data> SalesReports = new List<Data>
	{
       new Data{ X= "Jan", Y= 3, Text= "January" },
       new Data{ X= "Feb", Y= 3.5, Text= "February" },
       new Data{ X= "Mar", Y= 7, Text= "March" },
       new Data{ X= "Apr", Y= 13.5, Text= "April" }
    };
}
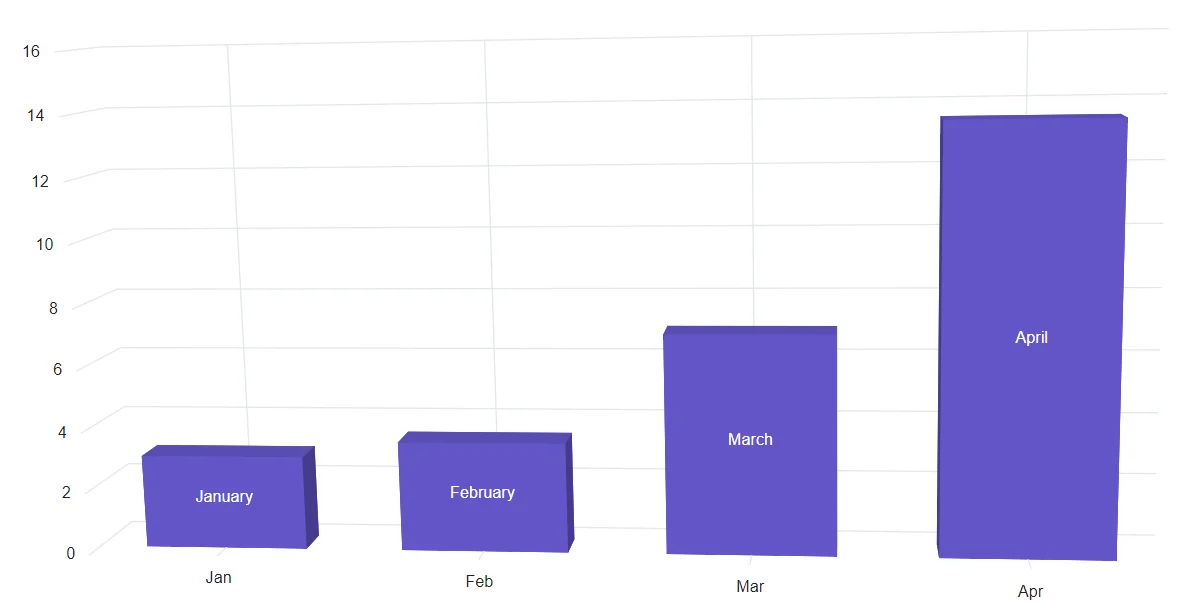
Text mapping
Text from the data source can be mapped using the NameField property.
@using Syncfusion.Blazor.Chart3D

<SfChart3D WallColor="transparent" EnableRotation="true" RotationAngle="7" TiltAngle="10" Depth="100">
    <Chart3DPrimaryXAxis ValueType="Syncfusion.Blazor.Chart3D.ValueType.Category"></Chart3DPrimaryXAxis>

    <Chart3DSeriesCollection>
        <Chart3DSeries DataSource="@WeatherReports" XName="X" YName="Y" Type="Chart3DSeriesType.Column">
            <Chart3DDataLabel Visible="true" NameField="Text"></Chart3DDataLabel>
        </Chart3DSeries>
    </Chart3DSeriesCollection>
</SfChart3D>

@code{
    public class Data
    {
        public string X { get; set; }
        public double Y { get; set; }
        public string Text { get; set; }
    }

    public List<Data> WeatherReports = new List<Data>
	{
	   new Data{ X = "Jan", Y = 3, Text = "January" },
	   new Data{ X = "Feb", Y = 3.5, Text = "February" },
	   new Data{ X = "Mar", Y = 7, Text = "March" },
	   new Data{ X = "Apr", Y = 13.5, Text = "April" }
	};
}
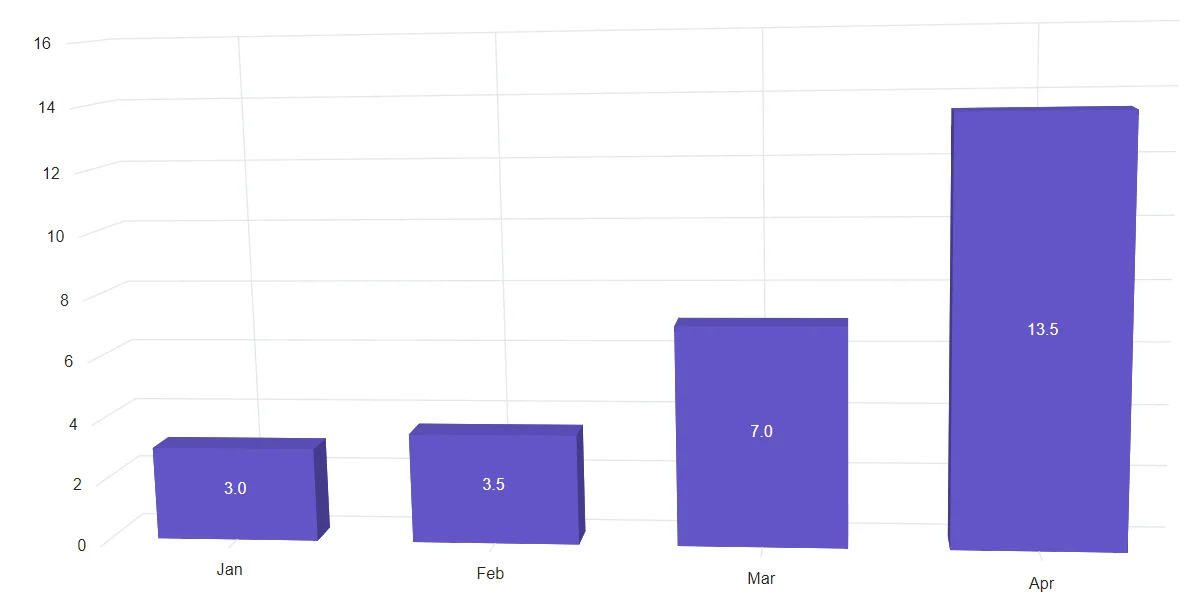
Format
Data label for the chart can be formatted using the Format property. The global formatting options can be used as ‘N1’, ‘P1’, and ‘C1’.
@using Syncfusion.Blazor.Chart3D

<SfChart3D WallColor="transparent" EnableRotation="true" RotationAngle="7" TiltAngle="10" Depth="100">
    <Chart3DPrimaryXAxis ValueType="Syncfusion.Blazor.Chart3D.ValueType.Category"></Chart3DPrimaryXAxis>

    <Chart3DSeriesCollection>
        <Chart3DSeries DataSource="@WeatherReports" XName="X" YName="Y" Type="Chart3DSeriesType.Column">
            <Chart3DDataLabel Visible="true" Format="N1"></Chart3DDataLabel>
        </Chart3DSeries>
    </Chart3DSeriesCollection>
</SfChart3D>

@code{
    public class Data
    {
        public string X { get; set; }
        public double Y { get; set; }
        public string Text { get; set; }
    }

    public List<Data> WeatherReports = new List<Data>
	{
	   new Data{ X = "Jan", Y = 3, Text = "January" },
	   new Data{ X = "Feb", Y = 3.5, Text = "February" },
	   new Data{ X = "Mar", Y = 7, Text = "March" },
	   new Data{ X = "Apr", Y = 13.5, Text = "April" }
	};
}
The table below shows the results of applying various commonly used label formats to numeric data.
| Value | Format | Resultant Value | Description |
|---|---|---|---|
| 1000 | n1 | 1000.0 | The number is rounded to 1 decimal place. |
| 1000 | n2 | 1000.00 | The number is rounded to 2 decimal places. |
| 1000 | n3 | 1000.000 | The number is rounded to 3 decimal place. |
| 0.01 | p1 | 1.0% | The number is converted to percentage with 1 decimal place. |
| 0.01 | p2 | 1.00% | The number is converted to percentage with 2 decimal place. |
| 0.01 | p3 | 1.000% | The number is converted to percentage with 3 decimal place. |
| 1000 | c1 | $1000.0 | The currency symbol is appended to number and number is rounded to 1 decimal place. |
| 1000 | c2 | $1000.00 | The currency symbol is appended to number and number is rounded to 2 decimal place. |
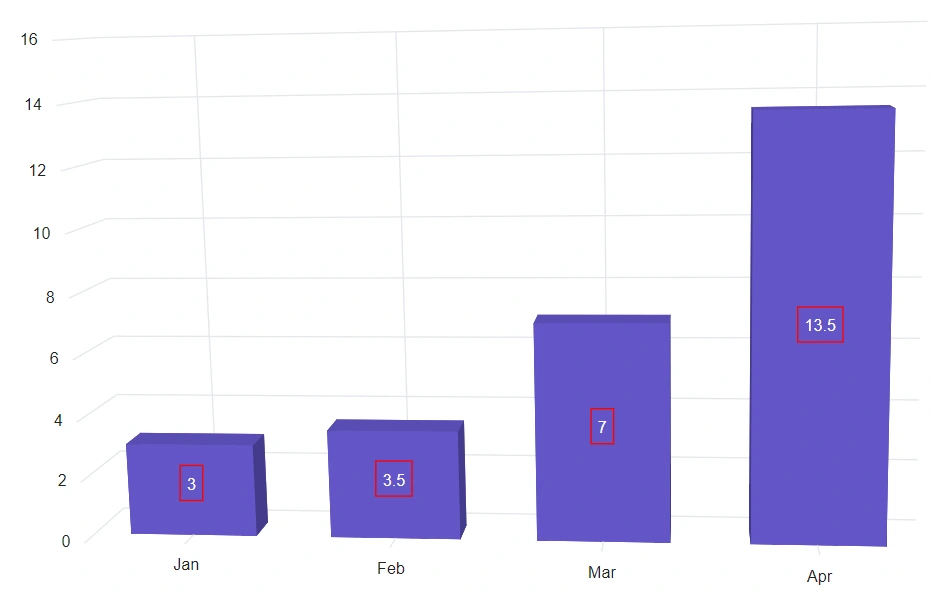
Margin
The Margin option can be applied to the data label to create space around the element.
@using Syncfusion.Blazor.Chart3D

<SfChart3D WallColor="transparent" EnableRotation="true" RotationAngle="7" TiltAngle="10" Depth="100">
    <Chart3DPrimaryXAxis ValueType="Syncfusion.Blazor.Chart3D.ValueType.Category"></Chart3DPrimaryXAxis>

    <Chart3DSeriesCollection>
        <Chart3DSeries DataSource="@WeatherReports" XName="X" YName="Y" Type="Chart3DSeriesType.Column">
            <Chart3DDataLabel Visible="true">
                <Chart3DDataLabelBorder Color="red" Width="1"></Chart3DDataLabelBorder>
                <Chart3DDataLabelMargin Bottom="5" Left="5" Right="5" Top="5"></Chart3DDataLabelMargin>
            </Chart3DDataLabel>
        </Chart3DSeries>
    </Chart3DSeriesCollection>
</SfChart3D>

@code{
    public class Data
    {
        public string X { get; set; }
        public double Y { get; set; }
        public string Text { get; set; }
    }

    public List<Data> WeatherReports = new List<Data>
	{
	   new Data{ X = "Jan", Y = 3, Text = "January" },
	   new Data{ X = "Feb", Y = 3.5, Text = "February" },
	   new Data{ X = "Mar", Y = 7, Text = "March" },
	   new Data{ X = "Apr", Y = 13.5, Text = "April" }
	};
}
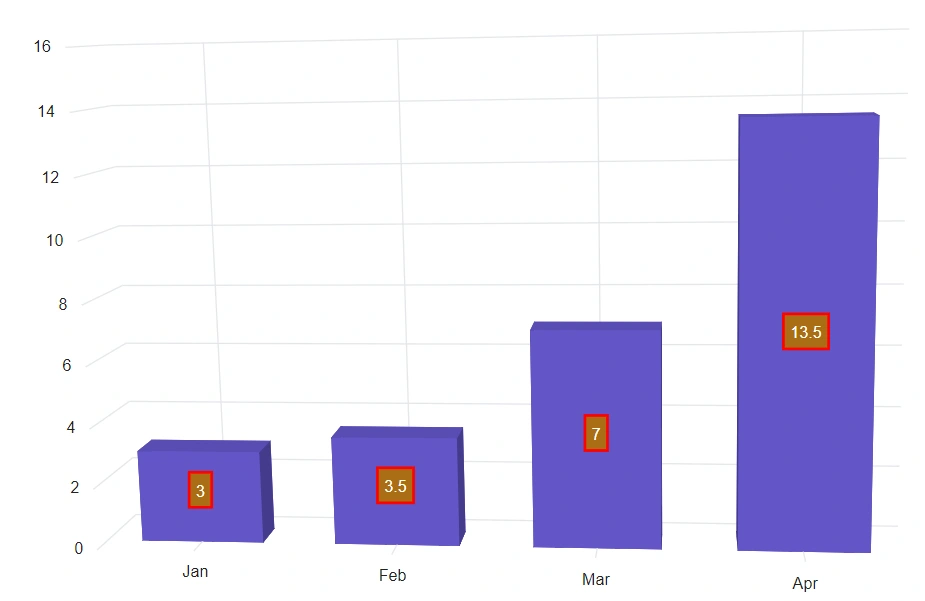
Customization
The stroke and border of data label can be customized using Fill and Chart3DDataLabelBorder properties.
@using Syncfusion.Blazor.Chart3D

<SfChart3D WallColor="transparent" EnableRotation="true" RotationAngle="7" TiltAngle="10" Depth="100">
    <Chart3DPrimaryXAxis ValueType="Syncfusion.Blazor.Chart3D.ValueType.Category"></Chart3DPrimaryXAxis>

    <Chart3DSeriesCollection>
        <Chart3DSeries DataSource="@WeatherReports" XName="X" YName="Y" Type="Chart3DSeriesType.Column">
            <Chart3DDataLabel Visible="true" Fill="#AB6E15">
                    <Chart3DDataLabelBorder Width="2" Color="red"></Chart3DDataLabelBorder>
            </Chart3DDataLabel>
        </Chart3DSeries>
    </Chart3DSeriesCollection>
</SfChart3D>

@code{
    public class Data
    {
        public string X { get; set; }
        public double Y { get; set; }
        public string Text { get; set; }
    }

    public List<Data> WeatherReports = new List<Data>
	{
	   new Data{ X = "Jan", Y = 3, Text = "January" },
	   new Data{ X = "Feb", Y = 3.5, Text = "February" },
	   new Data{ X = "Mar", Y = 7, Text = "March" },
	   new Data{ X = "Apr", Y = 13.5, Text = "April" }
	};
}
Customizing specific label
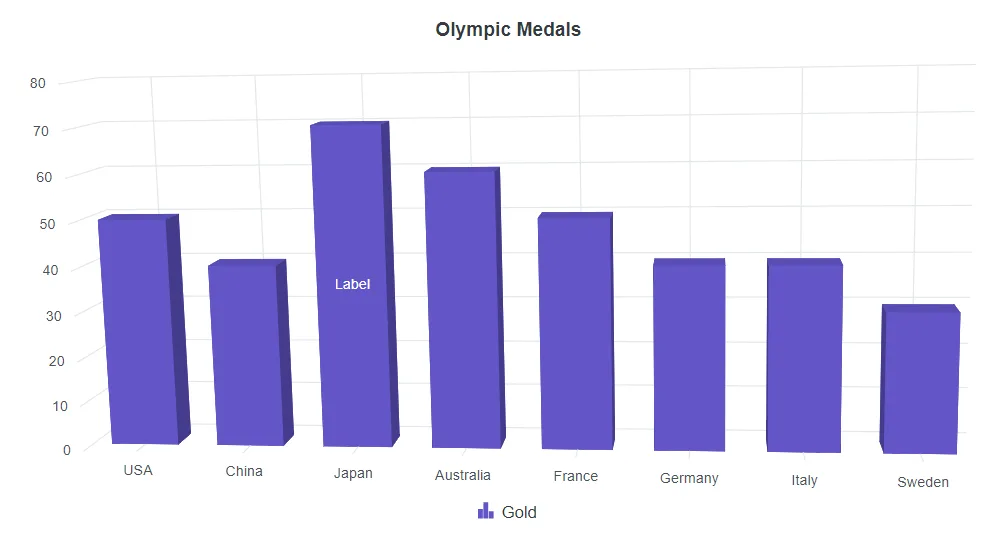
A specific label can be customized by using the TextRender event. The TextRender event allows you to change the label text for the point.
@using Syncfusion.Blazor.Chart3D

<SfChart3D Title="Olympic Medals" DataLabelRendering="TextRender" WallColor="transparent" EnableRotation="true" RotationAngle="7" TiltAngle="10" Depth="100">
    <Chart3DPrimaryXAxis ValueType="Syncfusion.Blazor.Chart3D.ValueType.Category"/>
    <Chart3DSeriesCollection>
        <Chart3DSeries DataSource="@MedalDetails" Name="Gold" XName="Country" Opacity="1" YName="Gold" Type="Chart3DSeriesType.Column">
            <Chart3DDataLabel Visible="true"></Chart3DDataLabel>
        </Chart3DSeries>
    </Chart3DSeriesCollection>

    <Chart3DLegendSettings Visible="true"></Chart3DLegendSettings>
</SfChart3D>

@code{

    public class Chart3DData
    {
        public string Country { get; set; }
        public double Gold { get; set; }
        public double Silver { get; set; }
        public double Bronze { get; set; }
    }

    public List<Chart3DData> MedalDetails = new List<Chart3DData>
	{
		new Chart3DData { Country = "USA", Gold = 50, Silver = 70, Bronze = 45 },
        new Chart3DData { Country = "China", Gold = 40, Silver = 60, Bronze = 55 },
        new Chart3DData { Country = "Japan", Gold = 70, Silver = 60, Bronze = 50 },
        new Chart3DData { Country = "Australia", Gold = 60, Silver = 56, Bronze = 40 },
        new Chart3DData { Country = "France", Gold = 50, Silver = 45, Bronze = 35 },
        new Chart3DData { Country = "Germany", Gold = 40, Silver = 30, Bronze = 22 },
        new Chart3DData { Country = "Italy", Gold = 40, Silver = 35, Bronze = 37 },
        new Chart3DData { Country = "Sweden", Gold = 30, Silver = 25, Bronze = 27 }
	};

    public void TextRender(Chart3DTextRenderEventArgs args)
    {
        if (args.Point.Index == 2)
        {
            args.Text = "Label";
        }
        else
        {
            args.Cancel = true;
        }
    }
}