Bubbles in ASP.NET Core Maps
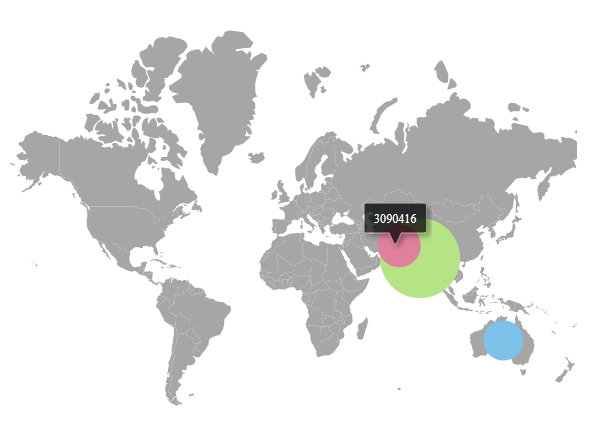
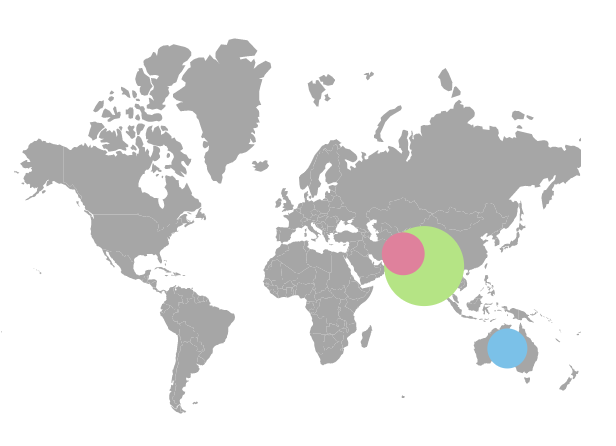
Bubbles in the Maps component represent the underlying data values of the Maps. It can be scattered throughout the Maps shapes that contain values in the data source. Bubbles are enabled by setting the Visible property of MapsBubble to true. To add bubbles to the Maps, bind the data source to the DataSource property of MapsBubble and set the field name, that contains the numerical data, in the data source to the ValuePath property.
@using Syncfusion.EJ2.Maps;

@{
    var data = new[]
       {
            new { name= "India", population= "38332521" },
            new { name= "Australia", population= "383521" },
            new { name= "Pakistan", population= "3090416" }
    };
    var bubble = new List<MapsBubble>
        {
            new MapsBubble{Visible=true, MinRadius=20, DataSource=data, MaxRadius=40, ValuePath="population"}
        };
}
<ejs-maps id="maps">
    <e-maps-layers>
        <e-maps-layer shapeData=" ViewBag.world_map" shapeDataPath="name" shapePropertyPath='new[] { "name" }' bubbleSettings="bubble">
        </e-maps-layer>
    </e-maps-layers>
</ejs-maps>
using System;
using System.Collections.Generic;
using System.Diagnostics;
using System.Linq;
using System.Threading.Tasks;
using Microsoft.AspNetCore.Mvc;
using EJ2_Core_Application.Models;
using Newtonsoft.Json;
namespace EJ2_Core_Application.Controllers
{
public class HomeController : Controller
{
public IActionResult Index()
{
ViewBag.world_map = GetWorldMap();
ViewBag.worldMap = GetMap();
List<BubbleData> data = new List<BubbleData>
{
new BubbleData { name= "India", population= "38332521" },
new BubbleData { name= "Australia", population= "383521" },
new BubbleData { name= "Pakistan", population= "3090416" }
};
ViewBag.bubbleData = data;
return View();
}
public object GetMap()
{
string allText = System.IO.File.ReadAllText(Server.MapPath("~/App_Data/WorldMap.json"));
return JsonConvert.DeserializeObject(allText, typeof(object));
}
public object GetWorldMap()
{
string allText = System.IO.File.ReadAllText("./wwwroot/scripts/MapsData/world_map.js");
return JsonConvert.DeserializeObject(allText);
}
public class BubbleData
{
public string name { get; set; }
public string population { get; set; }
}
}
}
Bubble shapes
The following types of shapes are available to render the bubbles in Maps.
- Circle
- Square
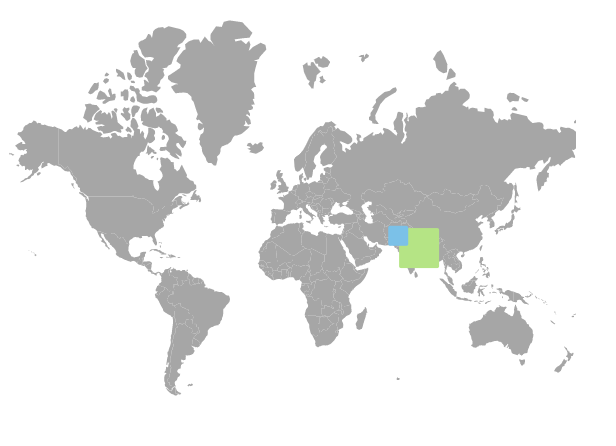
By default, bubbles are rendered in the Circle type. To change the type of the bubble, set the BubbleType property of MapsBubble as Square to render the square shape bubbles.
@using Syncfusion.EJ2.Maps;

@{
    var data = new[]
       {
            new { name= "India", population= "38332521" },
            new { name= "Pakistan", population= "3090416" }
    };
    var bubble = new List<MapsBubble>
{
            new MapsBubble{Visible=true, DataSource=data, ValuePath="population", BubbleType=Syncfusion.EJ2.Maps.BubbleType.Square}
};
}
<ejs-maps id="maps">
    <e-maps-layers>
        <e-maps-layer shapeData="ViewBag.world_map" shapeDataPath="name" shapePropertyPath='new[] { "name" }' bubbleSettings="bubble">
        </e-maps-layer>
    </e-maps-layers>
</ejs-maps>
using System;
using System.Collections.Generic;
using System.Diagnostics;
using System.Linq;
using System.Threading.Tasks;
using Microsoft.AspNetCore.Mvc;
using EJ2_Core_Application.Models;
using Newtonsoft.Json;
namespace EJ2_Core_Application.Controllers
{
public class HomeController : Controller
{
public IActionResult Index()
{
ViewBag.world_map = GetWorldMap();
ViewBag.worldMap = GetMap();
List<BubbleData> data = new List<BubbleData>
{
new BubbleData { name= "India", population= "38332521" },
new BubbleData { name= "Pakistan", population= "3090416" }
};
ViewBag.bubbleData = data;
return View();
}
public object GetWorldMap()
{
string allText = System.IO.File.ReadAllText("./wwwroot/scripts/MapsData/world_map.js");
return JsonConvert.DeserializeObject(allText);
}
public object GetMap()
{
string allText = System.IO.File.ReadAllText(Server.MapPath("~/App_Data/WorldMap.json"));
return JsonConvert.DeserializeObject(allText, typeof(object));
}
public class BubbleData
{
public string name { get; set; }
public string population { get; set; }
}
}
}
Customization
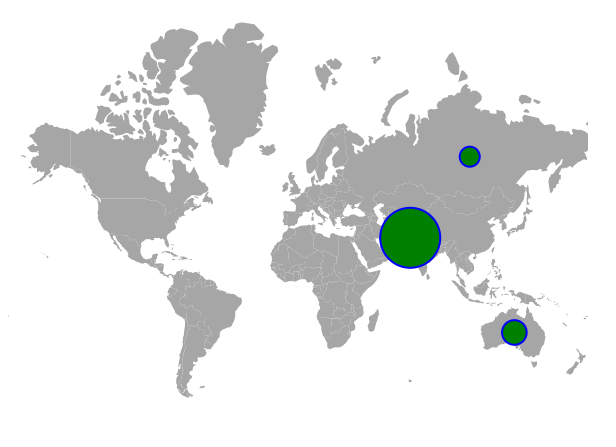
The following properties are available in MapsBubble to customize the bubbles of the Maps component.
-
Border– To customize the color, width and opacity of the border of the bubbles in Maps. -
Fill– To apply the color for bubbles in Maps. -
Opacity– To apply opacity to the bubbles in Maps. -
AnimationDelay- To change the time delay in the transition for bubbles. -
AnimationDuration- To change the time duration of animation for bubbles.
@using Syncfusion.EJ2.Maps;
@{
    var data = new[]
       {
            new { name= "Australia", population= "383521" },
            new { name= "Pakistan", population= "3090416" },
            new { name= "Russia", population= "30916" }
    };
    var bubble = new List<MapsBubble>
        {
            new MapsBubble { Visible=true, DataSource=data, ValuePath="population",
                           MinRadius=10, MaxRadius=30, Fill="green" ,Opacity=1, AnimationDelay=100, AnimationDuration=1000,
                           Border = new MapsBorder{
                               Color="blue", Width=2, Opacity=1
                           }}
        };
}
<ejs-maps id="maps">
    <e-maps-layers>
        <e-maps-layer shapeData="ViewBag.world_map" shapeDataPath="name" shapePropertyPath='new[] { "name" }' bubbleSettings="bubble">
        </e-maps-layer>
    </e-maps-layers>
</ejs-maps>
using System;
using System.Collections.Generic;
using System.Diagnostics;
using System.Linq;
using System.Threading.Tasks;
using Microsoft.AspNetCore.Mvc;
using EJ2_Core_Application.Models;
using Newtonsoft.Json;
namespace EJ2_Core_Application.Controllers
{
public class HomeController : Controller
{
public IActionResult Index()
{
ViewBag.world_map = GetWorldMap();
ViewBag.worldMap = GetMap();
List<BubbleData> data = new List<BubbleData>
{
new BubbleData { name= "Australia", population= "383521" },
new BubbleData { name= "Pakistan", population= "3090416" },
new BubbleData { name= "Russia", population= "30916" }
};
ViewBag.bubbleData = data;
return View();
}
public object GetWorldMap()
{
string allText = System.IO.File.ReadAllText("./wwwroot/scripts/MapsData/world_map.js");
return JsonConvert.DeserializeObject(allText);
}
public object GetMap()
{
string allText = System.IO.File.ReadAllText(Server.MapPath("~/App_Data/WorldMap.json"));
return JsonConvert.DeserializeObject(allText, typeof(object));
}
public class BubbleData
{
public string name { get; set; }
public string population { get; set; }
}
}
}
Setting colors to the bubbles from the data source
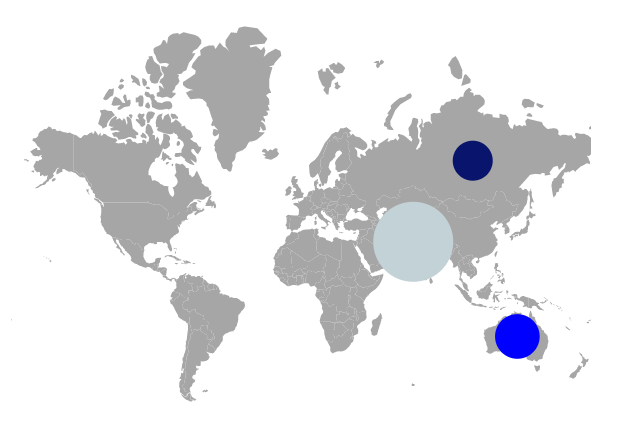
The color for each bubble in the Maps can be set using the ColorValuePath property of MapsBubble. The value for the ColorValuePath property is the field name from the data source of the MapsBubble which contains the color values.
@using Syncfusion.EJ2.Maps;
@{
    var data = new[]
       {
            new { name= "Australia", population= "383521", color="blue" },
            new { name= "Pakistan", population= "3090416", color="#c2d2d6" },
            new { name= "Russia", population= "30916", color="#09156d" }
    };
    var bubble = new List<MapsBubble>
{
            new MapsBubble { Visible=true, DataSource=data, ValuePath="population",
                             MinRadius=20, MaxRadius=40, ColorValuePath="color" }
};
}
<ejs-maps id="maps">
    <e-maps-layers>
        <e-maps-layer shapeData="ViewBag.world_map" shapeDataPath="name" shapePropertyPath='new[] { "name" }' bubbleSettings="bubble">
        </e-maps-layer>
    </e-maps-layers>
</ejs-maps>
using System;
using System.Collections.Generic;
using System.Diagnostics;
using System.Linq;
using System.Threading.Tasks;
using Microsoft.AspNetCore.Mvc;
using EJ2_Core_Application.Models;
using Newtonsoft.Json;
namespace EJ2_Core_Application.Controllers
{
public class HomeController : Controller
{
public IActionResult Index()
{
ViewBag.world_map = GetWorldMap();
ViewBag.worldMap = GetMap();
List<BubbleData> data = new List<BubbleData>
{
new BubbleData { name= "Australia", population= "383521", color="blue" },
new BubbleData { name= "Pakistan", population= "3090416", color="#c2d2d6" },
new BubbleData { name= "Russia", population= "30916", color="#09156d" }
};
ViewBag.bubbleData = data;
return View();
}
public object GetWorldMap()
{
string allText = System.IO.File.ReadAllText("./wwwroot/scripts/MapsData/world_map.js");
return JsonConvert.DeserializeObject(allText);
}
public object GetMap()
{
string allText = System.IO.File.ReadAllText(Server.MapPath("~/App_Data/WorldMap.json"));
return JsonConvert.DeserializeObject(allText, typeof(object));
}
public class BubbleData
{
public string name { get; set; }
public string population { get; set; }
}
}
}
Setting the range of the bubble size
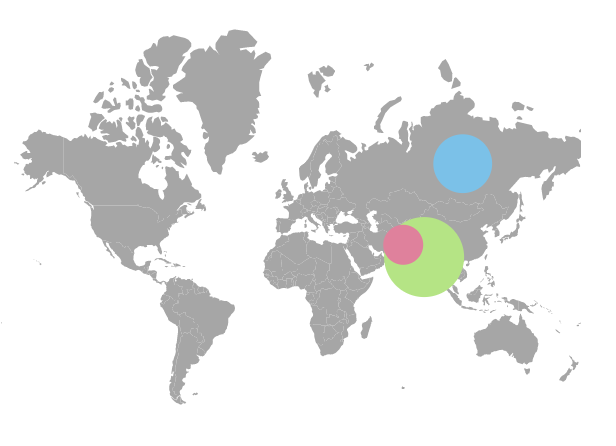
The size of the bubbles is calculated from the values got from the ValuePath property. The range for the radius of the bubbles can be modified using MinRadius and MaxRadius properties.
@{
    var data = new[]
       {
            new { name= "India", population= "38332521" },
            new { name= "Russia", population= "19651127" },
            new { name= "Pakistan", population= "3090416" }
    };
    var bubble = new List<MapsBubble>
{
        new MapsBubble{Visible=true, MinRadius=20, DataSource=data, MaxRadius=40, ValuePath="population"}

    };

}
@using Syncfusion.EJ2.Maps;
@using Syncfusion.EJ2;
<div id="control-section">
    <ejs-maps id="maps">
        <e-maps-layers>
            <e-maps-layer shapeData="ViewBag.world_map" shapeDataPath="name" shapePropertyPath='new[] { "name" }' bubbleSettings="bubble">
            </e-maps-layer>
        </e-maps-layers>
    </ejs-maps>
</div>
using System;
using System.Collections.Generic;
using System.Diagnostics;
using System.Linq;
using System.Threading.Tasks;
using Microsoft.AspNetCore.Mvc;
using EJ2_Core_Application.Models;
using Newtonsoft.Json;
namespace EJ2_Core_Application.Controllers
{
public class HomeController : Controller
{
public IActionResult Index()
{
ViewBag.world_map = GetWorldMap();
ViewBag.worldMap = GetMap();
List<BubbleData> data = new List<BubbleData>
{
new BubbleData { name= "India", population= "38332521" },
new BubbleData { name= "Russia", population= "19651127" },
new BubbleData { name= "Pakistan", population= "3090416" }
};
ViewBag.bubbleData = data;
return View();
}
public object GetWorldMap()
{
string allText = System.IO.File.ReadAllText("./wwwroot/scripts/MapsData/world_map.js");
return JsonConvert.DeserializeObject(allText);
}
public object GetMap()
{
string allText = System.IO.File.ReadAllText(Server.MapPath("~/App_Data/WorldMap.json"));
return JsonConvert.DeserializeObject(allText, typeof(object));
}
public class BubbleData
{
public string name { get; set; }
public string population { get; set; }
}
}
}
Multiple bubble groups
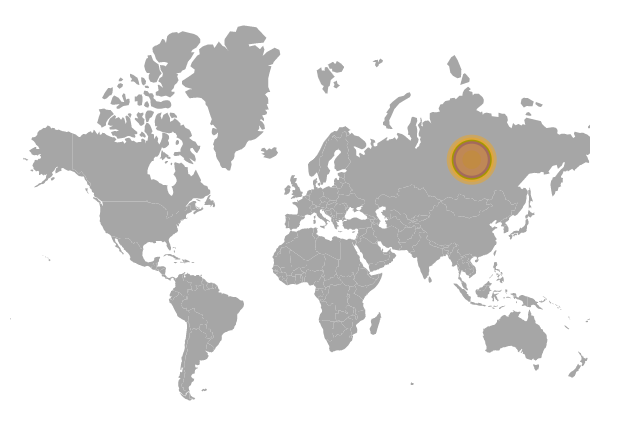
Multiple groups of bubbles can be added in the Maps by adding multiple MapsBubble in the MapsBubbles and customization for the bubbles can be done with the MapsBubble class. In the following example, the gender-wise population ratio is demonstrated with two different bubble groups.
@using Syncfusion.EJ2.Maps;

@{
    var data = new[]
       {
           new { country= "United States", femaleRatio=50.50442726, maleRatio=49.49557274, femaleRatioColor="green", maleRatioColor="blue" },
           new { country= "India", femaleRatio=48.18032713, maleRatio=51.81967287, femaleRatioColor="blue", maleRatioColor="#c2d2d6" },
           new { country= "Oman", femaleRatio=34.15597234, maleRatio=65.84402766, femaleRatioColor="#09156d", maleRatioColor="orange" },
           new { country= "United Arab Emirates", femaleRatio=27.59638942, maleRatio=72.40361058, femaleRatioColor="#09156d", maleRatioColor="orange" }
       };
    var bubbledata = new[]
       {
           new { country= "United States", femaleRatio=50.50442726, maleRatio=49.49557274, femaleRatioColor="green", maleRatioColor="blue" },
           new { country= "India", femaleRatio=48.18032713, maleRatio=51.81967287, femaleRatioColor="blue", maleRatioColor="#c2d2d6" },
           new { country= "Oman", femaleRatio= 34.15597234, maleRatio=65.84402766, femaleRatioColor="#09156d", maleRatioColor="orange" },
           new { country= "United Arab Emirates", femaleRatio= 27.59638942, maleRatio=72.40361058, femaleRatioColor="#09156d", maleRatioColor="orange" }
       };
}
<ejs-maps id="maps">
    <e-maps-layers>
        <e-maps-layer shapeData=" ViewBag.world_map" shapeDataPath="name" shapePropertyPath='new[] { "name" }'>
            <e-layersettings-bubbles>
                <e-layersettings-bubble visible="true" valuePath="femaleRatio" colorValuePath="femaleRatioColor" dataSource="data"
                                        minRadius="5" maxRadius="20"></e-layersettings-bubble>
                <e-layersettings-bubble visible="true" valuePath="maleRatio" colorValuePath="maleRatioColor" dataSource="bubbledata"
                                        minRadius="15" maxRadius="25" bubbleType="Circle" opacity="0.4"></e-layersettings-bubble>
            </e-layersettings-bubbles>
        </e-maps-layer>
    </e-maps-layers>
</ejs-maps>
using System;
using System.Collections.Generic;
using System.Diagnostics;
using System.Linq;
using System.Threading.Tasks;
using Microsoft.AspNetCore.Mvc;
using EJ2_Core_Application.Models;
using Newtonsoft.Json;
namespace EJ2_Core_Application.Controllers
{
public class HomeController : Controller
{
public IActionResult Index()
{
ViewBag.world_map = GetWorldMap();
ViewBag.worldMap = GetMap();
List<BubbleData> data = new List<BubbleData>
{
new BubbleData { country= "United States", femaleRatio=50.50442726, maleRatio=49.49557274, femaleRatioColor="green", maleRatioColor="blue" },
new BubbleData { country= "India", femaleRatio=48.18032713, maleRatio=51.81967287, femaleRatioColor="blue", maleRatioColor="#c2d2d6" },
new BubbleData { country= "Oman", femaleRatio=34.15597234, maleRatio=65.84402766, femaleRatioColor="#09156d", maleRatioColor="orange" },
new BubbleData { country= "United Arab Emirates", femaleRatio=27.59638942, maleRatio=72.40361058, femaleRatioColor="#09156d", maleRatioColor="orange" }
};
List<BubbleData> data1 = new List<BubbleData>
{
new BubbleData { country= "United States", femaleRatio=50.50442726, maleRatio=49.49557274, femaleRatioColor="green", maleRatioColor="blue" },
new BubbleData { country= "India", femaleRatio=48.18032713, maleRatio=51.81967287, femaleRatioColor="blue", maleRatioColor="#c2d2d6" },
new BubbleData { country= "Oman", femaleRatio= 34.15597234, maleRatio=65.84402766, femaleRatioColor="#09156d", maleRatioColor="orange" },
new BubbleData { country= "United Arab Emirates", femaleRatio= 27.59638942, maleRatio=72.40361058, femaleRatioColor="#09156d", maleRatioColor="orange" }
};
ViewBag.bubbleData = data;
ViewBag.bubblesData = data1;
MapsBubble bubble = new MapsBubble();
bubble.Visible = true;
bubble.ValuePath = "femaleRatio";
bubble.ColorValuePath = "femaleRatioColor";
bubble.MinRadius = 5;
bubble.MaxRadius = 20;
bubble.DataSource = ViewBag.bubbleData;
MapsBubble bubble1 = new MapsBubble();
bubble1.Visible = true;
bubble1.ValuePath = "maleRatio";
bubble1.ColorValuePath = "maleRatioColor";
bubble1.MinRadius = 15;
bubble1.MaxRadius = 25;
bubble1.DataSource = ViewBag.bubblesData;
bubble1.BubbleType = Syncfusion.EJ2.Maps.BubbleType.Circle;
bubble1.Opacity = 0.4;
List<MapsBubble> bubbleSettings = new List<MapsBubble>();
bubbleSettings.Add(bubble);
bubbleSettings.Add(bubble1);
ViewBag.bubbleSettings = bubbleSettings;
return View();
}
public object GetWorldMap()
{
string allText = System.IO.File.ReadAllText("./wwwroot/scripts/MapsData/world_map.js");
return JsonConvert.DeserializeObject(allText);
}
public object GetMap()
{
string allText = System.IO.File.ReadAllText(Server.MapPath("~/App_Data/WorldMap.json"));
return JsonConvert.DeserializeObject(allText, typeof(object));
}
public class BubbleData
{
public string country { get; set; }
public double femaleRatio { get; set; }
public double maleRatio { get; set; }
public string femaleRatioColor { get; set; }
public string maleRatioColor { get; set; }
}
}
}
Enable tooltip for bubble
The tooltip for the bubbles can be enabled by setting the Visible property of the MapsTooltipSettings as true. The content for the tooltip can be set using the ValuePath property in the MapsTooltipSettings of the MapsBubble where the value for the ValuePath property is the field name from the data source of the MapsBubble. Any HTML element can be added as the template in tooltip using the Template property.
@using Syncfusion.EJ2.Maps;

@{
    var data = new[]
    {
        new { name= "India", population= "38332521" },
        new { name= "Australia", population= "383521" },
        new { name= "Pakistan", population= "3090416" }
    };
    var tooltip = new MapsTooltipSettings
    {
        Visible = true,
        ValuePath = "population"
    };
}
<ejs-maps id="maps">
    <e-maps-layers>
        <e-maps-layer shapeData=" ViewBag.world_map" shapeDataPath="name" shapePropertyPath='new[] { "name" }'>
            <e-layersettings-bubbles>
                <e-layersettings-bubble visible="true" valuePath="population" dataSource="data"
                                        minRadius="20" maxRadius="40" tooltipSettings="tooltip"></e-layersettings-bubble>
            </e-layersettings-bubbles>
        </e-maps-layer>
    </e-maps-layers>
</ejs-maps>
using System;
using System.Collections.Generic;
using System.Diagnostics;
using System.Linq;
using System.Threading.Tasks;
using Microsoft.AspNetCore.Mvc;
using EJ2_Core_Application.Models;
using Newtonsoft.Json;
namespace EJ2_Core_Application.Controllers
{
public class HomeController : Controller
{
public IActionResult Index()
{
ViewBag.world_map = GetWorldMap();
ViewBag.worldMap = GetMap();
List<BubbleData> data = new List<BubbleData>
{
new BubbleData { name= "India", population= "38332521" },
new BubbleData { name= "Australia", population= "383521" },
new BubbleData { name= "Pakistan", population= "3090416" }
};
ViewBag.bubbleData = data;
return View();
}
public object GetWorldMap()
{
string allText = System.IO.File.ReadAllText("./wwwroot/scripts/MapsData/world_map.js");
return JsonConvert.DeserializeObject(allText);
}
public object GetMap()
{
string allText = System.IO.File.ReadAllText(Server.MapPath("~/App_Data/WorldMap.json"));
return JsonConvert.DeserializeObject(allText, typeof(object));
}
public class BubbleData
{
public string name { get; set; }
public string population { get; set; }
}
}
}