Axis in ASP.NET Core HeatMap Chart Component
HeatMap consists of two axes namely, X-axis and Y-axis that displays the row headers and column headers to plot the data points respectively. You can define the type, format, and other customizing options for both axes in the HeatMap.
Types
There are three different axis types available in the HeatMap, which defines the data type of the axis labels. You can define the axis type by using the valueType property in the HeatMap.
Category axis
Category axis type is used to represent the string values in axis labels.
<ejs-heatmap id='container' dataSource="ViewBag.dataSource">
  <e-heatmap-titlesettings text="Sales Revenue per Employee (in 1000 US$)" textStyle="ViewBag.textStyle">
  </e-heatmap-titlesettings>
  <e-heatmap-xaxis vaueType="Category" labels="ViewBag.xLabels">
  </e-heatmap-xaxis>
  <e-heatmap-yaxis vaueType="Category" labels=" ViewBag.yLabels">
  </e-heatmap-yaxis>
</ejs-heatmap>
public ActionResult Category()
{
ViewBag.textStyle = new
{
size= "15px",
fontWeight= "500",
fontStyle= "Normal",
fontFamily= "Segoe UI"
};
string[] xlabels = new string[12] { "Nancy", "Andrew", "Janet", "Margaret", "Steven", "Michael", "Robert", "Laura", "Anne", "Paul", "Karin", "Mario" };
ViewBag.xLabels = xlabels;
string[] yLabels = new string[6] { "Mon", "Tues", "Wed", "Thurs", "Fri", "Sat" };
ViewBag.yLabels = yLabels;
ViewBag.dataSource = GetDataSource();
return View();
}
private int[,] GetDataSource()
{
int[,] data = new int[,]
{
{73, 39, 26, 39, 94, 0},
{93, 58, 53, 38, 26, 68},
{99, 28, 22, 4, 66, 90},
{14, 26, 97, 69, 69, 3},
{7, 46, 47, 47, 88, 6},
{41, 55, 73, 23, 3, 79},
{56, 69, 21, 86, 3, 33},
{45, 7, 53, 81, 95, 79},
{60, 77, 74, 68, 88, 51},
{25, 25, 10, 12, 78, 14},
{25, 56, 55, 58, 12, 82},
{74, 33, 88, 23, 86, 59}
};
return data;
}Numeric axis
Numeric axis type is used to represent the numeric values in axis labels.
<ejs-heatmap id='container' dataSource="ViewBag.dataSource">
  <e-heatmap-titlesettings text="Sales Revenue per Employee (in 1000 US$)" textStyle="ViewBag.textStyle">
  </e-heatmap-titlesettings>
  <e-heatmap-xaxis vaueType="Numeric" minimum="1" maximum="11">
  </e-heatmap-xaxis>
  <e-heatmap-yaxis vaueType="Numeric" minimum="1" maximum="5">
  </e-heatmap-yaxis>
</ejs-heatmap>
public ActionResult Numeric()
{
ViewBag.textStyle = new
{
size= "15px",
fontWeight= "500",
fontStyle= "Normal",
fontFamily= "Segoe UI"
};
ViewBag.dataSource = GetDataSource();
return View();
}
private int[,] GetDataSource()
{
int[,] data = new int[,]
{
{73, 39, 26, 39, 94, 0},
{93, 58, 53, 38, 26, 68},
{99, 28, 22, 4, 66, 90},
{14, 26, 97, 69, 69, 3},
{7, 46, 47, 47, 88, 6},
{41, 55, 73, 23, 3, 79},
{56, 69, 21, 86, 3, 33},
{45, 7, 53, 81, 95, 79},
{60, 77, 74, 68, 88, 51},
{25, 25, 10, 12, 78, 14},
{25, 56, 55, 58, 12, 82},
{74, 33, 88, 23, 86, 59}
};
return data;
}Date-time axis
Date-time axis type is used to represent the date-time values in axis labels with a specific format. In date-time axis, you can define the start and end date/time using the minimum and maximum properties.
@{
    var Xminimum = new DateTime(2007, 1, 1);
    var Xmaximum = new DateTime(2017, 1, 1);
}

<ejs-heatmap id='container' dataSource="ViewBag.dataSource">
  <e-heatmap-titlesettings text="Monthly Flight Traffic at JFK Airport" textStyle="ViewBag.textStyle">
  </e-heatmap-titlesettings>
  <e-heatmap-xaxis minimum="Xminimum" maximum="Xmaximum" intervalType="Years" valueType="DateTime" labelFormat="yyyy" labelRotation="45" labelIntersectAction="None"></e-heatmap-xaxis>
  <e-heatmap-yaxis labels="ViewBag.yLabels">
  </e-heatmap-yaxis>
  <e-heatmap-cellsettings border="ViewBag.border" showLabel="false" format="{value} flights">
  </e-heatmap-cellsettings>
  <e-heatmap-legendsettings visible="false"></e-heatmap-legendsettings>
</ejs-heatmap>
public ActionResult DateTime()
{
ViewBag.textStyle = new
{
size= "15px",
fontWeight= "500",
fontStyle= "Normal",
fontFamily= "Segoe UI"
};
string[] yLabels = new string[12] { "Jan", "Feb", "Mar", "Apr", "May", "June", "July", "Aug",
"Sep", "Oct", "Nov", "Dec"};
ViewBag.yLabels = yLabels;
ViewBag.border = new { width = 0};
ViewBag.dataSource = GetDataSource();
return View();
}
private int[,] GetDataSource()
{
int[,] data = new int[,]
{
{36371, 25675, 28292, 33399, 35980, 38585, 39351, 39964, 36543, 30529, 33298, 36985},
{34702, 27618, 31063, 34525, 36772, 35410, 38750, 39467, 35390, 34196, 35302, 35703},
{34522, 31324, 32128, 34231, 36817, 34381, 37180, 38255, 32776, 32645, 31539, 32981},
{32213, 28755, 29517, 31214, 33747, 33507, 35763, 36837, 32910, 33437, 30659, 31965},
{31282, 28663, 32952, 33941, 34506, 36875, 38836, 35497, 34285, 34094, 32256, 33699},
{31714, 29405, 33745, 32838, 33461, 35034, 36122, 37943, 34128, 30624, 32398, 33522},
{32064, 28387, 33751, 32537, 34034, 35977, 37196, 38301, 33627, 34115, 31072, 33939},
{32417, 27868, 30807, 33386, 35284, 36126, 39753, 40978, 35777, 35277, 31281, 35411},
{32494, 29848, 34385, 35804, 37943, 38722, 41315, 41335, 37177, 37443, 32457, 37304},
{34378, 29576, 30547, 35664, 36622, 38145, 40347, 41868, 38252, 36505, 29576, 36450},
{35219, 31670, 32589, 34927, 36998, 39825, 41126, 42002, 37021, 36583, 32408, 37108}
};
return data;
}Inversed axis
HeatMap supports inversing the axis origin for both axes, where the axis labels are placed in an inversed manner. You can enable axis inversing by enabling the isInversed property.
@{
    var Xminimum = new DateTime(2007, 1, 1);
    var Xmaximum = new DateTime(2017, 12, 31);
}

<ejs-heatmap id='container' dataSource="ViewBag.dataSource">
  <e-heatmap-titlesettings text="Monthly Flight Traffic at JFK Airport" textStyle=" ViewBag.textStyle">
  </e-heatmap-titlesettings>
 <e-heatmap-xaxis minimum="Xminimum" maximum="Xmaximum" intervalType="Years" valueType="DateTime" labelFormat="yyyyy" labelRotation="45" labelIntersectAction="None" isInversed="true"></e-heatmap-xaxis>
  <e-heatmap-yaxis labels="ViewBag.yLabels">
  </e-heatmap-yaxis>
  <e-heatmap-cellsettings border="ViewBag.border" showLabel="false" format="{value} flights">
  </e-heatmap-cellsettings>
  <e-heatmap-legendsettings visible="false"></e-heatmap-legendsettings>
</ejs-heatmap>
public ActionResult Inversed()
{
ViewBag.textStyle = new
{
size= "15px",
fontWeight= "500",
fontStyle= "Normal",
fontFamily= "Segoe UI"
};
string[] yLabels = new string[12] { "Jan", "Feb", "Mar", "Apr", "May", "June", "July", "Aug",
"Sep", "Oct", "Nov", "Dec"};
ViewBag.yLabels = yLabels;
ViewBag.border = new { width = 0};
ViewBag.dataSource = GetDataSource();
return View();
}
private int[,] GetDataSource()
{
int[,] data = new int[,]
{
{36371, 25675, 28292, 33399, 35980, 38585, 39351, 39964, 36543, 30529, 33298, 36985},
{34702, 27618, 31063, 34525, 36772, 35410, 38750, 39467, 35390, 34196, 35302, 35703},
{34522, 31324, 32128, 34231, 36817, 34381, 37180, 38255, 32776, 32645, 31539, 32981},
{32213, 28755, 29517, 31214, 33747, 33507, 35763, 36837, 32910, 33437, 30659, 31965},
{31282, 28663, 32952, 33941, 34506, 36875, 38836, 35497, 34285, 34094, 32256, 33699},
{31714, 29405, 33745, 32838, 33461, 35034, 36122, 37943, 34128, 30624, 32398, 33522},
{32064, 28387, 33751, 32537, 34034, 35977, 37196, 38301, 33627, 34115, 31072, 33939},
{32417, 27868, 30807, 33386, 35284, 36126, 39753, 40978, 35777, 35277, 31281, 35411},
{32494, 29848, 34385, 35804, 37943, 38722, 41315, 41335, 37177, 37443, 32457, 37304},
{34378, 29576, 30547, 35664, 36622, 38145, 40347, 41868, 38252, 36505, 29576, 36450},
{35219, 31670, 32589, 34927, 36998, 39825, 41126, 42002, 37021, 36583, 32408, 37108}
};
return data;
}Opposed axis
In HeatMap, you can place the axis label in an opposite position of its default axis label position by using the opposedPosition property.
@{
    var Xminimum = new DateTime(2007, 1, 1);
    var Xmaximum = new DateTime(2017, 1, 1);
}

<ejs-heatmap id='container' dataSource="ViewBag.dataSource">
  <e-heatmap-titlesettings text="Monthly Flight Traffic at JFK Airport" textStyle="ViewBag.textStyle">
  </e-heatmap-titlesettings>
 <e-heatmap-xaxis minimum="Xminimum" maximum="Xmaximum" intervalType="Years" valueType="DateTime" labelFormat="yyyy" labelRotation="45" labelIntersectAction="None" opposedPosition="true">
 </e-heatmap-xaxis>
  <e-heatmap-yaxis labels="ViewBag.yLabels">
  </e-heatmap-yaxis>
  <e-heatmap-cellsettings border="ViewBag.border" showLabel="false" format="{value} flights">
  </e-heatmap-cellsettings>
  <e-heatmap-legendsettings visible="false"></e-heatmap-legendsettings>
</ejs-heatmap>
public ActionResult Opposed()
{
ViewBag.textStyle = new
{
size= "15px",
fontWeight= "500",
fontStyle= "Normal",
fontFamily= "Segoe UI"
};
string[] yLabels = new string[12] { "Jan", "Feb", "Mar", "Apr", "May", "June", "July", "Aug",
"Sep", "Oct", "Nov", "Dec"};
ViewBag.yLabels = yLabels;
ViewBag.border = new { width = 0};
ViewBag.dataSource = GetDataSource();
return View();
}
private int[,] GetDataSource()
{
int[,] data = new int[,]
{
{36371, 25675, 28292, 33399, 35980, 38585, 39351, 39964, 36543, 30529, 33298, 36985},
{34702, 27618, 31063, 34525, 36772, 35410, 38750, 39467, 35390, 34196, 35302, 35703},
{34522, 31324, 32128, 34231, 36817, 34381, 37180, 38255, 32776, 32645, 31539, 32981},
{32213, 28755, 29517, 31214, 33747, 33507, 35763, 36837, 32910, 33437, 30659, 31965},
{31282, 28663, 32952, 33941, 34506, 36875, 38836, 35497, 34285, 34094, 32256, 33699},
{31714, 29405, 33745, 32838, 33461, 35034, 36122, 37943, 34128, 30624, 32398, 33522},
{32064, 28387, 33751, 32537, 34034, 35977, 37196, 38301, 33627, 34115, 31072, 33939},
{32417, 27868, 30807, 33386, 35284, 36126, 39753, 40978, 35777, 35277, 31281, 35411},
{32494, 29848, 34385, 35804, 37943, 38722, 41315, 41335, 37177, 37443, 32457, 37304},
{34378, 29576, 30547, 35664, 36622, 38145, 40347, 41868, 38252, 36505, 29576, 36450},
{35219, 31670, 32589, 34927, 36998, 39825, 41126, 42002, 37021, 36583, 32408, 37108}
};
return data;
}Axis labels customization
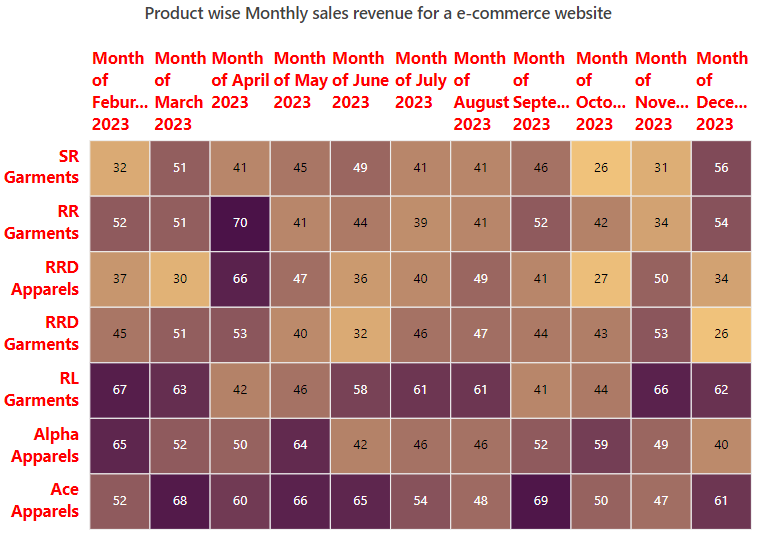
Customizing the text style
The text style of the axis labels can be customized using the following options available in the textStyle property.
- color - It is used to change the text color of the axis labels.
- fontFamily - It is used to change the font family of the axis labels.
- fontStyle - It is used to change the font style of the axis labels.
- fontWeight - It is used to change the font weight of the axis labels.
- size - It is used to change the font size of the axis labels.
- textAlignment - It is used to position and align the axis labels. This property allows you to specify values such as Near, Center, and Far.
- textOverflow - When the axis label exceeds the intended space, this property is used to trim or wrap it. This property takes values such as None, Trim, and Wrap.
<ejs-heatmap id='container' load="window.heatmapLoad" dataSource="ViewBag.dataSource">
    <e-heatmap-titlesettings text="Product wise Monthly sales revenue for a e-commerce website"
        textStyle="ViewBag.textStyle">
    </e-heatmap-titlesettings>
    <e-heatmap-xaxis labels="ViewBag.xLabels" textStyle="ViewBag.axisTextStyle" opposedPosition="true">
    </e-heatmap-xaxis>
    <e-heatmap-yaxis labels="ViewBag.yLabels" textStyle="ViewBag.axisTextStyle" maxLabelLength="70">
    </e-heatmap-yaxis>
    <e-heatmap-palettesettings>
        <e-palettes>
            <e-palette color="#F0C27B"></e-palette>
            <e-palette color="#4B1248"></e-palette>
        </e-palettes>
    </e-heatmap-palettesettings>
    <e-heatmap-legendsettings visible="false"></e-heatmap-legendsettings>
</ejs-heatmap>

<script>
    window.heatmapLoad = function (args) {
        args.heatmap.xAxis.textStyle.textAlignment = "Center";
        args.heatmap.yAxis.textStyle.textAlignment = "Center";
        args.heatmap.xAxis.textStyle.textOverflow = "Wrap";
        args.heatmap.yAxis.textStyle.textOverflow = "Wrap";
    }
</script>
public ActionResult TextStyle()
{
ViewBag.textStyle = new
{
size= "15px",
fontWeight= "500",
fontStyle= "Normal",
fontFamily= "Segoe UI"
};
ViewBag.axisTextStyle = new
{
color="Red",
size= "15px",
fontWeight= "650",
fontStyle= "Normal",
fontFamily= "Segoe UI"
};
string[] xlabels = new string[] { "Month of Feburary 2023", "Month of March 2023", "Month of April 2023", "Month of May 2023", "Month of June 2023", "Month of July 2023", "Month of August 2023", "Month of September 2023", "Month of October 2023", "Month of November 2023", "Month of December 2023" };
ViewBag.xLabels = xlabels;
string[] yLabels = new string[] { "Ace Apparels", "Alpha Apparels", "RL Garments", "RRD Garments", "RRD Apparels", "RR Garments", "SR Garments" };
ViewBag.yLabels = yLabels;
ViewBag.dataSource = GetDataSource();
return View();
}
private double[,] GetDataSource()
{
double[,] dataSource = new double[,]
{
{ 52, 65, 67, 45, 37, 52, 32 },
{ 68, 52, 63, 51, 30, 51, 51 },
{ 60, 50, 42, 53, 66, 70, 41 },
{ 66, 64, 46, 40, 47, 41, 45 },
{ 65, 42, 58, 32, 36, 44, 49 },
{ 54, 46, 61, 46, 40, 39, 41 },
{ 48, 46, 61, 47, 49, 41, 41 },
{ 69, 52, 41, 44, 41, 52, 46 },
{ 50, 59, 44, 43, 27, 42, 26 },
{ 47, 49, 66, 53, 50, 34, 31 },
{ 61, 40, 62, 26, 34, 54, 56 }
};
return dataSource;
}
Providing line breaks
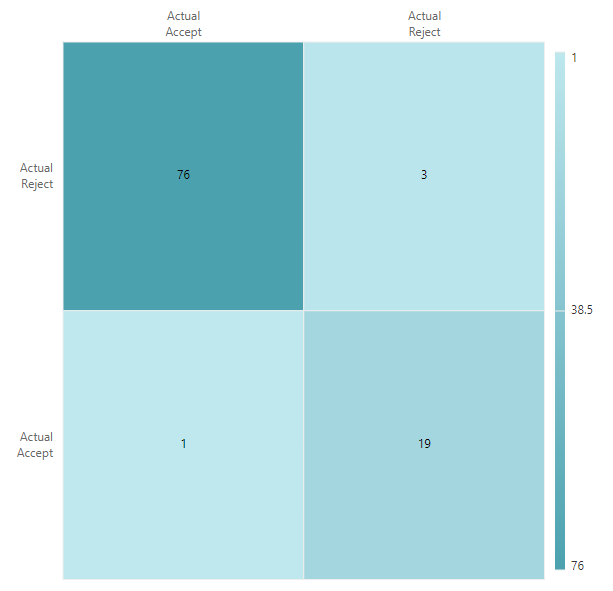
Axis labels with line breaks improve the readability of the HeatMap by splitting the text on an axis into multiple lines. The ”<br>” character is used to add line breaks to the axis labels.
<ejs-heatmap id='container' dataSource="ViewBag.dataSource">
    <e-heatmap-xaxis labels="ViewBag.xLabels" opposedPosition="true">
    </e-heatmap-xaxis>
    <e-heatmap-yaxis labels="ViewBag.yLabels" maxLabelLength="50">
    </e-heatmap-yaxis>
</ejs-heatmap>
public ActionResult TextStyle()
{
string[] xlabels = new string[] { "Actual<br>Accept", "Actual<br>Reject" };
ViewBag.xLabels = xlabels;
string[] yLabels = new string[] { "Actual<br>Accept", "Actual<br>Reject" };
ViewBag.yLabels = yLabels;
ViewBag.dataSource = GetDataSource();
return View();
}
private double[,] GetDataSource()
{
double[,] dataSource = new double[,]
{
{1, 76},
{19, 3}
};
return dataSource;
}
Customizing labels when intersecting with other labels
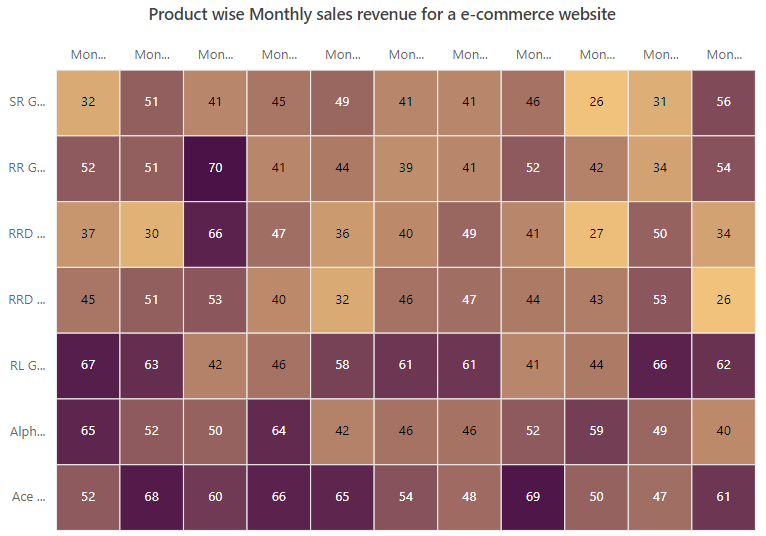
When the axis labels intersect, labelIntersectAction property is used to handle the intersection. The labelIntersectAction property can take the following values.
- None - It specifies that no action is taken when the axis labels intersect.
- Trim - It specifies to trim the axis labels when they intersect.
- Rotate45 - When the axis labels intersect, they are rotated to 45 degrees.
- MultipleRows - It specifies to show all the axis labels as multiple rows when they intersect.
The below example demonstrates to trim the axis labels by using the labelIntersectAction property.
<ejs-heatmap id='container' dataSource="ViewBag.dataSource">
    <e-heatmap-titlesettings text="Product wise Monthly sales revenue for a e-commerce website"
        textStyle="ViewBag.textStyle">
    </e-heatmap-titlesettings>
    <e-heatmap-xaxis labels="ViewBag.xLabels" opposedPosition="true" enableTrim="true"
        labelIntersectAction="LabelIntersectAction.Trim">
    </e-heatmap-xaxis>
    <e-heatmap-yaxis labels="ViewBag.yLabels" enableTrim="true" labelIntersectAction="LabelIntersectAction.Trim">
    </e-heatmap-yaxis>
    <e-heatmap-palettesettings>
        <e-palettes>
            <e-palette color="#F0C27B"></e-palette>
            <e-palette color="#4B1248"></e-palette>
        </e-palettes>
    </e-heatmap-palettesettings>
    <e-heatmap-legendsettings visible="false"></e-heatmap-legendsettings>
</ejs-heatmap>
public ActionResult LabelIntersectAction()
{
ViewBag.textStyle = new
{
size= "15px",
fontWeight= "500",
fontStyle= "Normal",
fontFamily= "Segoe UI"
};
string[] xlabels = new string[] { "Month of Feburary 2023", "Month of March 2023", "Month of April 2023", "Month of May 2023", "Month of June 2023", "Month of July 2023", "Month of August 2023", "Month of September 2023", "Month of October 2023", "Month of November 2023", "Month of December 2023" };
ViewBag.xLabels = xlabels;
string[] yLabels = new string[] { "Ace Apparels", "Alpha Apparels", "RL Garments", "RRD Garments", "RRD Apparels", "RR Garments", "SR Garments" };
ViewBag.yLabels = yLabels;
ViewBag.dataSource = GetDataSource();
return View();
}
private double[,] GetDataSource()
{
double[,] dataSource = new double[,]
{
{ 52, 65, 67, 45, 37, 52, 32 },
{ 68, 52, 63, 51, 30, 51, 51 },
{ 60, 50, 42, 53, 66, 70, 41 },
{ 66, 64, 46, 40, 47, 41, 45 },
{ 65, 42, 58, 32, 36, 44, 49 },
{ 54, 46, 61, 46, 40, 39, 41 },
{ 48, 46, 61, 47, 49, 41, 41 },
{ 69, 52, 41, 44, 41, 52, 46 },
{ 50, 59, 44, 43, 27, 42, 26 },
{ 47, 49, 66, 53, 50, 34, 31 },
{ 61, 40, 62, 26, 34, 54, 56 }
};
return dataSource;
}
Rotating labels
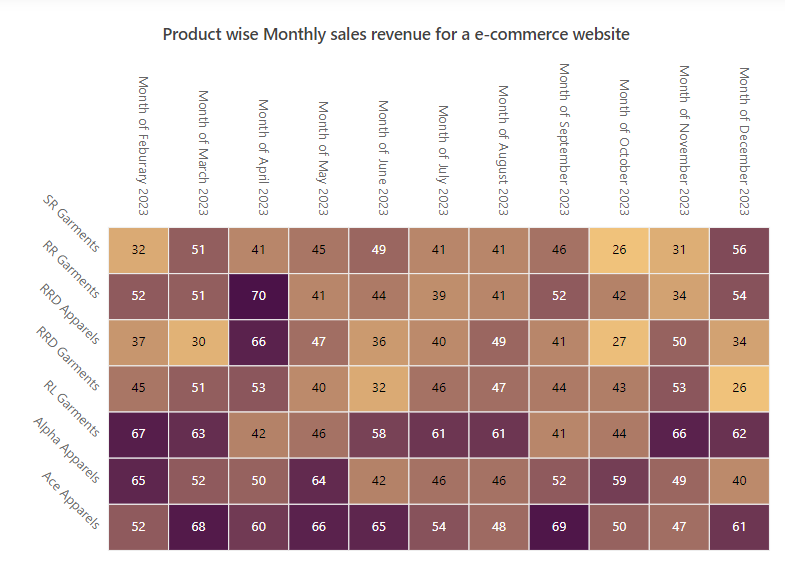
The axis labels can be rotated to the desired angles by using the labelRotation property.
<ejs-heatmap id='container' dataSource="ViewBag.dataSource">
    <e-heatmap-titlesettings text="Product wise Monthly sales revenue for a e-commerce website"
        textStyle="ViewBag.textStyle">
    </e-heatmap-titlesettings>
    <e-heatmap-xaxis labels="ViewBag.xLabels" opposedPosition="true" labelRotation="90">
    </e-heatmap-xaxis>
    <e-heatmap-yaxis labels="ViewBag.yLabels" labelRotation="45">
    </e-heatmap-yaxis>
    <e-heatmap-palettesettings>
        <e-palettes>
            <e-palette color="#F0C27B"></e-palette>
            <e-palette color="#4B1248"></e-palette>
        </e-palettes>
    </e-heatmap-palettesettings>
    <e-heatmap-legendsettings visible="false"></e-heatmap-legendsettings>
</ejs-heatmap>
public ActionResult LabelRotation()
{
ViewBag.textStyle = new
{
size= "15px",
fontWeight= "500",
fontStyle= "Normal",
fontFamily= "Segoe UI"
};
string[] xlabels = new string[] { "Month of Feburary 2023", "Month of March 2023", "Month of April 2023", "Month of May 2023", "Month of June 2023", "Month of July 2023", "Month of August 2023", "Month of September 2023", "Month of October 2023", "Month of November 2023", "Month of December 2023" };
ViewBag.xLabels = xlabels;
string[] yLabels = new string[] { "Ace Apparels", "Alpha Apparels", "RL Garments", "RRD Garments", "RRD Apparels", "RR Garments", "SR Garments" };
ViewBag.yLabels = yLabels;
ViewBag.dataSource = GetDataSource();
return View();
}
private double[,] GetDataSource()
{
double[,] dataSource = new double[,]
{
{ 52, 65, 67, 45, 37, 52, 32 },
{ 68, 52, 63, 51, 30, 51, 51 },
{ 60, 50, 42, 53, 66, 70, 41 },
{ 66, 64, 46, 40, 47, 41, 45 },
{ 65, 42, 58, 32, 36, 44, 49 },
{ 54, 46, 61, 46, 40, 39, 41 },
{ 48, 46, 61, 47, 49, 41, 41 },
{ 69, 52, 41, 44, 41, 52, 46 },
{ 50, 59, 44, 43, 27, 42, 26 },
{ 47, 49, 66, 53, 50, 34, 31 },
{ 61, 40, 62, 26, 34, 54, 56 }
};
return dataSource;
}
Label formatting
HeatMap supports formatting the axis labels by using the labelFormat property. Using this property, you can customize the axis label by global string format (‘P’, ‘C’, etc) or customized format like ‘{value}°C’.
@{
    var Xminimum = new DateTime(2007, 1, 1);
}

<ejs-heatmap id='container' dataSource="ViewBag.dataSource">
 <e-heatmap-titlesettings text="Monthly Flight Traffic at JFK Airport" textStyle=" ViewBag.textStyle">
 </e-heatmap-titlesettings>
 <e-heatmap-xaxis minimum="Xminimum" intervalType="Years" valueType="DateTime" labelFormat="yyyy">
 </e-heatmap-xaxis>
 <e-heatmap-yaxis valueType="Numeric" labelFormat="${value}">
 </e-heatmap-yaxis>
 <e-heatmap-legendsettings visible="false"></e-heatmap-legendsettings>
</ejs-heatmap>
public ActionResult LabelFormat()
{
ViewBag.textStyle = new
{
size= "15px",
fontWeight= "500",
fontStyle= "Normal",
fontFamily= "Segoe UI"
};
ViewBag.dataSource = GetDataSource();
return View();
}
private int[,] GetDataSource()
{
int[,] data = new int[,]
{
{73, 39, 26, 39, 94, 0},
{93, 58, 53, 38, 26, 68},
{99, 28, 22, 4, 66, 90},
{14, 26, 97, 69, 69, 3},
{7, 46, 47, 47, 88, 6},
{41, 55, 73, 23, 3, 79},
{56, 69, 21, 86, 3, 33},
{45, 7, 53, 81, 95, 79},
{60, 77, 74, 68, 88, 51},
{25, 25, 10, 12, 78, 14},
{25, 56, 55, 58, 12, 82},
{74, 33, 88, 23, 86, 59}
};
return data;
}Axis intervals
In HeatMap, you can define an interval between the axis labels using the interval property. In date-time axis, you can change the interval mode by using the intervalType property. The date-time axis supports the following interval types:
- Years
- Months
- Days
- Hours
- Minutes
@{
    var Xminimum = new DateTime(2007, 1, 1);
    var Xmaximum = new DateTime(2017, 1, 1);
}

<ejs-heatmap id='container' dataSource="ViewBag.dataSource">
 <e-heatmap-titlesettings text="Monthly Flight Traffic at JFK Airport" textStyle=" ViewBag.textStyle">
 </e-heatmap-titlesettings>
 <e-heatmap-xaxis minimum="Xminimum" minimum="Xmaximum" intervalType="Years" valueType="DateTime" labelFormat="yyyy" interval="2">
 </e-heatmap-xaxis>
 <e-heatmap-yaxis label=" ViewBag.yLabels">
 </e-heatmap-yaxis>
 <e-heatmap-cellsettings border="ViewBag.border" showLabel="false" format="{value} flights">
  </e-heatmap-cellsettings>
 <e-heatmap-legendsettings visible="false"></e-heatmap-legendsettings>
</ejs-heatmap>
public ActionResult Interval()
{
ViewBag.textStyle = new
{
size= "15px",
fontWeight= "500",
fontStyle= "Normal",
fontFamily= "Segoe UI"
};
string[] yLabels = new string[12] { "Jan", "Feb", "Mar", "Apr", "May", "June", "July", "Aug",
"Sep", "Oct", "Nov", "Dec"};
ViewBag.yLabels = yLabels;
ViewBag.border = new { width = 0};
ViewBag.dataSource = GetDataSource();
return View();
}
private int[,] GetDataSource()
{
int[,] data = new int[,]
{
{36371, 25675, 28292, 33399, 35980, 38585, 39351, 39964, 36543, 30529, 33298, 36985},
{34702, 27618, 31063, 34525, 36772, 35410, 38750, 39467, 35390, 34196, 35302, 35703},
{34522, 31324, 32128, 34231, 36817, 34381, 37180, 38255, 32776, 32645, 31539, 32981},
{32213, 28755, 29517, 31214, 33747, 33507, 35763, 36837, 32910, 33437, 30659, 31965},
{31282, 28663, 32952, 33941, 34506, 36875, 38836, 35497, 34285, 34094, 32256, 33699},
{31714, 29405, 33745, 32838, 33461, 35034, 36122, 37943, 34128, 30624, 32398, 33522},
{32064, 28387, 33751, 32537, 34034, 35977, 37196, 38301, 33627, 34115, 31072, 33939},
{32417, 27868, 30807, 33386, 35284, 36126, 39753, 40978, 35777, 35277, 31281, 35411},
{32494, 29848, 34385, 35804, 37943, 38722, 41315, 41335, 37177, 37443, 32457, 37304},
{34378, 29576, 30547, 35664, 36622, 38145, 40347, 41868, 38252, 36505, 29576, 36450},
{35219, 31670, 32589, 34927, 36998, 39825, 41126, 42002, 37021, 36583, 32408, 37108}
};
return data;
}Axis label increment
Axis label increment in the HeatMap is used to display the axis labels with regular interval values in numeric and date-time axes. The labels will be displayed with tick gaps when you set the label interval. But, to achieve the same behavior without tick gaps, use the label increment. You can set the axis label increment using the increment property and the default value of this property is 1.
<ejs-heatmap id='container' dataSource="ViewBag.dataSource">
 <e-heatmap-xaxis minimum="0" increment="2" valueType="Numeric">
 </e-heatmap-xaxis>
 <e-heatmap-yaxis minimum="0" increment="3" valueType="Numeric">
 </e-heatmap-yaxis>
</ejs-heatmap>
public ActionResult Increment()
{
ViewBag.dataSource = GetDataSource();
return View();
}
private int[,] GetDataSource()
{
int[,] data = new int[,]
{
{73, 39, 26, 39, 94, 0},
{93, 58, 53, 38, 26, 68},
{99, 28, 22, 4, 66, 90},
{14, 26, 97, 69, 69, 3},
{7, 46, 47, 47, 88, 6},
{41, 55, 73, 23, 3, 79},
{56, 69, 21, 86, 3, 33},
{45, 7, 53, 81, 95, 79},
{60, 77, 74, 68, 88, 51},
{25, 25, 10, 12, 78, 14},
{25, 56, 55, 58, 12, 82},
{74, 33, 88, 23, 86, 59}
};
return data;
}Limiting labels in date-time axis
You can display the axis labels at specific time intervals along with the date-time axis using the showLabelOn property. This property supports the following types:
-
None: Displays the axis labels based on the
intervalTypeandintervalproperty of the axis. This type is default value of theshowLabelOnproperty. - Years: Displays the axis labels on every year between given date-time range.
- Months: Displays the axis labels on every month between given date-time range.
- Days: Displays the axis labels on every day between given date-time range.
- Minutes: Displays the axis labels on every minute between given date-time range.
@{
    var Xminimum = new DateTime(2017, 6, 23);
    var Xmaximum = new DateTime(2018, 6, 30);
}

<ejs-heatmap id='container' height="280px" tooltipRender="window.ontooltipRender" dataSource="ViewBag.dataSource">
<e-heatmap-titlesettings text="Summary of merge requests in GitLab" textStyle="ViewBag.textStyle">
</e-heatmap-titlesettings>
<e-heatmap-xaxis opposedPosition="true" minimum="Xminimum" maximum="Xmaximum" intervalType="Days" valueType="DateTime" labelFormat="MMM" showLabelOn="Months" increment="7"></e-heatmap-xaxis>
<e-heatmap-yaxis labels="ViewBag.yLabels" isInversed="true"></e-heatmap-yaxis>
<e-heatmap-palettesettings type="Fixed" emptyPointColor="white">
<e-palettes>
    <e-palette value="0" color="rgb(238,238,238)" label="No contributions"></e-palette>
    <e-palette value="1" color="rgb(172, 213, 242)" label="1-15 contributions"></e-palette>
    <e-palette value="16" color="rgb(127, 168, 201)" label="16-31 contributions"></e-palette>
    <e-palette value="32" color="rgb(82, 123, 160)" label="31-49 contributions"></e-palette>
    <e-palette value="50" color="rgb(37, 78, 119)" label="50+ contributions"></e-palette>
</e-palettes>
</e-heatmap-palettesettings>
<e-heatmap-cellsettings border="ViewBag.border" showLabel="false"></e-heatmap-cellsettings>
<e-heatmap-legendsettings position="Bottom" width="20%" showLabel="true" alignment="Near" labelDisplayType="None" enableSmartLegend="true"></e-heatmap-legendsettings>
</ejs-heatmap>

<script>
    window.ontooltipRender = function (args) {
            var intl = new ej.base.Internationalization();
            var format = intl.getDateFormat({ format: 'EEE MMM dd, yyyy' });
            var newDate = args.xValue;
            var date = new Date(newDate.getTime());
            var axisLabel = args.heatmap.axisCollections[1].axisLabels;
            var index = axisLabel.indexOf(args.yLabel);
            (date).setDate((date).getDate() + index);
            var value = format(date);
            args.content = [(args.value === 0 ? 'No' : args.value) + ' ' + 'contributions' + '<br>' + value];
    }
</script>
public ActionResult ShowLabel()
{
ViewBag.textStyle = new
{
size = "15px",
fontWeight = "500",
fontStyle = "Normal",
fontFamily = "Segoe UI"
};
string[] yLabels = new string[7] { "Sun", "Mon", "Tue", "Wed", "Thu", "Fri", "Sat" };
ViewBag.yLabels = yLabels;
ViewBag.border = new { color = "white" };
ViewBag.dataSource = GetDataSource();
return View();
}
private int[,] GetDataSource()
{
int?[,] dataSource = new int?[,]
{
{ null, null, null, null, 16, 48, 0 },
{0, 15, 0, 24, 0, 39, 0},
{ 0, 18, 37, 0, 0, 50, 0},
{ 0, 10, 0, 0, 44, 5, 0},
{ 0, 36, 0, 45, 20, 18, 0},
{ 0, 28, 1, 42, 0, 10, 0},
{ 0, 16, 32, 0, 1, 25, 0},
{ 0, 31, 2, 9, 24, 0, 0},
{ 0, 8, 47, 0, 0, 35, 0},
{ 0, 31, 0, 0, 0, 40, 0},
{ 0, 8, 0, 27, 0, 35, 0},
{0, 12, 9, 45, 0, 8, 0},
{0, 0, 13, 0, 22, 10, 0},
{0, 16, 32, 0, 1, 25, 0},
{0, 31, 2, 9, 24, 0, 0},
{0, 8, 47, 27, 0, 35, 0},
{0, 28, 14, 10, 0, 0, 0},
{0, 36, 0, 45, 20, 18, 0},
{0, 28, 1, 42, 0, 10, 0},
{0, 31, 0, 24, 0, 40, 0},
{0, 8, 47, 27, 0, 35, 0},
{0, 36, 0, 45, 20, 18, 0},
{0, 28, 1, 42, 0, 10, 0},
{0, 31, 0, 24, 0, 40, 0},
{0, 16, 32, 0, 1, 25, 0},
{0, 31, 2, 9, 24, 0, 0},
{0, 8, 47, 27, 0, 35, 0},
{0, 10, 0, 36, 23, 19, 0},
{0, 18, 37, 23, 0, 50, 0},
{0, 28, 14, 10, 0, 0, 0},
{0, 18, 37, 23, 0, 50, 0},
{0, 18, 37, 23, 0, 50, 0},
{0, 28, 14, 10, 0, 0, 0},
{0, 31, 2, 9, 24, 0, 0},
{0, 8, 47, 27, 0, 35, 0},
{0, 10, 2, 0, 44, 5, 0},
{0, 36, 0, 45, 20, 18, 0},
{0, 28, 1, 42, 0, 10, 0},
{0, 31, 0, 24, 0, 40, 1},
{0, 16, 32, 0, 1, 25, 0},
{0, 31, 2, 9, 24, 0, 0},
{0, 8, 47, 27, 0, 35, 0},
{0, 10, 2, 0, 44, 5, 0},
{0, 12, 9, 45, 0, 8, 0},
{0, 0, 13, 35, 22, 10, 0},
{0, 28, 14, 10, 0, 0, 0},
{0, 36, 0, 45, 20, 18, 2},
{0, 28, 1, 42, 0, 10, 0},
{0, 31, 0, 24, 0, 40, 1},
{0, 8, 47, 27, 0, 35, 0},
{0, 10, 2, 0, 44, 5, 0},
{0, 31, 2, 9, 24, 0, 1},
{0, 8, 47, 27, 0, 35, 40},
{0, 10, 2, 0, 44, 5, null},
};
return data;
}Multilevel Labels
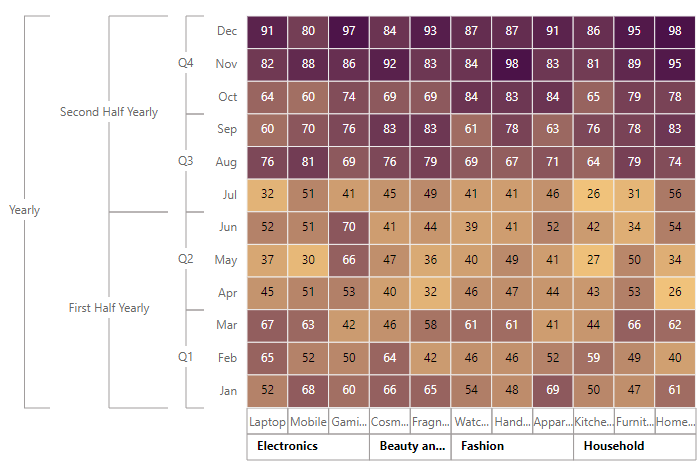
Multilevel labels are used to classify a group of axis labels as a single category, which is then displayed with a label. By using multiLevelLabels, you can add multiple levels on top of the axis labels.
To divide and group the axis labels, you can use multiLevelLabels property. The starting and ending indexes of the axis labels can be set using the start and end properties in the categories. The text property can be used to specify a name for the grouped axis labels.
The multilevel labels can be customized by using the following properties.
- overflow - It is used to trim or wrap the multilevel labels when the label overflows the intended space. NOTE: This property is only for x-axis.
- alignment - It is used to place and align the multilevel labels.
-
maximumTextWidth- It is used to set the maximum width of the text. When the text length exceeds the maximum text width, the overflow action will be performed. - textStyle - It is used to customize the font style of the multilevel labels.
- border - It is used to customize the border of the multilevel labels displayed in the x-axis and y-axis.
@{
    var border = new Syncfusion.EJ2.HeatMap.HeatMapAxisLabelBorder
    {
        Color = "#a19d9d",
        Width = 1,
        Type = BorderType.Rectangle
    };

    var yaxisborder = new Syncfusion.EJ2.HeatMap.HeatMapAxisLabelBorder
    {
       Color = "#a19d9d",
       Width = 1,
       Type = BorderType.Brace
    };
}

<ejs-heatmap id='container' load="window.onHeatmapLoad" dataSource="ViewBag.dataSource">
    <e-heatmap-titlesettings text="Product wise Monthly sales revenue for a e-commerce website"
        textStyle="ViewBag.textStyle">
    </e-heatmap-titlesettings>
    <e-heatmap-xaxis labels="ViewBag.xLabels" border="border">
        <e-xaxis-multilevellabels>
            <e-xaxis-multilevellabel overflow="Trim" alignment="Near" border="border"></e-xaxis-multilevellabel>
        </e-xaxis-multilevellabels>
    </e-heatmap-xaxis>
    <e-heatmap-yaxis labels="ViewBag.yLabels">
        <e-yaxis-multilevellabels>
            <e-yaxis-multilevellabel border="yaxisborder"></e-yaxis-multilevellabel>
            <e-yaxis-multilevellabel border="yaxisborder"></e-yaxis-multilevellabel>
            <e-yaxis-multilevellabel border="yaxisborder"></e-yaxis-multilevellabel>
        </e-yaxis-multilevellabels>
    </e-heatmap-yaxis>
    <e-heatmap-palettesettings>
        <e-palettes>
            <e-palette color="#F0C27B"></e-palette>
            <e-palette color="#4B1248"></e-palette>
        </e-palettes>
    </e-heatmap-palettesettings>
    <e-heatmap-legendsettings visible="false"></e-heatmap-legendsettings>
</ejs-heatmap>

<script type="text/javascript">
    window.onHeatmapLoad = function (args) {
        args.heatmap.xAxis.multiLevelLabels[0].categories = [
            { start: 0, end: 2, text: 'Electronics' },
            { start: 3, end: 4, text: 'Beauty and personal care' },
            { start: 5, end: 7, text: 'Fashion' },
            { start: 8, end: 10, text: 'Household' }
        ];
        args.heatmap.yAxis.multiLevelLabels[0].categories = [
            { start: 0, end: 2, text: 'Q1' },
            { start: 3, end: 5, text: 'Q2' },
            { start: 6, end: 8, text: 'Q3' },
            { start: 9, end: 11, text: 'Q4' }
        ];
        args.heatmap.yAxis.multiLevelLabels[1].categories = [
            { start: 0, end: 5, text: 'First Half Yearly' },
            { start: 6, end: 11, text: 'Second Half Yearly' }
        ];
        args.heatmap.yAxis.multiLevelLabels[2].categories = [
            { start: 0, end: 11, text: 'Yearly' }
        ];
    }
</script>
public ActionResult MultiLevelLabel()
{
ViewBag.textStyle = new
{
size= "15px",
fontWeight= "500",
fontStyle= "Normal",
fontFamily= "Segoe UI"
};
string[] xlabels = new string[] { "Laptop", "Mobile", "Gaming", "Cosmetics", "Fragnance", "Watches", "Handbags", "Apparels", "Kitchenware", "Furniture", "Home Decor" };
ViewBag.xLabels = xlabels;
string[] yLabels = new string[] { "Jan", "Feb", "Mar", "Apr", "May", "Jun", "Jul", "Aug", "Sep", "Oct", "Nov", "Dec" };
ViewBag.yLabels = yLabels;
ViewBag.dataSource = GetDataSource();
return View();
}
private double[,] GetDataSource()
{
double[,] dataSource = new double[,]
{
{52, 65, 67, 45, 37, 52,32, 76, 60, 64, 82, 91 },
{68, 52, 63, 51, 30, 51, 51, 81, 70, 60, 88, 80 },
{60, 50, 42, 53, 66, 70, 41, 69, 76, 74, 86, 97},
{66, 64, 46, 40, 47, 41, 45, 76, 83, 69, 92, 84},
{65, 42, 58, 32, 36, 44, 49, 79, 83, 69, 83, 93},
{54, 46, 61, 46, 40, 39, 41, 69, 61, 84, 84, 87},
{48, 46, 61, 47, 49, 41, 41, 67, 78, 83, 98, 87},
{69, 52, 41, 44, 41, 52, 46, 71, 63, 84, 83, 91},
{50, 59, 44, 43, 27, 42, 26, 64, 76, 65, 81, 86},
{47, 49, 66, 53, 50, 34, 31, 79, 78, 79, 89, 95},
{61, 40, 62, 26, 34, 54, 56, 74, 83, 78, 95, 98}
};
return dataSource;
}