Axis Labels in ASP.NET Core Charts
Smart Axis Labels
When the axis labels overlap with each other, you can use labelIntersectAction property in the axis, to place them smartly.
When setting labelIntersectAction as Hide
<ejs-chart id="container" title="Olympic Medals" width="650">
        <e-chart-primaryxaxis valueType="Category" labelIntersectAction="Hide">
        </e-chart-primaryxaxis>
        <e-series-collection>
            <e-series dataSource="ViewBag.dataSource" xName="x" yName="y" type="@Syncfusion.EJ2.Charts.ChartSeriesType.Column"></e-series>
        </e-series-collection>
    </ejs-chart>
public ActionResult Index()
{
List<AxisLabelData> chartData = new List<AxisLabelData>
{
new AxisLabelData { x= "South Korea", y= 39.4 },
new AxisLabelData { x= "India", y= 61.3 },
new AxisLabelData { x= "Pakistan", y= 20.4 },
new AxisLabelData { x= "Germany", y= 65.1 },
new AxisLabelData { x= "Australia", y= 15.8 },
new AxisLabelData { x= "Italy", y= 29.2 },
new AxisLabelData { x= "United Kingdom", y= 44.6 },
new AxisLabelData { x= "Saudi Arabia", y= 9.7 },
new AxisLabelData { x= "Russia", y= 40.8 },
new AxisLabelData { x= "Mexico", y= 31 },
new AxisLabelData { x= "Brazil", y= 75.9 },
new AxisLabelData { x= "China", y= 51.4 }
};
ViewBag.dataSource = chartData;
return View();
}
public class AxisLabelData
{
public string x;
public double y;
public double y1;
}When setting labelIntersectAction as Rotate45
<ejs-chart id="container" title="Olympic Medals" width="650">
        <e-chart-primaryxaxis valueType="Category" labelIntersectAction="Rotate45">
        </e-chart-primaryxaxis>
        <e-series-collection>
            <e-series dataSource="ViewBag.dataSource" xName="x" yName="y" type="@Syncfusion.EJ2.Charts.ChartSeriesType.Column"></e-series>
        </e-series-collection>
    </ejs-chart>
public ActionResult Index()
{
List<AxisLabelData> chartData = new List<AxisLabelData>
{
new AxisLabelData { x= "South Korea", y= 39.4 },
new AxisLabelData { x= "India", y= 61.3 },
new AxisLabelData { x= "Pakistan", y= 20.4 },
new AxisLabelData { x= "Germany", y= 65.1 },
new AxisLabelData { x= "Australia", y= 15.8 },
new AxisLabelData { x= "Italy", y= 29.2 },
new AxisLabelData { x= "United Kingdom", y= 44.6 },
new AxisLabelData { x= "Saudi Arabia", y= 9.7 },
new AxisLabelData { x= "Russia", y= 40.8 },
new AxisLabelData { x= "Mexico", y= 31 },
new AxisLabelData { x= "Brazil", y= 75.9 },
new AxisLabelData { x= "China", y= 51.4 }
};
ViewBag.dataSource = chartData;
return View();
}
public class AxisLabelData
{
public string x;
public double y;
public double y1;
}When setting labelIntersectAction as Rotate90
<ejs-chart id="container" title="Olympic Medals" width="650">
        <e-chart-primaryxaxis valueType="Category" labelIntersectAction="Rotate90">
        </e-chart-primaryxaxis>
        <e-series-collection>
            <e-series dataSource="ViewBag.dataSource" xName="x" yName="y" type="@Syncfusion.EJ2.Charts.ChartSeriesType.Column"></e-series>
        </e-series-collection>
</ejs-chart>
public ActionResult Index()
{
List<AxisLabelData> chartData = new List<AxisLabelData>
{
new AxisLabelData { x= "South Korea", y= 39.4 },
new AxisLabelData { x= "India", y= 61.3 },
new AxisLabelData { x= "Pakistan", y= 20.4 },
new AxisLabelData { x= "Germany", y= 65.1 },
new AxisLabelData { x= "Australia", y= 15.8 },
new AxisLabelData { x= "Italy", y= 29.2 },
new AxisLabelData { x= "United Kingdom", y= 44.6 },
new AxisLabelData { x= "Saudi Arabia", y= 9.7 },
new AxisLabelData { x= "Russia", y= 40.8 },
new AxisLabelData { x= "Mexico", y= 31 },
new AxisLabelData { x= "Brazil", y= 75.9 },
new AxisLabelData { x= "China", y= 51.4 }
};
ViewBag.dataSource = chartData;
return View();
}
public class AxisLabelData
{
public string x;
public double y;
public double y1;
}Axis Labels Positioning
By default, the axis labels can be placed outside the axis line and this also can be placed inside the axis line using the labelPosition property.
<ejs-chart id="container" title="Olympic Medals" width="650">
        <e-chart-primaryxaxis valueType="Category" labelPosition="Inside">
        </e-chart-primaryxaxis>
        <e-series-collection>
            <e-series dataSource="ViewBag.dataSource" xName="x" yName="y" type="@Syncfusion.EJ2.Charts.ChartSeriesType.Column"></e-series>
        </e-series-collection>
</ejs-chart>
public ActionResult Index()
{
List<AxisLabelData> chartData = new List<AxisLabelData>
{
new AxisLabelData { x= "South Korea", y= 39.4 },
new AxisLabelData { x= "India", y= 61.3 },
new AxisLabelData { x= "Pakistan", y= 20.4 },
new AxisLabelData { x= "Germany", y= 65.1 },
new AxisLabelData { x= "Australia", y= 15.8 },
new AxisLabelData { x= "Italy", y= 29.2 },
new AxisLabelData { x= "United Kingdom", y= 44.6 },
new AxisLabelData { x= "Saudi Arabia", y= 9.7 },
new AxisLabelData { x= "Russia", y= 40.8 },
new AxisLabelData { x= "Mexico", y= 31 },
new AxisLabelData { x= "Brazil", y= 75.9 },
new AxisLabelData { x= "China", y= 51.4 }
};
ViewBag.dataSource = chartData;
return View();
}
public class AxisLabelData
{
public string x;
public double y;
public double y1;
}Multilevel Labels
Any number of levels of labels can be added to an axis using the multiLevelLabels property. This property can be configured using the following properties:
• Categories
• Overflow
• Alignment
• Text style
• Border
Categories
Using the categories property, you can configure the start, end, text, and maximumTextWidth of multilevel labels.
<ejs-chart id="container" width="50%" loaded="onload">
        <e-chart-primaryxaxis valueType="Category"></e-chart-primaryxaxis>
        <e-series-collection>
            <e-series dataSource="ViewBag.dataSource" xName="country" yName="gold" type="@Syncfusion.EJ2.Charts.ChartSeriesType.Column" name="Product X"></e-series>
        </e-series-collection>
    </ejs-chart>
<script>
    onload = function (args) {
        if (args.chart) {
            args.chart.primaryXAxis.multiLevelLabels = [
                {
                    categories: [
                        { start: -0.5, end: 3.5, text: 'Half Yearly 1', },
                        { start: 3.5, end: 7.5, text: 'Half Yearly 2', },
                    ]
                }];
        }
    }
</script>
public ActionResult Index()
{
List<ColumnChartData> chartData = new List<ColumnChartData>
{
new ColumnChartData{ country= "United States", gold=50 },
new ColumnChartData{ country="China", gold=40 },
new ColumnChartData{ country= "Japan", gold=70 },
new ColumnChartData{ country= "Australia", gold=60},
new ColumnChartData{ country= "France", gold=50 },
new ColumnChartData{ country= "Germany", gold=40 },
new ColumnChartData{ country= "Italy", gold=40 },
new ColumnChartData{ country= "Sweden", gold=30 }
};
ViewBag.dataSource = chartData;
return View();
}
public class ColumnChartData
{
public string country;
public double gold;
}Overflow
Using the overflow property, you can trim or wrap the multilevel labels.
<ejs-chart id="container" width="50%" loaded="onload">
        <e-chart-primaryxaxis valueType="Category"></e-chart-primaryxaxis>
        <e-series-collection>
            <e-series dataSource="ViewBag.dataSource" xName="country" yName="gold" type="@Syncfusion.EJ2.Charts.ChartSeriesType.Column" name="Product X"></e-series>
        </e-series-collection>
    </ejs-chart>
<script>
    onload = function (args) {
        if (args.chart) {
            args.chart.primaryXAxis.multiLevelLabels = [
                {
                    categories: [
                        { start: -0.5, end: 3.5, text: 'Half Yearly 1', maximumTextWidth: 50 },
                        { start: 3.5, end: 7.5, text: 'Half Yearly 2', maximumTextWidth: 50 },
                    ],
                    overflow: 'Trim'
              }];
        }
    }
</script>
public ActionResult Index()
{
List<ColumnChartData> chartData = new List<ColumnChartData>
{
new ColumnChartData{ country= "United States", gold=50 },
new ColumnChartData{ country="China", gold=40 },
new ColumnChartData{ country= "Japan", gold=70 },
new ColumnChartData{ country= "Australia", gold=60},
new ColumnChartData{ country= "France", gold=50 },
new ColumnChartData{ country= "Germany", gold=40 },
new ColumnChartData{ country= "Italy", gold=40 },
new ColumnChartData{ country= "Sweden", gold=30 }
};
ViewBag.dataSource = chartData;
return View();
}
public class ColumnChartData
{
public string country;
public double gold;
}Alignment
The alignment property provides option to position the multilevel labels at far, center, or near.
<ejs-chart id="container" width="50%" loaded="onload">
        <e-chart-primaryxaxis valueType="Category"></e-chart-primaryxaxis>
        <e-series-collection>
            <e-series dataSource="ViewBag.dataSource" xName="country" yName="gold" type="@Syncfusion.EJ2.Charts.ChartSeriesType.Column" name="Product X"></e-series>
        </e-series-collection>
    </ejs-chart>
<script>
    onload = function (args) {
        if (args.chart) {
            args.chart.primaryXAxis.multiLevelLabels = [
                {
                    categories: [
                        { start: -0.5, end: 3.5, text: 'Half Yearly 1' },
                        { start: 3.5, end: 7.5, text: 'Half Yearly 2' },
                    ],
                    alignment: 'Far'
              }];
        }
    }
</script>
public ActionResult Index()
{
List<ColumnChartData> chartData = new List<ColumnChartData>
{
new ColumnChartData{ country= "United States", gold=50 },
new ColumnChartData{ country="China", gold=40 },
new ColumnChartData{ country= "Japan", gold=70 },
new ColumnChartData{ country= "Australia", gold=60},
new ColumnChartData{ country= "France", gold=50 },
new ColumnChartData{ country= "Germany", gold=40 },
new ColumnChartData{ country= "Italy", gold=40 },
new ColumnChartData{ country= "Sweden", gold=30 }
};
ViewBag.dataSource = chartData;
return View();
}
public class ColumnChartData
{
public string country;
public double gold;
}Text customization
The textStyle property of multilevel labels provides options to customize the size, color, fontFamily, fontWeight, fontStyle, opacity, textAlignment and textOverflow.
<ejs-chart id="container" width="50%" loaded="onload">
        <e-chart-primaryxaxis valueType="Category"></e-chart-primaryxaxis>
        <e-series-collection>
            <e-series dataSource="ViewBag.dataSource" xName="country" yName="gold" type="@Syncfusion.EJ2.Charts.ChartSeriesType.Column" name="Product X"></e-series>
        </e-series-collection>
    </ejs-chart>
<script>
    onload = function (args) {
        if (args.chart) {
            args.chart.primaryXAxis.multiLevelLabels = [
                {
                    categories: [
                        { start: -0.5, end: 3.5, text: 'Half Yearly 1' },
                        { start: 3.5, end: 7.5, text: 'Half Yearly 2' },
                    ],
                    textStyle: { size: '18px', color: 'Red' }
              }];
        }
    }
</script>
public ActionResult Index()
{
List<ColumnChartData> chartData = new List<ColumnChartData>
{
new ColumnChartData{ country= "United States", gold=50 },
new ColumnChartData{ country="China", gold=40 },
new ColumnChartData{ country= "Japan", gold=70 },
new ColumnChartData{ country= "Australia", gold=60},
new ColumnChartData{ country= "France", gold=50 },
new ColumnChartData{ country= "Germany", gold=40 },
new ColumnChartData{ country= "Italy", gold=40 },
new ColumnChartData{ country= "Sweden", gold=30 }
};
ViewBag.dataSource = chartData;
return View();
}
public class ColumnChartData
{
public string country;
public double gold;
}Border customization
Using the border property, you can customize the width, color, and type. The type of border are Rectangle, Brace, WithoutBorder, WithoutTopBorder, WithoutTopandBottomBorder and CurlyBrace.
<ejs-chart id="container" width="50%" loaded="onload">
        <e-chart-primaryxaxis valueType="Category"></e-chart-primaryxaxis>
        <e-series-collection>
            <e-series dataSource="ViewBag.dataSource" xName="country" yName="gold" type="@Syncfusion.EJ2.Charts.ChartSeriesType.Column" name="Product X"></e-series>
        </e-series-collection>
    </ejs-chart>
<script>
    onload = function (args) {
        if (args.chart) {
            args.chart.primaryXAxis.multiLevelLabels = [
                {
                    categories: [
                        { start: -0.5, end: 3.5, text: 'Half Yearly 1' },
                        { start: 3.5, end: 7.5, text: 'Half Yearly 2' },
                    ],
                    border: { type: 'Brace', color: 'Blue', width: 2 },
              }];
        }
    }
</script>
using System;
using System.Collections.Generic;
using System.Linq;
using System.Web;
using System.Web.Mvc;
using Syncfusion.EJ2.Chart;
namespace EJ2MVCSampleBrowser.Controllers.Chart
{
public partial class ChartController : Controller
{
// GET: MultiLevelLabels
public ActionResult MultiLevelLabels()
{
List<MultiLevelLabelsData> chartData = new List<MultiLevelLabelsData>
{
new MultiLevelLabelsData { x = "Grapes", y = 28 },
new MultiLevelLabelsData { x = "Apples", y = 87 },
new MultiLevelLabelsData { x = "Pears", y = 42 },
new MultiLevelLabelsData { x = "Grapes", y = 13 },
new MultiLevelLabelsData { x = "Apples", y = 13 },
new MultiLevelLabelsData { x = "Pears", y = 10 },
new MultiLevelLabelsData { x = "Tomato", y = 31 },
new MultiLevelLabelsData { x = "Potato", y = 96 },
new MultiLevelLabelsData { x = "Cucumber",y = 41 },
new MultiLevelLabelsData { x = "Onion", y = 59 }
};
ViewBag.dataSource = chartData;
return View();
}
public class MultiLevelLabelsData
{
public string x;
public double y;
}
}
}Edge Label Placement
Labels with long text at the edges of an axis may appear partially in the chart. To avoid this, use edgeLabelPlacement property in axis, which moves the label inside the chart area for better appearance or hides it. By default, the edgeLabelPlacement property is set to Shift to ensure that labels are shifted inside the chart area, avoiding any overlap or coincidence.
<ejs-chart id="container" width="50%">
        <e-chart-primaryxaxis valueType="Category" edgeLabelPlacement="Shift"></e-chart-primaryxaxis>
        <e-series-collection>
            <e-series dataSource="ViewBag.dataSource" xName="country" yName="gold" type="@Syncfusion.EJ2.Charts.ChartSeriesType.Column" name="Product X"></e-series>
        </e-series-collection>
    </ejs-chart>
public ActionResult Index()
{
List<ColumnChartData> chartData = new List<ColumnChartData>
{
new ColumnChartData{ country= "Russia", gold=50 },
new ColumnChartData{ country="China", gold=40 },
new ColumnChartData{ country= "Japan", gold=70 },
new ColumnChartData{ country= "Australia", gold=60},
new ColumnChartData{ country= "France", gold=50 },
new ColumnChartData{ country= "Germany", gold=40 },
new ColumnChartData{ country= "Italy", gold=40 },
new ColumnChartData{ country= "United States", gold=30 }
};
ViewBag.dataSource = chartData;
return View();
}
public class ColumnChartData
{
public string country;
public double gold;
}Labels Customization
The labelStyle property of an axis provides options to customize the color, font-family, font-size and font-weight of the axis labels.
@{
   var border = new { width= 1, type= "Rectangle" , color= "red"};

}
    <ejs-chart id="container" width="50%">
        <e-chart-primaryxaxis valueType="Category" border="border">
        </e-chart-primaryxaxis>
        <e-series-collection>
            <e-series dataSource="ViewBag.dataSource" xName="country" yName="gold" type="@Syncfusion.EJ2.Charts.ChartSeriesType.Column" name="Product X"></e-series>
        </e-series-collection>
    </ejs-chart>
public ActionResult Index()
{
List<ColumnChartData> chartData = new List<ColumnChartData>
{
new ColumnChartData{ country= "Russia", gold=50 },
new ColumnChartData{ country="China", gold=40 },
new ColumnChartData{ country= "Japan", gold=70 },
new ColumnChartData{ country= "Australia", gold=60},
new ColumnChartData{ country= "France", gold=50 },
new ColumnChartData{ country= "Germany", gold=40 },
new ColumnChartData{ country= "Italy", gold=40 },
new ColumnChartData{ country= "United States", gold=30 }
};
ViewBag.dataSource = chartData;
return View();
}
public class ColumnChartData
{
public string country;
public double gold;
}Customizing Specific Point
You can customize the specific text in the axis labels using axisLabelRender event.
<ejs-chart id="container" width="50%" axisLabelRender="axisLabelRender">
        <e-chart-primaryxaxis valueType="Category">
        </e-chart-primaryxaxis>
        <e-series-collection>
            <e-series dataSource="ViewBag.dataSource" xName="country" yName="gold" type="@Syncfusion.EJ2.Charts.ChartSeriesType.Column" name="Product X"></e-series>
        </e-series-collection>
    </ejs-chart>
<script>
    axisLabelRender=function(args) {
        if (args.text === 'France') {
            args.labelStyle.color = 'red';
        }
    }
</script>
public ActionResult Index()
{
List<ColumnChartData> chartData = new List<ColumnChartData>
{
new ColumnChartData{ country= "Russia", gold=50 },
new ColumnChartData{ country="China", gold=40 },
new ColumnChartData{ country= "Japan", gold=70 },
new ColumnChartData{ country= "Australia", gold=60},
new ColumnChartData{ country= "France", gold=50 },
new ColumnChartData{ country= "Germany", gold=40 },
new ColumnChartData{ country= "Italy", gold=40 },
new ColumnChartData{ country= "United States", gold=30 }
};
ViewBag.dataSource = chartData;
return View();
}
public class ColumnChartData
{
public string country;
public double gold;
}Trim using maximum label width
You can trim the label using enableTrim property and width of the labels can also be customized using maximumLabelWidth property in the axis, the value maximum label width is 34 by default.
<ejs-chart id="container" >

<e-chart-primaryxaxis title="Country" valueType="Category" enableTrim="true" maximumLabelWidth="30">
    <e-majorgridlines width="0"></e-majorgridlines>
</e-chart-primaryxaxis>
<e-series-collection>
    <e-series dataSource="ViewBag.dataSource" name="Germany" xName="x" yName="y" type="@Syncfusion.EJ2.Charts.ChartSeriesType.Bar">
    </e-series>
</e-series-collection>
</ejs-chart>
public ActionResult Index()
{
List<CategoryData> chartData = new List<ColumnChartData>
{
new CategoryData { x = "Germany", y = 72, country = "GER: 72"},
new CategoryData { x = "Russia", y = 103.1, country = "RUS: 103.1" },
new CategoryData { x = "Brazil", y = 139.1, country = "BRZ: 139.1" },
new CategoryData { x = "India", y = 462.1, country = "IND: 462.1" },
new CategoryData { x = "China", y = 721.4, country = "CHN: 721.4" },
new CategoryData { x = "United States<br>Of America", y = 286.9, country = "USA: 286.9" },
new CategoryData { x = "Great Britain", y = 115.1, country = "GBR: 115.1" },
new CategoryData { x = "Nigeria", y = 97.2, country = "NGR: 97.2" },
};
ViewBag.dataSource = chartData;
ViewBag.font = new
{
fontWeight = "600",
color = "#ffffff"
};
return View();
}
public class CategoryData
{
public string x;
public double y;
public string country;
}Line break support
Line break feature used to customize the long axis label text into multiple lines by using <br> tag. Refer the following example in that dataSource x value contains long text, it breaks into two lines by using <br> tag.
<ejs-chart id="container" >

<e-chart-primaryxaxis title="Country" valueType="Category" enableTrim="true">
    <e-majorgridlines width="0"></e-majorgridlines>
</e-chart-primaryxaxis>
<e-series-collection>
    <e-series dataSource="ViewBag.dataSource" name="Germany" xName="x" yName="y" type="@Syncfusion.EJ2.Charts.ChartSeriesType.Bar">
    </e-series>
</e-series-collection>
</ejs-chart>
public ActionResult Index()
{
List<CategoryData> chartData = new List<ColumnChartData>
{
new CategoryData { x = "Germany", y = 72, country = "GER: 72"},
new CategoryData { x = "Russia", y = 103.1, country = "RUS: 103.1" },
new CategoryData { x = "Brazil", y = 139.1, country = "BRZ: 139.1" },
new CategoryData { x = "India", y = 462.1, country = "IND: 462.1" },
new CategoryData { x = "China", y = 721.4, country = "CHN: 721.4" },
new CategoryData { x = "United States<br>Of America", y = 286.9, country = "USA: 286.9" },
new CategoryData { x = "Great Britain", y = 115.1, country = "GBR: 115.1" },
new CategoryData { x = "Nigeria", y = 97.2, country = "NGR: 97.2" },
};
ViewBag.dataSource = chartData;
ViewBag.font = new
{
fontWeight = "600",
color = "#ffffff"
};
return View();
}
public class CategoryData
{
public string x;
public double y;
public string country;
}Maximum Labels
MaximumLabels property is set, then the labels will be rendered based on the count in the property per 100 pixel. If you have set range (minimum, maximum, interval) and maximumLabels, then the priority goes to range only. If you haven’t set the range, then priority is considered to be maximumLabels property.
public ActionResult Index()
        {
            return View();

        }
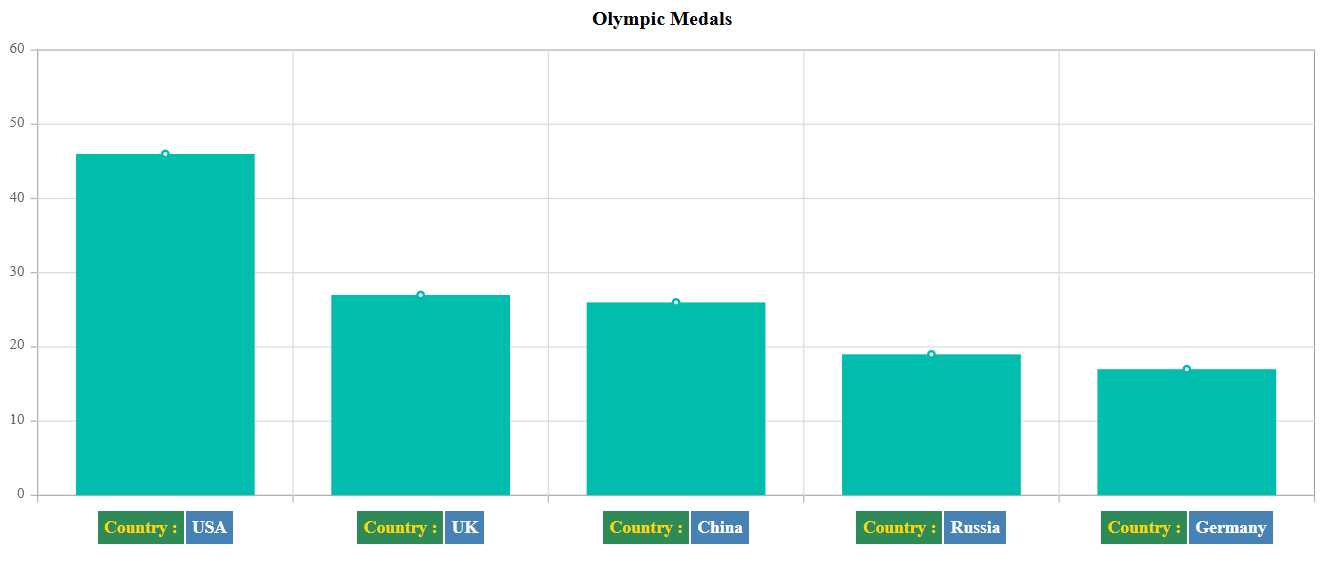
Axis label template
The axis label template allows you to customize axis labels by formatting them with HTML content, applying conditional styling, and including dynamic elements such as icons, images or additional data. This customization is enabled by setting the template content in the labelTemplate property of the ChartAxis.
public ActionResult Index()
        {
            List<ColumnChartData> chartData = new List<ColumnChartData>
            {
                new ColumnChartData{ country: 'USA', gold: 46 },
                new ColumnChartData{ country: 'UK', gold: 27 },
                new ColumnChartData{ country: 'China', gold: 26 },
                new ColumnChartData{ country: 'Russia', gold: 19 },,
                new ColumnChartData{ country: 'Germany', gold: 17 }
            };
            ViewBag.dataSource = chartData;
            return View();
        }
        public class ColumnChartData
        {
            public string country;
            public double gold;
        }