Getting Started with Angular Smith Chart Component
This section explains the steps required to create an Angular Smith Chart and demonstrates the basic usage of the Smith Chart component in an Angular environment.
Note: This guide supports Angular 21 and other recent Angular versions. For detailed compatibility with other Angular versions, please refer to the Angular version support matrix. Starting from Angular 19, standalone components are the default, and this guide reflects that architecture.
Ready to streamline your Syncfusion® Angular development? Discover the full potential of Syncfusion® Angular components with Syncfusion® AI Coding Assistant. Effortlessly integrate, configure, and enhance your projects with intelligent, context-aware code suggestions, streamlined setups, and real-time insights—all seamlessly integrated into your preferred AI-powered IDEs like VS Code, Cursor, Syncfusion® Code Studio, and more. Explore Syncfusion® AI Coding Assistant
Prerequisites
Ensure your development environment meets the System Requirements for Syncfusion® Angular UI Components, which covers supported Node.js, Angular, and @syncfusion/ej2-angular-charts versions.
Set up the Angular application
A straightforward approach to begin with Angular is to create a new application using the Angular CLI. Install the Angular CLI globally with the following command:
npm install -g @angular/cliAngular 21 Standalone Architecture: Standalone components are the default in Angular 21. This guide uses the modern standalone architecture. If you need more information about the standalone architecture, refer to the Standalone Guide.
Install a specific version of Angular CLI
To install a particular version of the Angular CLI, use:
npm install -g @angular/cli@21Create a new application
With the Angular CLI installed, execute the following command to generate a new application:
ng new syncfusion-angular-appThis command will prompt you to configure settings such as enabling Angular routing and choosing a stylesheet format. Select the options that best match your project requirements.
? Which stylesheet format would you like to use? (Use arrow keys)
> CSS             [ https://developer.mozilla.org/docs/Web/CSS                     ]
  Sass (SCSS)     [ https://sass-lang.com/documentation/syntax#scss                ]
  Sass (Indented) [ https://sass-lang.com/documentation/syntax#the-indented-syntax ]
  Less            [ http://lesscss.org                                             ]
By default, a CSS-based application is created. Use SCSS if required:
ng new syncfusion-angular-app --style=scssDuring project setup, when prompted for the Server-Side Rendering (SSR) option, choose the appropriate configuration based on your project requirements.

When prompted to select an AI tool, select the required AI tool or choose none if you do not need any AI tool.
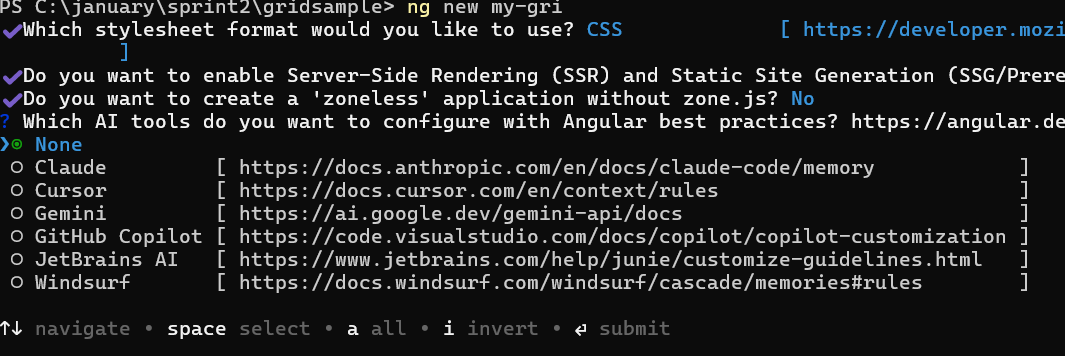
Navigate to your newly created application directory:
cd syncfusion-angular-appNote: In Angular 19 and below, the CLI generates files like
app.component.ts,app.component.html, andapp.component.css. In Angular 20 and above, the CLI generates a simpler structure withsrc/app/app.ts,app.html, andapp.css(without the.component.suffix). The code examples in this guide use the Angular 20+ file layout.
Installing Syncfusion® Smith Chart package
Syncfusion®’s Angular component packages are available on npmjs.com. To use Syncfusion® Angular components, install the necessary package.
This guide uses the Angular Smith Chart component for demonstration. The Smith Chart is shipped as part of the broader Syncfusion Angular Charts package. Add the package to your application with:
ng add @syncfusion/ej2-angular-chartsThe above command performs the following configurations:
- Adds the
@syncfusion/ej2-angular-chartspackage and its peer dependencies to yourpackage.json. - Import the Smith Chart component in your application.
The
ng addschematic does not automatically import components intoapp.component.ts; you still need to add the imports manually as shown in the next section.
For more details on version compatibility, refer to the Version Compatibility section.
Syncfusion® offers two package structures for Angular components:
- Ivy library distribution package format
- Angular compatibility compiler (ngcc), which is Angular’s legacy compilation pipeline.
Syncfusion®’s latest Angular packages are provided as Ivy-compatible and suited for Angular 12 and above. To install the package, execute:
ng add @syncfusion/ej2-angular-chartsFor applications not compiled with Ivy, use the ngcc tagged packages:
The ngcc packages are still compatible with Angular CLI versions 15 and below. However, they may generate warnings suggesting the use of Ivy compiled packages. Starting from Angular 16, support for the ngcc package has been completely removed. If you have further questions regarding ngcc compatibility, please refer to the following FAQ.
npm add @syncfusion/[email protected]Add the Smith Chart component
Update the contents of src/app/app.ts (or src/app/app.component.ts for Angular 19 and below) as shown below. The component imports SmithchartModule from @syncfusion/ej2-angular-charts, declares the selector app-root, and renders an empty Smith Chart in the template.
import { SmithchartModule } from '@syncfusion/ej2-angular-charts';
import { Component, ViewEncapsulation } from '@angular/core';

@Component({
    imports: [
        SmithchartModule
    ],
    standalone: true,
    selector: 'app-root',
    // Specifies the template string for the Smith Chart component
    template: `<ejs-smithchart id='container'></ejs-smithchart>`,
    encapsulation: ViewEncapsulation.None
})
export class AppComponent  { }
The default index.html (located at src/index.html) already contains an <app-root></app-root> element in its <body>, so no manual change is required for the default Angular project layout. If you have customized the bootstrap selector, ensure the selector in @Component matches the element used in index.html.
<app-root></app-root>The following example shows a basic Smith Chart rendered with the code above.
import { Component } from '@angular/core';
import { SmithchartModule, TooltipRenderService, SmithchartLegendService } from '@syncfusion/ej2-angular-charts';

@Component({
    imports: [SmithchartModule],
    providers: [TooltipRenderService, SmithchartLegendService],
    standalone: true,
    selector: 'app-container',
    // Specifies the template string for the Smith Chart component
    template: `<ejs-smithchart id="smithchart-container" height='350px'></ejs-smithchart>`
})
export class AppComponent {

}
import { bootstrapApplication } from '@angular/platform-browser';
import { AppComponent } from './app.component';
import 'zone.js';
bootstrapApplication(AppComponent).catch((err) => console.error(err));Run the application
After the configuration is complete, run the following command to launch the development server and open the application in your default browser:
npm startModule Injection
Syncfusion® Smith Chart features are exposed as injectable services. To use a particular feature, add its service to the providers array of the component. In the following sections you will extend the basic Smith Chart to visualize transmission lines; that example uses the tooltip and legend features. The relevant service names and descriptions are listed below.
-
SmithchartLegendService- Inject this provider to use the legend feature. -
TooltipRenderService- Inject this provider to use the tooltip feature.
Inject these services in the providers array of the standalone component, as shown below.
import { Component } from '@angular/core';
import { SmithchartModule, SmithchartLegendService, TooltipRenderService } from '@syncfusion/ej2-angular-charts';

@Component({
    imports: [
        SmithchartModule
    ],
    standalone: true,
    selector: 'app-root',
    template: `<ejs-smithchart id='container'></ejs-smithchart>`,
    encapsulation: ViewEncapsulation.None,
    providers: [ SmithchartLegendService, TooltipRenderService ]
})
export class AppComponent  { }
For a complete list of available Smith Chart services, refer to the Smith Chart API reference.
Add series to the Smith Chart
The Smith Chart supports two ways to bind data to a series.
-
dataSource- Bind a data object directly by specifyingresistanceandreactancefield names to add a series. -
points- Bind a collection of objects containingresistanceandreactancevalues directly to render a series.
The following sample demonstrates adding two series to the Smith Chart using both approaches.
- The first series, Transmission1, uses the
dataSourcebinding. - The second series, Transmission2, uses the
pointsbinding.
Update the app.component.ts file as shown below to add the series data and template bindings.
import { Component } from '@angular/core';
import { SmithchartModule, TooltipRenderService, SmithchartLegendService } from '@syncfusion/ej2-angular-charts';

@Component({
    imports: [SmithchartModule],
    providers: [TooltipRenderService, SmithchartLegendService],
    standalone: true,
    selector: 'app-container',
    template: `<ejs-smithchart style='display: block;' id='container' height='350px'>
        <e-seriesCollection>
            <e-series [dataSource]='seriesdata1' name='Transmission1' reactance='reactance' resistance='resistance'></e-series>
            <e-series [points]='seriespoints' name='Transmission2'></e-series>
        </e-seriesCollection>
    </ejs-smithchart>`
})
export class AppComponent {
    public seriesdata1: object[] = [
        { resistance: 0, reactance: 0.05 }, { resistance: 0, reactance: 0.05 },
        { resistance: 0, reactance: 0.05 }, { resistance: 0, reactance: 0.05 },
        { resistance: 0, reactance: 0.05 }, { resistance: 0, reactance: 0.05 },
        { resistance: 0, reactance: 0.05 }, { resistance: 0, reactance: 0.05 },
        { resistance: 0, reactance: 0.05 }, { resistance: 0, reactance: 0.05 },
        { resistance: 0.3, reactance: 0.1 }, { resistance: 0.5, reactance: 0.2 },
        { resistance: 1.5, reactance: 0.5 }, { resistance: 2.0, reactance: 0.5 },
        { resistance: 2.5, reactance: 0.4 }, { resistance: 3.5, reactance: 0.0 },
        { resistance: 2.5, reactance: 0.4 }, { resistance: 3.5, reactance: 0.0 },
        { resistance: 2.5, reactance: 0.4 }, { resistance: 3.5, reactance: 0.0 },
        { resistance: 4.5, reactance: -0.5 }, { resistance: 5.0, reactance: -1.0 }
    ];
    public seriespoints: object[] = [
        { resistance: 0, reactance: 0.15 }, { resistance: 0, reactance: 0.15 },
        { resistance: 0, reactance: 0.15 }, { resistance: 0.3, reactance: 0.2 },
        { resistance: 0.3, reactance: 0.2 }, { resistance: 0.3, reactance: 0.2 },
        { resistance: 0.3, reactance: 0.2 }, { resistance: 0.3, reactance: 0.2 },
        { resistance: 0.5, reactance: 0.4 }, { resistance: 1.0, reactance: 0.8 },
        { resistance: 2.5, reactance: 1.3 }, { resistance: 3.5, reactance: 1.6 },
        { resistance: 3.5, reactance: 1.6 }, { resistance: 3.5, reactance: 1.6 },
        { resistance: 4.5, reactance: 2.0 }, { resistance: 6.0, reactance: 4.5 },
        { resistance: 8, reactance: 6 }, { resistance: 10, reactance: 25 }
    ];
}
import { bootstrapApplication } from '@angular/platform-browser';
import { AppComponent } from './app.component';
import 'zone.js';
bootstrapApplication(AppComponent).catch((err) => console.error(err));Troubleshooting
- If the Smith Chart does not render, confirm that
SmithchartModuleis listed in theimportsarray of the standalone component and that the development server has been restarted after package installation. - If features such as legend or tooltip do not appear, ensure the corresponding service (
SmithchartLegendServiceorTooltipRenderService) is added to theprovidersarray. - If you encounter
Cannot find module '@syncfusion/ej2-angular-charts'errors, verify that the package is listed inpackage.jsonand runnpm installto refreshnode_modules. - For build errors related to the
ngccpackage on Angular 16+, switch to the standard Ivy-compatible package by runningnpm install @syncfusion/ej2-angular-charts@latest.
See also
- Explore additional Smith Chart topics: Axis, Dimensions, Legend, Markers, Series, Tooltip, Print and Export, and Accessibility.
- Learn how to work with data in the Smith Chart.
- See the full Smith Chart API reference.