Vertical Chart in Angular Charts
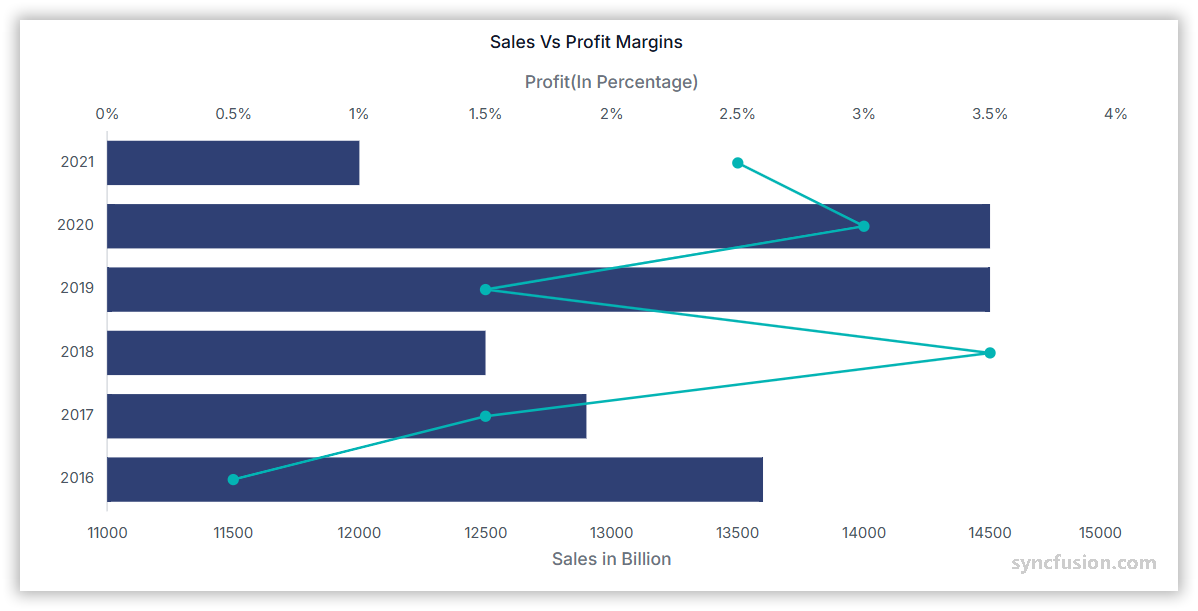
Vertical Chart
To draw a chart in a vertical manner, change the orientation of the axes using the isTransposed property. The property is supported by all series types and works with the @syncfusion/ej2-angular-charts package.
Configure a vertical chart as follows:
-
Set the series type: Define the series
typefor the series you want to render vertically (the example below usesSpline). -
Register the service: Register
SplineSeriesService(and any required axis services) in the moduleprovidersarray, or inApplicationConfig.providersfor standalone applications. Confirm thatChartModuleis imported. -
Bind the data and apply the transpose flag: Bind data with
dataSourceand map the fields withxNameandyName. Add theisTransposed='true'attribute on the<ejs-chart>element to transpose the axes.
import { ChartModule, CategoryService, SplineSeriesService } from '@syncfusion/ej2-angular-charts';
import { Component, OnInit } from '@angular/core';
import { chartData } from './datasource';

@Component({
    imports: [ChartModule],
    providers: [CategoryService, SplineSeriesService],
    standalone: true,
    selector: 'app-container',
    template: `<ejs-chart id="chart-container" [primaryXAxis]='primaryXAxis' [primaryYAxis]='primaryYAxis' [title]='title' isTransposed='true'>
        <e-series-collection>
            <e-series [dataSource]='chartData' type='Spline' xName='x' yName='y' name='London' [width]='2' [marker]='marker'></e-series>
        </e-series-collection>
    </ejs-chart>`
})
export class AppComponent implements OnInit {
    public primaryXAxis?: Object;
    public chartData?: Object[];
    public title?: string;
    public primaryYAxis?: Object;
    public marker?: Object;
    ngOnInit(): void {
        this.chartData = chartData;
        this.primaryXAxis = {
           title: 'Month',
           valueType: 'Category'
        };
        this.marker = { visible: true, width: 10, height: 10 };
        this.primaryYAxis = {
            minimum: -5, maximum: 35, interval: 5,
            title: 'Temperature in Celsius',
            labelFormat: '{value}C'
        };
        this.title = 'Climate Graph-2012';
    }

}
import { bootstrapApplication } from '@angular/platform-browser';
import { AppComponent } from './app.component';
import 'zone.js';
bootstrapApplication(AppComponent).catch((err) => console.error(err));export let chartData: Object[] = [
{ x: 'Jan', y: -1 }, { x: 'Feb', y: -1 },
{ x: 'Mar', y: 2 }, { x: 'Apr', y: 8 },
{ x: 'May', y: 13 }, { x: 'Jun', y: 18 },
{ x: 'Jul', y: 21 }, { x: 'Aug', y: 20 },
{ x: 'Sep', y: 16 }, { x: 'Oct', y: 10 },
{ x: 'Nov', y: 4 }, { x: 'Dec', y: 0 }
];Empty points
A data point whose mapped value is null or undefined is empty. Configure its behavior with emptyPointSettings.mode.
Mode
Use mode to control empty-point rendering. The default is Gap.
| Mode | Visual behavior |
|---|---|
Gap |
Skip the empty point; the remaining bars are still rendered. |
Zero |
Treat the empty point as 0 and render a flat bar. |
Drop |
Drop the empty bar; subsequent points are still rendered. |
Average |
Replace the empty value with the average of the surrounding points. |
import { ChartModule, CategoryService, SplineSeriesService } from '@syncfusion/ej2-angular-charts';
import { Component, OnInit } from '@angular/core';
import { chartData } from './datasource';

@Component({
    imports: [ChartModule],
    providers: [CategoryService, SplineSeriesService],
    standalone: true,
    selector: 'app-container',
    template: `<ejs-chart id="chart-container" [primaryXAxis]='primaryXAxis' [primaryYAxis]='primaryYAxis' [title]='title' isTransposed='true'>
        <e-series-collection>
            <e-series [dataSource]='chartData' type='Spline' xName='x' yName='y' name='London' [width]='2' [marker]='marker' [emptyPointSettings]='emptyPointSettings'></e-series>
        </e-series-collection>
    </ejs-chart>`
})
export class AppComponent implements OnInit {
    public primaryXAxis?: Object;
    public chartData?: Object[];
    public title?: string;
    public primaryYAxis?: Object;
    public emptyPointSettings?: Object;
    public marker?: Object;
    ngOnInit(): void {
        this.chartData = chartData;
        this.primaryXAxis = {
           title: 'Month',
           valueType: 'Category'
        };
        this.marker = { visible: true, width: 10, height: 10 };
        this.primaryYAxis = {
            minimum: -5, maximum: 35, interval: 5,
            title: 'Temperature in Celsius',
            labelFormat: '{value}C'
        };
        this.title = 'Climate Graph-2012';
        this.emptyPointSettings = {
            mode: 'Zero'
        }
    }

}
import { bootstrapApplication } from '@angular/platform-browser';
import { AppComponent } from './app.component';
import 'zone.js';
bootstrapApplication(AppComponent).catch((err) => console.error(err));export let chartData: Object[] = [
{ x: 'Jan', y: -1 }, { x: 'Feb', y: -1 },
{ x: 'Mar', y: 2 }, { x: 'Apr', y: null },
{ x: 'May', y: 13 }, { x: 'Jun', y: 18 },
{ x: 'Jul', y: 21 }, { x: 'Aug', y: 20 },
{ x: 'Sep', y: undefined }, { x: 'Oct', y: 10 },
{ x: 'Nov', y: 4 }, { x: 'Dec', y: 0 }
];Empty-point fill
Use emptyPointSettings.fill to customize the fill color of empty-point bars.
import { ChartModule, CategoryService, SplineSeriesService } from '@syncfusion/ej2-angular-charts';
import { Component, OnInit } from '@angular/core';
import { chartData } from './datasource';

@Component({
    imports: [ChartModule],
    providers: [CategoryService, SplineSeriesService],
    standalone: true,
    selector: 'app-container',
    template: `<ejs-chart id="chart-container" [primaryXAxis]='primaryXAxis' [primaryYAxis]='primaryYAxis' [title]='title' isTransposed='true'>
        <e-series-collection>
            <e-series [dataSource]='chartData' type='Spline' xName='x' yName='y' name='London' [width]='2' [marker]='marker' [emptyPointSettings]='emptyPointSettings'></e-series>
        </e-series-collection>
    </ejs-chart>`
})
export class AppComponent implements OnInit {
    public primaryXAxis?: Object;
    public chartData?: Object[];
    public title?: string;
    public primaryYAxis?: Object;
    public emptyPointSettings?: Object;
    public marker?: Object;
    ngOnInit(): void {
        this.chartData = chartData;
        this.primaryXAxis = {
           title: 'Month',
           valueType: 'Category'
        };
        this.marker = { visible: true, width: 10, height: 10 };
        this.primaryYAxis = {
            minimum: -5, maximum: 35, interval: 5,
            title: 'Temperature in Celsius',
            labelFormat: '{value}C'
        };
        this.title = 'Climate Graph-2012';
        this.emptyPointSettings = {
            mode: 'Average',
            fill: 'red'
        };
    }
}
import { bootstrapApplication } from '@angular/platform-browser';
import { AppComponent } from './app.component';
import 'zone.js';
bootstrapApplication(AppComponent).catch((err) => console.error(err));export let chartData: Object[] = [
{ x: 'Jan', y: -1 }, { x: 'Feb', y: -1 },
{ x: 'Mar', y: 2 }, { x: 'Apr', y: null },
{ x: 'May', y: 13 }, { x: 'Jun', y: 18 },
{ x: 'Jul', y: 21 }, { x: 'Aug', y: 20 },
{ x: 'Sep', y: undefined }, { x: 'Oct', y: 10 },
{ x: 'Nov', y: 4 }, { x: 'Dec', y: 0 }
];Empty-point border
Use border to customize the width and color of the border for empty-point bars.
import { ChartModule, CategoryService, SplineSeriesService } from '@syncfusion/ej2-angular-charts';
import { Component, OnInit } from '@angular/core';
import { chartData } from './datasource';

@Component({
    imports: [ChartModule],
    providers: [CategoryService, SplineSeriesService],
    standalone: true,
    selector: 'app-container',
    template: `<ejs-chart id="chart-container" [primaryXAxis]='primaryXAxis'[primaryYAxis]='primaryYAxis' [title]='title' isTransposed='true'>
        <e-series-collection>
            <e-series [dataSource]='chartData' type='Spline' xName='x' yName='y' name='London' width=2 [marker]='marker' [emptyPointSettings]='emptyPointSettings'></e-series>
        </e-series-collection>
    </ejs-chart>`
})
export class AppComponent implements OnInit {
    public primaryXAxis?: Object;
    public chartData?: Object[];
    public title?: string;
    public primaryYAxis?: Object;
    public emptyPointSettings?: Object;
    public marker?: Object;
    ngOnInit(): void {
        this.chartData = chartData;
        this.primaryXAxis = {
           title: 'Month',
           valueType: 'Category'
        };
        this.marker = { visible: true, width: 10, height: 10 };
        this.primaryYAxis = {
            minimum: -5, maximum: 35, interval: 5,
            title: 'Temperature in Celsius',
            labelFormat: '{value}C'
        };
        this.title = 'Climate Graph-2012';
        this.emptyPointSettings = {
            mode: 'Average',
            fill: 'red',
            border: { width: 2, color: 'green' }
        };
    }

}
import { bootstrapApplication } from '@angular/platform-browser';
import { AppComponent } from './app.component';
import 'zone.js';
bootstrapApplication(AppComponent).catch((err) => console.error(err));export let chartData: Object[] = [
{ x: 'Jan', y: -1 }, { x: 'Feb', y: -1 },
{ x: 'Mar', y: 2 }, { x: 'Apr', y: null },
{ x: 'May', y: 13 }, { x: 'Jun', y: 18 },
{ x: 'Jul', y: 21 }, { x: 'Aug', y: 20 },
{ x: 'Sep', y: undefined }, { x: 'Oct', y: 10 },
{ x: 'Nov', y: 4 }, { x: 'Dec', y: 0 }
];Events
Series render
The seriesRender event allows you to customize series properties, such as data, fill, and name, before they are rendered on the chart. The callback receives an ISeriesRenderEventArgs argument that exposes mutable series and data properties.
<ejs-chart (seriesRender)="onSeriesRender($event)"></ejs-chart>import { ISeriesRenderEventArgs } from '@syncfusion/ej2-charts';
import { ChartModule, CategoryService, SplineSeriesService } from '@syncfusion/ej2-angular-charts';
import { Component, OnInit } from '@angular/core';
import { chartData } from './datasource';
@Component({
imports: [ChartModule],
providers: [CategoryService, SplineSeriesService],
standalone: true,
selector: 'app-container',
template: `<ejs-chart id="chart-container" (seriesRender)='seriesRender($event)' [primaryXAxis]='primaryXAxis' [primaryYAxis]='primaryYAxis' [title]='title' isTransposed='true'>
<e-series-collection>
<e-series [dataSource]='chartData' type='Spline' xName='x' yName='y' name='London' width=2 [marker]='marker'></e-series>
</e-series-collection>
</ejs-chart>`
})
export class AppComponent implements OnInit {
public primaryXAxis?: Object;
public chartData?: Object[];
public title?: string;
public primaryYAxis?: Object;
public marker?: Object;
ngOnInit(): void {
this.chartData = chartData;
this.primaryXAxis = {
title: 'Month',
valueType: 'Category'
};
this.marker = { visible: true, width: 10, height: 10 };
this.primaryYAxis = {
minimum: -5, maximum: 35, interval: 5,
title: 'Temperature in Celsius',
labelFormat: '{value}C'
};
this.title = 'Climate Graph-2012';
}
public seriesRender(args: ISeriesRenderEventArgs): void {
args.fill = '#ff6347';
}
}import { bootstrapApplication } from '@angular/platform-browser';
import { AppComponent } from './app.component';
import 'zone.js';
bootstrapApplication(AppComponent).catch((err) => console.error(err));export let chartData: Object[] = [
{ x: 'Jan', y: -1 }, { x: 'Feb', y: -1 },
{ x: 'Mar', y: 2 }, { x: 'Apr', y: 8 },
{ x: 'May', y: 13 }, { x: 'Jun', y: 18 },
{ x: 'Jul', y: 21 }, { x: 'Aug', y: 20 },
{ x: 'Sep', y: 16 }, { x: 'Oct', y: 10 },
{ x: 'Nov', y: 4 }, { x: 'Dec', y: 0 }
];Point render
The pointRender event allows you to customize each data point before it is rendered on the chart. The callback receives an IPointRenderEventArgs argument that exposes the current point, series, fill, and border, plus a cancel flag.
<ejs-chart (pointRender)="onPointRender($event)"></ejs-chart>import { IPointRenderEventArgs } from '@syncfusion/ej2-charts';
import { ChartModule, CategoryService, SplineSeriesService } from '@syncfusion/ej2-angular-charts';
import { Component, OnInit } from '@angular/core';
import { chartData } from './datasource';
@Component({
imports: [ChartModule],
providers: [CategoryService, SplineSeriesService],
standalone: true,
selector: 'app-container',
template: `<ejs-chart id="chart-container" (pointRender)='pointRender($event)' [primaryXAxis]='primaryXAxis' [primaryYAxis]='primaryYAxis' [title]='title' isTransposed='true'>
<e-series-collection>
<e-series [dataSource]='chartData' type='Spline' xName='x' yName='y' name='London' width=2 [marker]='marker'></e-series>
</e-series-collection>
</ejs-chart>`
})
export class AppComponent implements OnInit {
public primaryXAxis?: Object;
public chartData?: Object[];
public title?: string;
public primaryYAxis?: Object;
public marker?: Object;
ngOnInit(): void {
this.chartData = chartData;
this.primaryXAxis = {
title: 'Month',
valueType: 'Category'
};
this.marker = { visible: true, width: 10, height: 10 };
this.primaryYAxis = {
minimum: -5, maximum: 35, interval: 5,
title: 'Temperature in Celsius',
labelFormat: '{value}C'
};
this.title = 'Climate Graph-2012';
}
public pointRender(args: IPointRenderEventArgs): void {
args.fill = '#ff6347';
}
}import { bootstrapApplication } from '@angular/platform-browser';
import { AppComponent } from './app.component';
import 'zone.js';
bootstrapApplication(AppComponent).catch((err) => console.error(err));export let chartData: Object[] = [
{ x: 'Jan', y: -1 }, { x: 'Feb', y: -1 },
{ x: 'Mar', y: 2 }, { x: 'Apr', y: 8 },
{ x: 'May', y: 13 }, { x: 'Jun', y: 18 },
{ x: 'Jul', y: 21 }, { x: 'Aug', y: 20 },
{ x: 'Sep', y: 16 }, { x: 'Oct', y: 10 },
{ x: 'Nov', y: 4 }, { x: 'Dec', y: 0 }
];Troubleshooting
The following symptoms map to the most common configuration issues.
-
Series renders in the default orientation: Confirm that the
isTransposed='true'attribute is set on the<ejs-chart>element. -
Empty-point styling is not applied: Confirm that
[emptyPointSettings]='emptyPointSettings'is bound on the<e-series>element and thatmode,fill, andborderare configured. -
Provider error at runtime: Confirm that the registered series service (for example,
SplineSeriesService) matches thetypedeclared on the<e-series>element.