Scatter Chart in Angular Charts
Scatter
A scatter chart plots individual data points based on their x and y values, rendering a separate marker for each data point.
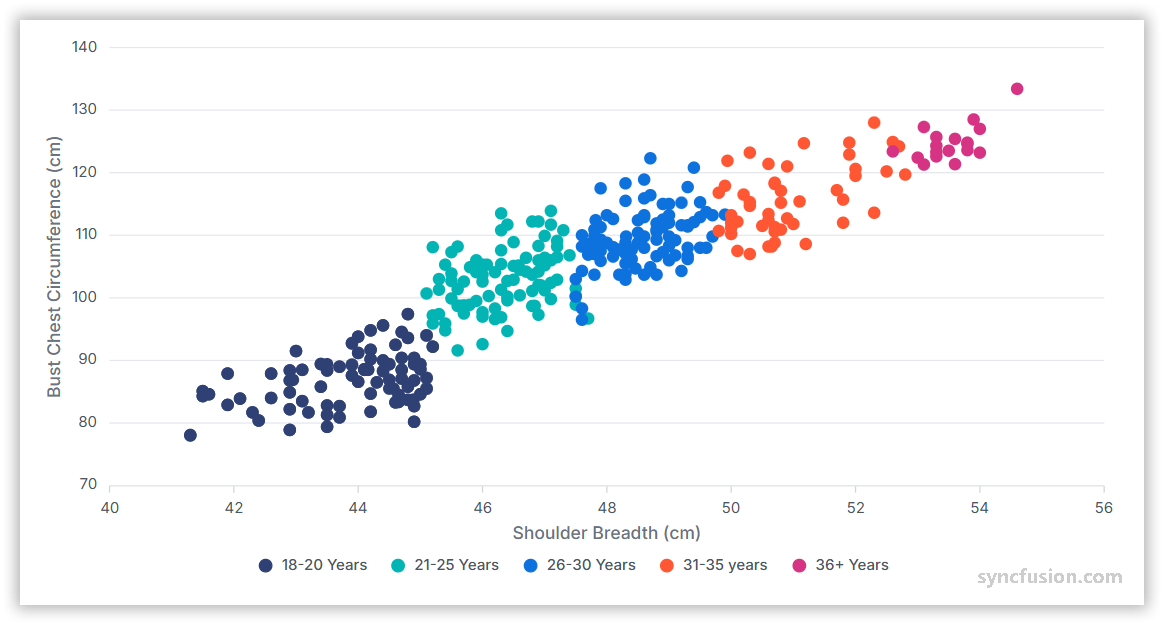
To render a scatter series in your chart, you need to follow a few steps to configure it correctly. Here’s a concise guide on how to do this:
-
Set the series type: Define the series
typeasScatterin your chart configuration. This indicates that the data should be displayed as individual points scattered across the chart. -
Provide ScatterSeriesService: Inject the
ScatterSeriesServiceinto the componentprovidersarray. This is required for rendering scatter series. -
Bind datasource: Bind data to the chart using the
dataSourceproperty within the series configuration. To display the data correctly, map the fields from the data to the chart seriesxNameandyNameproperties.
import { ChartModule, ScatterSeriesService, LegendService } from '@syncfusion/ej2-angular-charts';
import { Component, OnInit } from '@angular/core';

@Component({
    imports: [ChartModule],
    providers: [ScatterSeriesService, LegendService],
    standalone: true,
    selector: 'app-container',
    template: `<ejs-chart id="chart-container" [primaryXAxis]='primaryXAxis' [primaryYAxis]='primaryYAxis' [title]='title'>
        <e-series-collection>
            <e-series [dataSource]='series1' type='Scatter' xName='x' yName='y' name='Male' [opacity]='0.7' [marker]='marker'></e-series>
            <e-series [dataSource]='series2' type='Scatter' xName='x' yName='y' name='Female' [opacity]='0.7' [marker]='marker'></e-series>
        </e-series-collection>
    </ejs-chart>`
})
export class AppComponent implements OnInit {
    public primaryXAxis?: Object;
    public chartData?: Object[];
    public title?: string;
    public primaryYAxis?: Object;
    public series1?: Object;
    public series2?: Object;
    public marker?: Object;
    getScatterData(): any {
        let series1: Object[] = [];
        let series2: Object[] = [];
        let point1: Object;
        let value: number = 80;
        let value1: number = 70;
        let i: number;
        for (i = 1; i < 120; i++) {
            if (Math.random() > 0.5) {
                value += Math.random();
            } else {
                value -= Math.random();
            }
            value = value < 60 ? 60 : value > 90 ? 90 : value;
            point1 = { x: 120 + (i / 2), y: value.toFixed(1) };
            series1.push(point1);
        }
        for (i = 1; i < 120; i++) {
            if (Math.random() > 0.5) {
                value1 += Math.random();
            } else {
                value1 -= Math.random();
            }
            value1 = value1 < 60 ? 60 : value1 > 90 ? 90 : value1;
            point1 = { x: 120 + (i / 2), y: value1.toFixed(1) };
            series2.push(point1);
        }
        return { 'series1':series1, 'series2': series2};
    };
    ngOnInit(): void {
        this.primaryXAxis = {
            title: 'Height (cm)',
            minimum: 120, maximum: 180,
            edgeLabelPlacement: 'Shift',
            labelFormat: '{value}cm'
        };
        this.primaryYAxis = {
            title: 'Weight (kg)',
            minimum: 60, maximum: 90,
            labelFormat: '{value}kg',
            rangePadding: 'None'
        };
        this.title = 'Height Vs Weight';
        this.marker = {  width: 10, height: 10 };
        this.series1 = this.getScatterData().series1;
        this.series2 = this.getScatterData().series2;
    }

}
import { bootstrapApplication } from '@angular/platform-browser';
import { AppComponent } from './app.component';
import 'zone.js';
bootstrapApplication(AppComponent).catch((err) => console.error(err));Series customization
The following properties can be used to customize the scatter series.
Fill
The fill property determines the color applied to the series.
import { ChartModule, ScatterSeriesService, LegendService } from '@syncfusion/ej2-angular-charts';
import { Component, OnInit } from '@angular/core';

@Component({
    imports: [ChartModule],
    providers: [ScatterSeriesService, LegendService],
    standalone: true,
    selector: 'app-container',
    template: `<ejs-chart id="chart-container" [primaryXAxis]='primaryXAxis' [primaryYAxis]='primaryYAxis' [title]='title'>
        <e-series-collection>
            <e-series [dataSource]='series1' type='Scatter' xName='x' yName='y' name='Male' fill='orange'></e-series>
            <e-series [dataSource]='series2' type='Scatter' xName='x' yName='y' name='Female' fill='red'></e-series>
        </e-series-collection>
    </ejs-chart>`
})
export class AppComponent implements OnInit {
    public primaryXAxis?: Object;
    public chartData?: Object[];
    public title?: string;
    public primaryYAxis?: Object;
    public series1?: Object;
    public series2?: Object;
    getScatterData(): any {
        let series1: Object[] = [];
        let series2: Object[] = [];
        let point1: Object;
        let value: number = 80;
        let value1: number = 70;
        let i: number;
        for (i = 1; i < 120; i++) {
            if (Math.random() > 0.5) {
                value += Math.random();
            } else {
                value -= Math.random();
            }
            value = value < 60 ? 60 : value > 90 ? 90 : value;
            point1 = { x: 120 + (i / 2), y: value.toFixed(1) };
            series1.push(point1);
        }
        for (i = 1; i < 120; i++) {
            if (Math.random() > 0.5) {
                value1 += Math.random();
            } else {
                value1 -= Math.random();
            }
            value1 = value1 < 60 ? 60 : value1 > 90 ? 90 : value1;
            point1 = { x: 120 + (i / 2), y: value1.toFixed(1) };
            series2.push(point1);
        }
        return { 'series1':series1, 'series2': series2};
    };
    ngOnInit(): void {
        this.primaryXAxis = {
            title: 'Height (cm)',
            minimum: 120, maximum: 180,
            edgeLabelPlacement: 'Shift',
            labelFormat: '{value}cm'
        };
        this.primaryYAxis = {
            title: 'Weight (kg)',
            minimum: 60, maximum: 90,
            labelFormat: '{value}kg',
            rangePadding: 'None'
        };
        this.title = 'Height Vs Weight';
        this.series1 = this.getScatterData().series1;
        this.series2 = this.getScatterData().series2;
    }

}
import { bootstrapApplication } from '@angular/platform-browser';
import { AppComponent } from './app.component';
import 'zone.js';
bootstrapApplication(AppComponent).catch((err) => console.error(err));Opacity
The opacity property specifies the transparency level of the fill. Adjusting this property allows you to control how opaque or transparent the fill color of the series appears.
import { ChartModule, ScatterSeriesService, LegendService } from '@syncfusion/ej2-angular-charts';
import { Component, OnInit } from '@angular/core';

@Component({
    imports: [ChartModule],
    providers: [ScatterSeriesService, LegendService],
    standalone: true,
    selector: 'app-container',
    template: `<ejs-chart id="chart-container" [primaryXAxis]='primaryXAxis' [primaryYAxis]='primaryYAxis' [title]='title'>
        <e-series-collection>
            <e-series [dataSource]='series1' type='Scatter' xName='x' yName='y' name='Male' [opacity]='0.7' [marker]='marker'></e-series>
            <e-series [dataSource]='series2' type='Scatter' xName='x' yName='y' name='Female' [opacity]='0.7' [marker]='marker'></e-series>
        </e-series-collection>
    </ejs-chart>`
})
export class AppComponent implements OnInit {
    public primaryXAxis?: Object;
    public chartData?: Object[];
    public title?: string;
    public primaryYAxis?: Object;
    public series1?: Object;
    public series2?: Object;
    public marker?: Object;
    getScatterData(): any {
        let series1: Object[] = [];
        let series2: Object[] = [];
        let point1: Object;
        let value: number = 80;
        let value1: number = 70;
        let i: number;
        for (i = 1; i < 120; i++) {
            if (Math.random() > 0.5) {
                value += Math.random();
            } else {
                value -= Math.random();
            }
            value = value < 60 ? 60 : value > 90 ? 90 : value;
            point1 = { x: 120 + (i / 2), y: value.toFixed(1) };
            series1.push(point1);
        }
        for (i = 1; i < 120; i++) {
            if (Math.random() > 0.5) {
                value1 += Math.random();
            } else {
                value1 -= Math.random();
            }
            value1 = value1 < 60 ? 60 : value1 > 90 ? 90 : value1;
            point1 = { x: 120 + (i / 2), y: value1.toFixed(1) };
            series2.push(point1);
        }
        return { 'series1':series1, 'series2': series2};
    };
    ngOnInit(): void {
        this.primaryXAxis = {
            title: 'Height (cm)',
            minimum: 120, maximum: 180,
            edgeLabelPlacement: 'Shift',
            labelFormat: '{value}cm'
        };
        this.primaryYAxis = {
            title: 'Weight (kg)',
            minimum: 60, maximum: 90,
            labelFormat: '{value}kg',
            rangePadding: 'None'
        };
        this.title = 'Height Vs Weight';
        this.marker = {  width: 10, height: 10 };
        this.series1 = this.getScatterData().series1;
        this.series2 = this.getScatterData().series2;
    }

}
import { bootstrapApplication } from '@angular/platform-browser';
import { AppComponent } from './app.component';
import 'zone.js';
bootstrapApplication(AppComponent).catch((err) => console.error(err));Shape
The shape property allows you to customize the appearance of the markers by specifying different shapes.
import { ChartModule, ScatterSeriesService, LegendService } from '@syncfusion/ej2-angular-charts';
import { Component, OnInit } from '@angular/core';

@Component({
    imports: [ChartModule],
    providers: [ScatterSeriesService, LegendService],
    standalone: true,
    selector: 'app-container',
    template: `<ejs-chart id="chart-container" [primaryXAxis]='primaryXAxis' [primaryYAxis]='primaryYAxis' [title]='title'>
        <e-series-collection>
            <e-series [dataSource]='series1' type='Scatter' xName='x' yName='y' name='Male' [marker]='marker'></e-series>
            <e-series [dataSource]='series2' type='Scatter' xName='x' yName='y' name='Female' [marker]='marker1'></e-series>
        </e-series-collection>
    </ejs-chart>`
})
export class AppComponent implements OnInit {
    public primaryXAxis?: Object;
    public chartData?: Object[];
    public title?: string;
    public primaryYAxis?: Object;
    public series1?: Object;
    public series2?: Object;
    public marker?: Object;
    public marker1?: Object;
    getScatterData(): any {
        let series1: Object[] = [];
        let series2: Object[] = [];
        let point1: Object;
        let value: number = 80;
        let value1: number = 70;
        let i: number;
        for (i = 1; i < 120; i++) {
            if (Math.random() > 0.5) {
                value += Math.random();
            } else {
                value -= Math.random();
            }
            value = value < 60 ? 60 : value > 90 ? 90 : value;
            point1 = { x: 120 + (i / 2), y: value.toFixed(1) };
            series1.push(point1);
        }
        for (i = 1; i < 120; i++) {
            if (Math.random() > 0.5) {
                value1 += Math.random();
            } else {
                value1 -= Math.random();
            }
            value1 = value1 < 60 ? 60 : value1 > 90 ? 90 : value1;
            point1 = { x: 120 + (i / 2), y: value1.toFixed(1) };
            series2.push(point1);
        }
        return { 'series1':series1, 'series2': series2};
    };
    ngOnInit(): void {
        this.primaryXAxis = {
            title: 'Height (cm)',
            minimum: 120, maximum: 180,
            edgeLabelPlacement: 'Shift',
            labelFormat: '{value}cm'
        };
        this.primaryYAxis = {
            title: 'Weight (kg)',
            minimum: 60, maximum: 90,
            labelFormat: '{value}kg',
            rangePadding: 'None'
        };
        this.title = 'Height Vs Weight';
        this.marker = {  width: 10, height: 10 };
        this.marker1 = {  width: 10, height: 10, shape: 'Rectangle' };
        this.series1 = this.getScatterData().series1;
        this.series2 = this.getScatterData().series2;
    }

}
import { bootstrapApplication } from '@angular/platform-browser';
import { AppComponent } from './app.component';
import 'zone.js';
bootstrapApplication(AppComponent).catch((err) => console.error(err));Empty points
Data points with null or undefined values are considered empty. Empty data points are ignored and not plotted on the chart.
Mode
Use the mode property to define how empty or missing data points are handled in the series. The default mode for empty points is Gap.
| Mode | Description |
|---|---|
Gap |
Empty points are rendered as gaps, leaving the area empty. |
Drop |
Empty points are dropped, and the next point is connected to the previous point. |
Zero |
Empty points are considered as zero values. |
Average |
Empty points are replaced with the average value of the surrounding points. |
import { ChartModule, ScatterSeriesService, LegendService } from '@syncfusion/ej2-angular-charts';
import { Component, OnInit } from '@angular/core';
import { scatterData } from './datasource';

@Component({
    imports: [ChartModule],
    providers: [ScatterSeriesService, LegendService],
    standalone: true,
    selector: 'app-container',
    template: `<ejs-chart id="chart-container" [primaryXAxis]='primaryXAxis' [primaryYAxis]='primaryYAxis' [title]='title'>
        <e-series-collection>
            <e-series [dataSource]='chartData' type='Scatter' xName='x' yName='y' name='Male' [emptyPointSettings]='emptyPointSettings'></e-series>
        </e-series-collection>
    </ejs-chart>`
})
export class AppComponent implements OnInit {
    public primaryXAxis?: Object;
    public chartData?: Object[];
    public title?: string;
    public primaryYAxis?: Object;
    public emptyPointSettings?: Object;
    public marker?: Object;
    ngOnInit(): void {
        this.primaryXAxis = {
            title: 'Height (cm)',
            edgeLabelPlacement: 'Shift',
            labelFormat: '{value}cm'
        };
        this.primaryYAxis = {
            title: 'Weight (kg)',
            labelFormat: '{value}kg',
            rangePadding: 'None'
        };
        this.title = 'Height Vs Weight';
        this.marker = {  width: 10, height: 10 };
        this.chartData = scatterData;
        this.emptyPointSettings = {
            mode: 'Zero'
        }
    }

}
import { bootstrapApplication } from '@angular/platform-browser';
import { AppComponent } from './app.component';
import 'zone.js';
bootstrapApplication(AppComponent).catch((err) => console.error(err));export let scatterData: Object[] = [
{ x: 1, y: 15 },
{ x: 2, y: 25 },
{ x: 3, y: 35 },
{ x: 4, y: null },
{ x: 5, y: 55 },
{ x: 6, y: 60 },
{ x: 7, y: 65 },
{ x: 8, y: 70 },
{ x: 9, y: 75 },
{ x: 10, y: 80 },
{ x: 11, y: undefined },
{ x: 12, y: 90 },
{ x: 13, y: 92 },
{ x: 14, y: 94 },
{ x: 15, y: 96 },
{ x: 16, y: null },
{ x: 17, y: 98 },
{ x: 18, y: 99 },
{ x: 19, y: 100 },
{ x: 20, y: 100 }
];Fill
Use the fill property to customize the fill color of empty points in the series.
import { ChartModule, ScatterSeriesService, LegendService } from '@syncfusion/ej2-angular-charts';
import { Component, OnInit } from '@angular/core';
import { scatterData } from './datasource';

@Component({
    imports: [ChartModule],
    providers: [ScatterSeriesService, LegendService],
    standalone: true,
    selector: 'app-container',
    template: `<ejs-chart id="chart-container" [primaryXAxis]='primaryXAxis' [primaryYAxis]='primaryYAxis' [title]='title'>
        <e-series-collection>
            <e-series [dataSource]='chartData' type='Scatter' xName='x' yName='y' name='Male' [emptyPointSettings]='emptyPointSettings'></e-series>
        </e-series-collection>
    </ejs-chart>`
})
export class AppComponent implements OnInit {
    public primaryXAxis?: Object;
    public chartData?: Object[];
    public title?: string;
    public primaryYAxis?: Object;
    public emptyPointSettings?: Object;
    public marker?: Object;
    ngOnInit(): void {
        this.primaryXAxis = {
            title: 'Height (cm)',
            edgeLabelPlacement: 'Shift',
            labelFormat: '{value}cm'
        };
        this.primaryYAxis = {
            title: 'Weight (kg)',
            labelFormat: '{value}kg',
            rangePadding: 'None'
        };
        this.title = 'Height Vs Weight';
        this.marker = {  width: 10, height: 10 };
        this.chartData = scatterData;
        this.emptyPointSettings = {
            mode: 'Average', fill: 'red'
        }
    }

}
import { bootstrapApplication } from '@angular/platform-browser';
import { AppComponent } from './app.component';
import 'zone.js';
bootstrapApplication(AppComponent).catch((err) => console.error(err));export let scatterData: Object[] = [
{ x: 1, y: 15 },
{ x: 2, y: 25 },
{ x: 3, y: 35 },
{ x: 4, y: null },
{ x: 5, y: 55 },
{ x: 6, y: 60 },
{ x: 7, y: 65 },
{ x: 8, y: 70 },
{ x: 9, y: 75 },
{ x: 10, y: 80 },
{ x: 11, y: undefined },
{ x: 12, y: 90 },
{ x: 13, y: 92 },
{ x: 14, y: 94 },
{ x: 15, y: 96 },
{ x: 16, y: null },
{ x: 17, y: 98 },
{ x: 18, y: 99 },
{ x: 19, y: 100 },
{ x: 20, y: 100 }
];Border
Use the border property to customize the width and color of the border for empty points.
import { ChartModule, ScatterSeriesService, LegendService } from '@syncfusion/ej2-angular-charts';
import { Component, OnInit } from '@angular/core';
import { scatterData } from './datasource';

@Component({
    imports: [ChartModule],
    providers: [ScatterSeriesService, LegendService],
    standalone: true,
    selector: 'app-container',
    template: `<ejs-chart id="chart-container" [primaryXAxis]='primaryXAxis' [primaryYAxis]='primaryYAxis' [title]='title'>
        <e-series-collection>
            <e-series [dataSource]='chartData' type='Scatter' xName='x' yName='y' name='Male' [emptyPointSettings]='emptyPointSettings'></e-series>
        </e-series-collection>
    </ejs-chart>`
})
export class AppComponent implements OnInit {
    public primaryXAxis?: Object;
    public chartData?: Object[];
    public title?: string;
    public primaryYAxis?: Object;
    public emptyPointSettings?: Object;
    public marker?: Object;
    ngOnInit(): void {
        this.primaryXAxis = {
            title: 'Height (cm)',
            edgeLabelPlacement: 'Shift',
            labelFormat: '{value}cm'
        };
        this.primaryYAxis = {
            title: 'Weight (kg)',
            labelFormat: '{value}kg',
            rangePadding: 'None'
        };
        this.title = 'Height Vs Weight';
        this.marker = {  width: 10, height: 10 };
        this.chartData = scatterData;
        this.emptyPointSettings = {
            mode: 'Average', fill: 'red', border: { width: 2, color: 'green' }
        }
    }

}
import { bootstrapApplication } from '@angular/platform-browser';
import { AppComponent } from './app.component';
import 'zone.js';
bootstrapApplication(AppComponent).catch((err) => console.error(err));export let scatterData: Object[] = [
{ x: 1, y: 15 },
{ x: 2, y: 25 },
{ x: 3, y: 35 },
{ x: 4, y: null },
{ x: 5, y: 55 },
{ x: 6, y: 60 },
{ x: 7, y: 65 },
{ x: 8, y: 70 },
{ x: 9, y: 75 },
{ x: 10, y: 80 },
{ x: 11, y: undefined },
{ x: 12, y: 90 },
{ x: 13, y: 92 },
{ x: 14, y: 94 },
{ x: 15, y: 96 },
{ x: 16, y: null },
{ x: 17, y: 98 },
{ x: 18, y: 99 },
{ x: 19, y: 100 },
{ x: 20, y: 100 }
];Events
Series render
The seriesRender event allows you to customize series properties, such as data, fill, and name, before they are rendered on the chart.
import { ISeriesRenderEventArgs } from '@syncfusion/ej2-charts';
import { ChartModule, ScatterSeriesService, LegendService } from '@syncfusion/ej2-angular-charts';
import { Component, OnInit } from '@angular/core';
import { scatterData } from './datasource';

@Component({
    imports: [ChartModule],
    providers: [ScatterSeriesService, LegendService],
    standalone: true,
    selector: 'app-container',
    template: `<ejs-chart id="chart-container" (seriesRender)='seriesRender($event)' [primaryXAxis]='primaryXAxis' [primaryYAxis]='primaryYAxis' [title]='title'>
        <e-series-collection>
            <e-series [dataSource]='chartData' type='Scatter' xName='x' yName='y' name='Male'></e-series>
        </e-series-collection>
    </ejs-chart>`
})
export class AppComponent implements OnInit {
    public primaryXAxis?: Object;
    public chartData?: Object[];
    public title?: string;
    public primaryYAxis?: Object;
    public emptyPointSettings?: Object;
    public marker?: Object;
    ngOnInit(): void {
        this.primaryXAxis = {
            title: 'Height (cm)',
            edgeLabelPlacement: 'Shift',
            labelFormat: '{value}cm'
        };
        this.primaryYAxis = {
            title: 'Weight (kg)',
            labelFormat: '{value}kg',
            rangePadding: 'None'
        };
        this.title = 'Height Vs Weight';
        this.marker = {  width: 10, height: 10 };
        this.chartData = scatterData;
    }
    public seriesRender(args: ISeriesRenderEventArgs): void {
        args.fill = '#ff6347';
    }

}
import { bootstrapApplication } from '@angular/platform-browser';
import { AppComponent } from './app.component';
import 'zone.js';
bootstrapApplication(AppComponent).catch((err) => console.error(err));export let scatterData: Object[] = [
{ x: 1, y: 15 },
{ x: 2, y: 25 },
{ x: 3, y: 35 },
{ x: 4, y: 45 },
{ x: 5, y: 55 },
{ x: 6, y: 60 },
{ x: 7, y: 65 },
{ x: 8, y: 70 },
{ x: 9, y: 75 },
{ x: 10, y: 80 },
{ x: 11, y: 85 },
{ x: 12, y: 90 },
{ x: 13, y: 92 },
{ x: 14, y: 94 },
{ x: 15, y: 96 },
{ x: 16, y: 97 },
{ x: 17, y: 98 },
{ x: 18, y: 99 },
{ x: 19, y: 100 },
{ x: 20, y: 100 }
];Point render
The pointRender event allows you to customize each data point before it is rendered on the chart.
import { IPointRenderEventArgs } from '@syncfusion/ej2-charts';
import { ChartModule, ScatterSeriesService, LegendService } from '@syncfusion/ej2-angular-charts';
import { Component, OnInit } from '@angular/core';
import { scatterData } from './datasource';

@Component({
    imports: [ChartModule],
    providers: [ScatterSeriesService, LegendService],
    standalone: true,
    selector: 'app-container',
    template: `<ejs-chart id="chart-container" (pointRender)='pointRender($event)' [primaryXAxis]='primaryXAxis' [primaryYAxis]='primaryYAxis' [title]='title'>
        <e-series-collection>
            <e-series [dataSource]='chartData' type='Scatter' xName='x' yName='y' name='Male' ></e-series>
        </e-series-collection>
    </ejs-chart>`
})
export class AppComponent implements OnInit {
    public primaryXAxis?: Object;
    public chartData?: Object[];
    public title?: string;
    public primaryYAxis?: Object;
    public emptyPointSettings?: Object;
    public marker?: Object;
    ngOnInit(): void {
        this.primaryXAxis = {
            title: 'Height (cm)',
            edgeLabelPlacement: 'Shift',
            labelFormat: '{value}cm'
        };
        this.primaryYAxis = {
            title: 'Weight (kg)',
            labelFormat: '{value}kg',
            rangePadding: 'None'
        };
        this.title = 'Height Vs Weight';
        this.marker = {  width: 10, height: 10 };
        this.chartData = scatterData;
    }
    public pointRender(args: IPointRenderEventArgs): void {
        if (args.point.index % 2 !== 0) {
            args.fill = '#ff6347';
        } else {
            args.fill = '#009cb8';
        }
    }

}
import { bootstrapApplication } from '@angular/platform-browser';
import { AppComponent } from './app.component';
import 'zone.js';
bootstrapApplication(AppComponent).catch((err) => console.error(err));export let scatterData: Object[] = [
{ x: 1, y: 15 },
{ x: 2, y: 25 },
{ x: 3, y: 35 },
{ x: 4, y: 45 },
{ x: 5, y: 55 },
{ x: 6, y: 60 },
{ x: 7, y: 65 },
{ x: 8, y: 70 },
{ x: 9, y: 75 },
{ x: 10, y: 80 },
{ x: 11, y: 85 },
{ x: 12, y: 90 },
{ x: 13, y: 92 },
{ x: 14, y: 94 },
{ x: 15, y: 96 },
{ x: 16, y: 97 },
{ x: 17, y: 98 },
{ x: 18, y: 99 },
{ x: 19, y: 100 },
{ x: 20, y: 100 }
];Troubleshooting
The following points explain common issues that may arise while configuring or rendering a scatter chart, along with their resolutions.
Scatter points are not rendered
The ScatterSeriesService is not registered in the component providers array. Add ScatterSeriesService to the providers array of the standalone component.
Points fall on a single vertical line
xName and yName are swapped, or xName is mapped to a non-numeric field. Verify that xName maps to a numeric field on the data record and that yName maps to the response variable.
Empty-point styling is not applied
emptyPointSettings is defined but not bound on the <e-series> element. Bind [emptyPointSettings]='emptyPointSettings' on the series and configure the fill, border, and mode properties.
Markers render as the default circle regardless of shape
marker is defined in the component class but not bound to [marker] on <e-series>. Bind [marker]='marker' on the series element.