Polar Chart in Angular Charts
Polar
A polar chart plots data on a circular grid using angle and radius values. It is useful for visualizing cyclic data or comparing multivariate values.
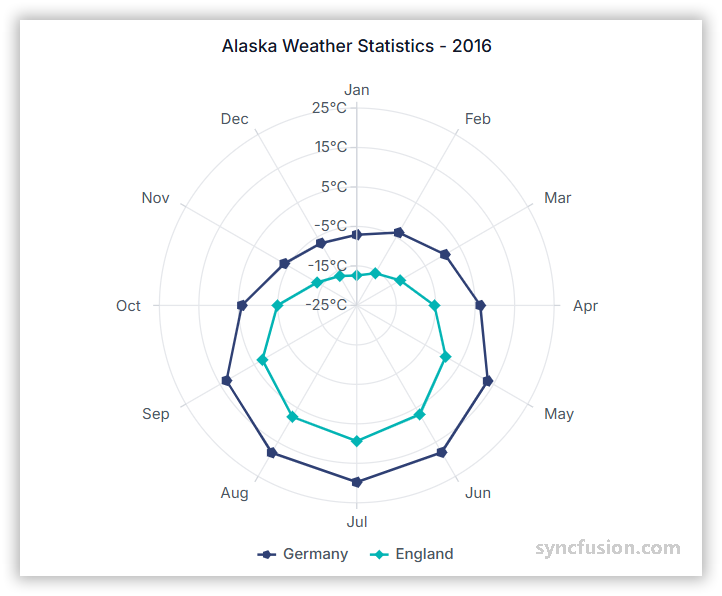
To render a polar series in your chart, follow these steps to configure it correctly:
-
Set the series type: Define the series
typeasPolarin your chart configuration. The optionaldrawType(defaultLine) controls the inner plotting style. -
Provide PolarSeriesService: Inject the
PolarSeriesServiceinto the componentprovidersarray. For category-axis data also includeCategoryService, and register the service that matches the chosendrawType(for exampleLineSeriesService,SplineSeriesService,ColumnSeriesService). -
Bind category and value data: Bind data through the series
dataSourceproperty and map the category and value fields toxNameandyName.
import { ChartModule, PolarSeriesService, LineSeriesService } from '@syncfusion/ej2-angular-charts';
import { Component, OnInit } from '@angular/core';
import { radarData } from './datasource';

@Component({
    imports: [ChartModule],
    providers: [PolarSeriesService, LineSeriesService],
    standalone: true,
    selector: 'app-container',
    template: `<ejs-chart id="chart-container" [primaryXAxis]='primaryXAxis' [primaryYAxis]='primaryYAxis' [title]='title'>
        <e-series-collection>
            <e-series [dataSource]='data' type='Polar' xName='x' yName='y' drawType='Line'></e-series>
        </e-series-collection>
    </ejs-chart>`
})
export class AppComponent implements OnInit {
    public primaryXAxis?: Object;
    public primaryYAxis?: Object;
    public title?: string;
    public data?: Object[];

    ngOnInit(): void {
        this.data = radarData;
        this.primaryXAxis = {
            title: 'Year',
            startAngle: 90,
            minimum: 2004,
            maximum: 2012,
            interval: 1
        };
        this.primaryYAxis = {
            minimum: 20,
            maximum: 40,
            interval: 5,
            title: 'Efficiency',
            labelFormat: '{value}%'
        };
        this.title = 'Efficiency of oil-fired power production';
    }
}
import { bootstrapApplication } from '@angular/platform-browser';
import { AppComponent } from './app.component';
import 'zone.js';
bootstrapApplication(AppComponent).catch((err) => console.error(err));export let radarData: Object[] = [{ x: 2005, y: 28 },
{ x: 2006, y: 25 },
{ x: 2007, y: 26 },
{ x: 2008, y: 27 },
{ x: 2009, y: 32 },
{ x: 2010, y: 35 },
{ x: 2011, y: 30 }
];Draw Types
Use the drawType property to change the series plotting style in a Polar chart to line, spline, area, stacking area, column, stacking column, range column, scatter, or spline area. The default value of drawType is Line. Each draw type requires the matching series service in providers.
Line
Use drawType='Line' to render a polar line chart, with lines connecting each data point. The isClosed property determines whether the start and end points join to form a closed path. Default is true. Required service: LineSeriesService.
import { ChartModule, PolarSeriesService, LineSeriesService } from '@syncfusion/ej2-angular-charts';
import { Component, OnInit } from '@angular/core';
import { chartData } from './datasource';

@Component({
    imports: [ChartModule],
    providers: [PolarSeriesService, LineSeriesService],
    standalone: true,
    selector: 'app-container',
    template: `<ejs-chart id="chart-container" [primaryXAxis]='primaryXAxis' [primaryYAxis]='primaryYAxis' [title]='title'>
        <e-series-collection>
            <e-series [dataSource]='data' type='Polar' xName='x' yName='y' drawType='Line'></e-series>
        </e-series-collection>
    </ejs-chart>`
})
export class AppComponent implements OnInit {
    public primaryXAxis?: Object;
    public primaryYAxis?: Object;
    public title?: string;
    public data?: Object[];

    ngOnInit(): void {
        this.data = chartData;
        this.primaryXAxis = {
            title: 'Year',
            minimum: 2004,
            maximum: 2012,
            interval: 1
        };
        this.primaryYAxis = {
            minimum: 20,
            maximum: 40,
            interval: 5,
            title: 'Efficiency',
            labelFormat: '{value}%'
        };
        this.title = 'Efficiency of oil-fired power production';
    }
}
import { bootstrapApplication } from '@angular/platform-browser';
import { AppComponent } from './app.component';
import 'zone.js';
bootstrapApplication(AppComponent).catch((err) => console.error(err));export let chartData: Object[] = [
{ x: 2005, y: 28 },
{ x: 2006, y: 25 },
{ x: 2007, y: 26 },
{ x: 2008, y: 27 },
{ x: 2009, y: 32 },
{ x: 2010, y: 35 },
{ x: 2011, y: 30 }
];Spline
Use drawType='Spline' to render a polar spline chart, with smooth curved lines connecting each data point. Required service: SplineSeriesService.
import { ChartModule, PolarSeriesService, SplineSeriesService, CategoryService } from '@syncfusion/ej2-angular-charts';
import { Component, OnInit } from '@angular/core';
import { chartData } from './datasource';

@Component({
    imports: [ChartModule],
    providers: [PolarSeriesService, SplineSeriesService, CategoryService],
    standalone: true,
    selector: 'app-container',
    template: `<ejs-chart id="chart-container" [primaryXAxis]='primaryXAxis' [primaryYAxis]='primaryYAxis' [title]='title'>
        <e-series-collection>
            <e-series [dataSource]='data' type='Polar' xName='x' yName='y' drawType='Spline' name='London'></e-series>
        </e-series-collection>
    </ejs-chart>`
})
export class AppComponent implements OnInit {
    public primaryXAxis?: Object;
    public primaryYAxis?: Object;
    public title?: string;
    public data?: Object[];

    ngOnInit(): void {
        this.data = chartData;
        this.primaryXAxis = {
            title: 'Year',
            valueType: 'Category'
        };
        this.primaryYAxis = {
            minimum: -5,
            maximum: 35,
            interval: 10,
            title: 'Temperature in Celsius',
            labelFormat: '{value}C'
        };
        this.title = 'Climate Graph-2012';
    }
}
import { bootstrapApplication } from '@angular/platform-browser';
import { AppComponent } from './app.component';
import 'zone.js';
bootstrapApplication(AppComponent).catch((err) => console.error(err));export let chartData: Object[] = [
{ x: 2005, y: 28 },
{ x: 2006, y: 25 },
{ x: 2007, y: 26 },
{ x: 2008, y: 27 },
{ x: 2009, y: 32 },
{ x: 2010, y: 35 },
{ x: 2011, y: 30 }
];Area
Use drawType='Area' to render a polar area chart, with filled areas below the connecting line. Required service: AreaSeriesService.
import { ChartModule, PolarSeriesService, AreaSeriesService, CategoryService } from '@syncfusion/ej2-angular-charts';
import { Component, OnInit } from '@angular/core';
import { chartData } from './datasource';

@Component({
    imports: [ChartModule],
    providers: [PolarSeriesService, AreaSeriesService, CategoryService],
    standalone: true,
    selector: 'app-container',
    template: `<ejs-chart id="chart-container" [primaryXAxis]='primaryXAxis' [primaryYAxis]='primaryYAxis' [title]='title'>
        <e-series-collection>
            <e-series [dataSource]='data' type='Polar' xName='x' yName='y' drawType='Area' name='London'></e-series>
        </e-series-collection>
    </ejs-chart>`
})
export class AppComponent implements OnInit {
    public primaryXAxis?: Object;
    public primaryYAxis?: Object;
    public title?: string;
    public data?: Object[];

    ngOnInit(): void {
        this.data = chartData;
        this.primaryXAxis = {
            title: 'Year',
            valueType: 'Category'
        };
        this.primaryYAxis = {
            minimum: -5,
            maximum: 35,
            interval: 10,
            title: 'Temperature in Celsius',
            labelFormat: '{value}C'
        };
        this.title = 'Climate Graph-2012';
    }
}
import { bootstrapApplication } from '@angular/platform-browser';
import { AppComponent } from './app.component';
import 'zone.js';
bootstrapApplication(AppComponent).catch((err) => console.error(err));export let chartData: Object[] = [
{ x: 2005, y: 28 },
{ x: 2006, y: 25 },
{ x: 2007, y: 26 },
{ x: 2008, y: 27 },
{ x: 2009, y: 32 },
{ x: 2010, y: 35 },
{ x: 2011, y: 30 }
];Stacked Area
Use drawType='StackingArea' to render multiple areas stacked on top of each other. Required service: StackingAreaSeriesService. This draw type needs at least two <e-series> elements to demonstrate stacking.
import { ChartModule, CategoryService, PolarSeriesService, StackingAreaSeriesService } from '@syncfusion/ej2-angular-charts';
import { Component, OnInit } from '@angular/core';
import { chartData } from './datasource';

@Component({
    imports: [ChartModule],
    providers: [CategoryService, PolarSeriesService, StackingAreaSeriesService],
    standalone: true,
    selector: 'app-container',
    template: `<ejs-chart id="chart-container" [primaryXAxis]='primaryXAxis' [primaryYAxis]='primaryYAxis' [title]='title'>
        <e-series-collection>
            <e-series [dataSource]='data' type='Polar' xName='x' yName='y'  drawType='StackingArea' name='Organic'></e-series>
            <e-series [dataSource]='data' type='Polar' xName='x' yName='y1' drawType='StackingArea' name='Fair-trade'></e-series>
            <e-series [dataSource]='data' type='Polar' xName='x' yName='y2' drawType='StackingArea' name='veg-Alternatives'></e-series>
        </e-series-collection>
    </ejs-chart>`
})
export class AppComponent implements OnInit {
    public primaryXAxis?: Object;
    public primaryYAxis?: Object;
    public title?: string;
    public data?: Object[];

    ngOnInit(): void {
        this.data = chartData;
        this.primaryXAxis = {
            valueType: 'Category'
        };
        this.primaryYAxis = {
            title: 'Sales'
        };
        this.title = 'Trend in Sales of Ethical Produce';
    }
}
import { bootstrapApplication } from '@angular/platform-browser';
import { AppComponent } from './app.component';
import 'zone.js';
bootstrapApplication(AppComponent).catch((err) => console.error(err));export let chartData: Object[] = [
{ x: 2005, y: 28 },
{ x: 2006, y: 25 },
{ x: 2007, y: 26 },
{ x: 2008, y: 27 },
{ x: 2009, y: 32 },
{ x: 2010, y: 35 },
{ x: 2011, y: 30 }
];Column
Use drawType='Column' to render values as radial columns. Required service: ColumnSeriesService.
import { ChartModule, PolarSeriesService, ColumnSeriesService, CategoryService } from '@syncfusion/ej2-angular-charts';
import { Component, OnInit } from '@angular/core';
import { chartData } from './datasource';

@Component({
    imports: [ChartModule],
    providers: [PolarSeriesService, ColumnSeriesService, CategoryService],
    standalone: true,
    selector: 'app-container',
    template: `<ejs-chart id="chart-container" [primaryXAxis]='primaryXAxis' [primaryYAxis]='primaryYAxis' [title]='title'>
        <e-series-collection>
            <e-series [dataSource]='data' type='Polar' xName='x' yName='y' drawType='Column' name='Gold'></e-series>
        </e-series-collection>
    </ejs-chart>`
})
export class AppComponent implements OnInit {
    public primaryXAxis?: Object;
    public primaryYAxis?: Object;
    public title?: string;
    public data?: Object[];

    ngOnInit(): void {
        this.data = chartData;
        this.primaryXAxis = {
            title: 'Year',
            valueType: 'Category'
        };
        this.primaryYAxis = {
            title: 'Medals'
        };
        this.title = 'Olympic Medals';
    }
}
import { bootstrapApplication } from '@angular/platform-browser';
import { AppComponent } from './app.component';
import 'zone.js';
bootstrapApplication(AppComponent).catch((err) => console.error(err));export let chartData: Object[] = [
{ x: 2005, y: 28 },
{ x: 2006, y: 25 },
{ x: 2007, y: 26 },
{ x: 2008, y: 27 },
{ x: 2009, y: 32 },
{ x: 2010, y: 35 },
{ x: 2011, y: 30 }
];Stacked Column
Use drawType='StackingColumn' to render multiple columns stacked on each category. Required service: StackingColumnSeriesService. This draw type needs at least two <e-series> elements to demonstrate stacking.
import { ChartModule, CategoryService, PolarSeriesService, StackingColumnSeriesService } from '@syncfusion/ej2-angular-charts';
import { Component, OnInit } from '@angular/core';
import { chartData } from './datasource';

@Component({
    imports: [ChartModule],
    providers: [CategoryService, PolarSeriesService, StackingColumnSeriesService],
    standalone: true,
    selector: 'app-container',
    template: `<ejs-chart id="chart-container" [primaryXAxis]='primaryXAxis' [primaryYAxis]='primaryYAxis' [title]='title'>
        <e-series-collection>
            <e-series [dataSource]='data' type='Polar' xName='x' yName='y'  drawType='StackingColumn' name='UK'></e-series>
            <e-series [dataSource]='data' type='Polar' xName='x' yName='y1' drawType='StackingColumn' name='Germany'></e-series>
            <e-series [dataSource]='data' type='Polar' xName='x' yName='y2' drawType='StackingColumn' name='France'></e-series>
        </e-series-collection>
    </ejs-chart>`
})
export class AppComponent implements OnInit {
    public primaryXAxis?: Object;
    public primaryYAxis?: Object;
    public title?: string;
    public data?: Object[];

    ngOnInit(): void {
        this.data = chartData;
        this.primaryXAxis = {
            title: 'Year',
            valueType: 'Category'
        };
        this.primaryYAxis = {
            title: 'Revenue'
        };
        this.title = 'Mobile Game Market by Country';
    }
}
import { bootstrapApplication } from '@angular/platform-browser';
import { AppComponent } from './app.component';
import 'zone.js';
bootstrapApplication(AppComponent).catch((err) => console.error(err));export let chartData: object[] = [
{ x: 2000, y: 0.61, y1: 0.03, y2: 0.48},
{ x: 2001, y: 0.81, y1: 0.05, y2: 0.53 },
{ x: 2002, y: 0.91, y1: 0.06, y2: 0.57 },
{ x: 2003, y: 1, y1: 0.09, y2: 0.61 },
{ x: 2004, y: 1.19, y1: 0.14, y2: 0.63 },
{ x: 2005, y: 1.47, y1: 0.20, y2: 0.64 },
{ x: 2006, y: 1.74, y1: 0.29, y2: 0.66 },
{ x: 2007, y: 1.98, y1: 0.46, y2: 0.76 },
{ x: 2008, y: 1.99, y1: 0.64, y2: 0.77 },
{ x: 2009, y: 1.70, y1: 0.75, y2: 0.55 }
];Range Column
Use drawType='RangeColumn' to render columns that span a value range. Each data point must include high and low fields mapped to series properties of the same name. Required service: RangeColumnSeriesService.
import { ChartModule, CategoryService, PolarSeriesService, RangeColumnSeriesService } from '@syncfusion/ej2-angular-charts';
import { Component, OnInit } from '@angular/core';
import { chartData } from './datasource';

@Component({
    imports: [ChartModule],
    providers: [CategoryService, PolarSeriesService, RangeColumnSeriesService],
    standalone: true,
    selector: 'app-container',
    template: `<ejs-chart id="chart-container" [primaryXAxis]='primaryXAxis' [primaryYAxis]='primaryYAxis' [title]='title'>
        <e-series-collection>
            <e-series [dataSource]='data' type='Polar' xName='x' high='high' low='low' drawType='RangeColumn' name='Gold'></e-series>
        </e-series-collection>
    </ejs-chart>`
})
export class AppComponent implements OnInit {
    public primaryXAxis?: Object;
    public primaryYAxis?: Object;
    public title?: string;
    public data?: Object[];

    ngOnInit(): void {
        this.data = chartData;
        this.primaryXAxis = {
            valueType: 'Category',
            title: 'Months'
        };
        this.primaryYAxis = {
            title: 'Temperature (Celsius)'
        };
        this.title = 'Maximum and Minimum Temperature';
    }
}
import { bootstrapApplication } from '@angular/platform-browser';
import { AppComponent } from './app.component';
import 'zone.js';
bootstrapApplication(AppComponent).catch((err) => console.error(err));export let chartData: Object[] = [
{ x: 'Jan', low: 0.7, high: 6.1 },
{ x: 'Feb', low: 1.3, high: 6.3 },
{ x: 'Mar', low: 1.9, high: 8.5 },
{ x: 'Apr', low: 3.1, high: 10.8 },
{ x: 'May', low: 5.7, high: 14.40 },
{ x: 'Jun', low: 8.4, high: 16.90 },
{ x: 'Jul', low: 10.6, high: 19.20 },
{ x: 'Aug', low: 10.5, high: 18.9 },
{ x: 'Sep', low: 8.5, high: 16.1 },
{ x: 'Oct', low: 6.0, high: 12.5 },
{ x: 'Nov', low: 1.5, high: 6.9 },
{ x: 'Dec', low: 5.1, high: 12.1 }
];Scatter
Use drawType='Scatter' to render individual polar markers. Required service: ScatterSeriesService.
import { ChartModule, CategoryService, PolarSeriesService, ScatterSeriesService } from '@syncfusion/ej2-angular-charts';
import { Component, OnInit } from '@angular/core';
import { polarCategory } from './datasource';

@Component({
    imports: [ChartModule],
    providers: [CategoryService, PolarSeriesService, ScatterSeriesService],
    standalone: true,
    selector: 'app-container',
    template: `<ejs-chart id="chart-container" [primaryXAxis]='primaryXAxis' [primaryYAxis]='primaryYAxis' [title]='title'>
        <e-series-collection>
            <e-series [dataSource]='data' type='Polar' xName='x' yName='y' drawType='Scatter' name='London'></e-series>
        </e-series-collection>
    </ejs-chart>`
})
export class AppComponent implements OnInit {
    public primaryXAxis?: Object;
    public primaryYAxis?: Object;
    public title?: string;
    public data?: Object[];

    ngOnInit(): void {
        this.data = polarCategory;
        this.primaryXAxis = {
            title: 'Month',
            valueType: 'Category'
        };
        this.primaryYAxis = {
            minimum: -5,
            maximum: 35,
            interval: 10,
            title: 'Temperature in Celsius',
            labelFormat: '{value}C'
        };
        this.title = 'Climate Graph-2012';
    }
}
import { bootstrapApplication } from '@angular/platform-browser';
import { AppComponent } from './app.component';
import 'zone.js';
bootstrapApplication(AppComponent).catch((err) => console.error(err));export let polarCategory: Object[] =[{ x: 'Jan', y: -1 }, { x: 'Feb', y: -1 }, { x: 'Mar', y: 2 },
{ x: 'Apr', y: 8 }, { x: 'May', y: 13 }, { x: 'Jun', y: 18 },
{ x: 'Jul', y: 21 }, { x: 'Aug', y: 20 }, { x: 'Sep', y: 16 },
{ x: 'Oct', y: 10 }, { x: 'Nov', y: 4 }, { x: 'Dec', y: 0 }];
export let stackedData: Object[] = [{ x: '2000', y: 0.61, y1: 0.03, y2: 0.48},
{ x: '2001', y: 0.81, y1: 0.05, y2: 0.53 },
{ x: '2002', y: 0.91, y1: 0.06, y2: 0.57 },
{ x: '2003', y: 1, y1: 0.09, y2: 0.61 },
{ x: '2004', y: 1.19, y1: 0.14, y2: 0.63 },
{ x: '2005', y: 1.47, y1: 0.20, y2: 0.64 },
{ x: '2006', y: 1.74, y1: 0.29, y2: 0.66 },
{ x: '2007', y: 1.98, y1: 0.46, y2: 0.76 },
{ x: '2008', y: 1.99, y1: 0.64, y2: 0.77 },
{ x: '2009', y: 1.70, y1: 0.75, y2: 0.55 }];
export let columnData: Object[] = [
{ country: "USA", gold: 50 },
{ country: "China", gold: 40 },
{ country: "Japan", gold: 70 },
{ country: "Australia", gold: 60 },
{ country: "France", gold: 50 },
{ country: "Germany", gold: 40 },
{ country: "Italy", gold: 40 },
{ country: "Sweden", gold: 30 }];
export let data: Object[] = [
{ x: '2014', y: 111.1, y1: 76.9, y2: 66.1, y3: 34.1 },
{ x: '2015', y: 127.3, y1: 99.5, y2: 79.3, y3: 38.2 },
{ x: '2016', y: 143.4, y1: 121.7, y2: 91.3, y3: 44.0 },
{ x: '2017', y: 159.9, y1: 142.5, y2: 102.4, y3: 51.6 },
{ x: '2018', y: 175.4, y1: 166.7, y2: 112.9, y3: 61.9 },
{ x: '2019', y: 189.0, y1: 182.9, y2: 122.4, y3: 71.5 },
{ x: '2020', y: 202.7, y1: 197.3, y2: 120.9, y3: 82.0 }
];
export let rangeData: Object[] = [
{ x: 'Jan', low: 0.7, high: 6.1 }, { x: 'Feb', low: 1.3, high: 6.3 }, { x: 'Mar', low: 1.9, high: 8.5 },
{ x: 'Apr', low: 3.1, high: 10.8 }, { x: 'May', low: 5.7, high: 14.40 }, { x: 'Jun', low: 8.4, high: 16.90 },
{ x: 'Jul', low: 10.6,high: 19.20 }, { x: 'Aug', low: 10.5,high: 18.9 }, { x: 'Sep', low: 8.5, high: 16.1 },
{ x: 'Oct', low: 6.0, high: 12.5 }, { x: 'Nov', low: 1.5, high: 6.9 }, { x: 'Dec', low: 5.1, high: 12.1 }];
export let radarData: Object[] = [{ x: 2005, y: 28 }, { x: 2006, y: 25 },{ x: 2007, y: 26 }, { x: 2008, y: 27 },
{ x: 2009, y: 32 }, { x: 2010, y: 35 }, { x: 2011, y: 30 }];Spline Area
Use drawType='SplineArea' to render a polar spline area chart with smooth curved fills. Required service: SplineAreaSeriesService.
import { ChartModule, PolarSeriesService, SplineAreaSeriesService } from '@syncfusion/ej2-angular-charts';
import { Component, OnInit } from '@angular/core';
import { chartData } from './datasource';

@Component({
    imports: [ChartModule],
    providers: [PolarSeriesService, SplineAreaSeriesService],
    standalone: true,
    selector: 'app-container',
    template: `<ejs-chart id="chart-container" [primaryXAxis]='primaryXAxis' [primaryYAxis]='primaryYAxis' [title]='title'>
        <e-series-collection>
            <e-series [dataSource]='data' type='Polar' xName='x' yName='y' drawType='SplineArea' name='Gold'></e-series>
        </e-series-collection>
    </ejs-chart>`
})
export class AppComponent implements OnInit {
    public primaryXAxis?: Object;
    public primaryYAxis?: Object;
    public title?: string;
    public data?: Object[];

    ngOnInit(): void {
        this.data = chartData;
        this.primaryXAxis = {
            title: 'Year'
        };
        this.primaryYAxis = {
            title: 'Temperature (Celsius)'
        };
        this.title = 'Maximum and Minimum Temperature';
    }
}
import { bootstrapApplication } from '@angular/platform-browser';
import { AppComponent } from './app.component';
import 'zone.js';
bootstrapApplication(AppComponent).catch((err) => console.error(err));export let chartData: Object[] = [
{ x: 2005, y: 28 },
{ x: 2006, y: 25 },
{ x: 2007, y: 26 },
{ x: 2008, y: 27 },
{ x: 2009, y: 32 },
{ x: 2010, y: 35 },
{ x: 2011, y: 30 }
];Series customization
Start angle
Use the startAngle property on primaryXAxis to rotate the angular axis. Default is 0 degrees.
import { ChartModule, PolarSeriesService, LineSeriesService } from '@syncfusion/ej2-angular-charts';
import { Component, OnInit } from '@angular/core';
import { radarData } from './datasource';

@Component({
    imports: [ChartModule],
    providers: [PolarSeriesService, LineSeriesService],
    standalone: true,
    selector: 'app-container',
    template: `<ejs-chart id="chart-container" [primaryXAxis]='primaryXAxis' [primaryYAxis]='primaryYAxis' [title]='title'>
        <e-series-collection>
            <e-series [dataSource]='data' type='Polar' xName='x' yName='y' drawType='Line'></e-series>
        </e-series-collection>
    </ejs-chart>`
})
export class AppComponent implements OnInit {
    public primaryXAxis?: Object;
    public primaryYAxis?: Object;
    public title?: string;
    public data?: Object[];

    ngOnInit(): void {
        this.data = radarData;
        this.primaryXAxis = {
            title: 'Year',
            startAngle: 90,
            minimum: 2004,
            maximum: 2012,
            interval: 1
        };
        this.primaryYAxis = {
            minimum: 20,
            maximum: 40,
            interval: 5,
            title: 'Efficiency',
            labelFormat: '{value}%'
        };
        this.title = 'Efficiency of oil-fired power production';
    }
}
import { bootstrapApplication } from '@angular/platform-browser';
import { AppComponent } from './app.component';
import 'zone.js';
bootstrapApplication(AppComponent).catch((err) => console.error(err));export let radarData: Object[] = [{ x: 2005, y: 28 },
{ x: 2006, y: 25 },
{ x: 2007, y: 26 },
{ x: 2008, y: 27 },
{ x: 2009, y: 32 },
{ x: 2010, y: 35 },
{ x: 2011, y: 30 }
];Radius
Use the coefficient property on primaryXAxis to adjust the radial extent of the polar chart. Default is 100.
import { ChartModule, PolarSeriesService, LineSeriesService } from '@syncfusion/ej2-angular-charts';
import { Component, OnInit } from '@angular/core';
import { radarData } from './datasource';

@Component({
    imports: [ChartModule],
    providers: [PolarSeriesService, LineSeriesService],
    standalone: true,
    selector: 'app-container',
    template: `<ejs-chart id="chart-container" [primaryXAxis]='primaryXAxis' [primaryYAxis]='primaryYAxis' [title]='title'>
        <e-series-collection>
            <e-series [dataSource]='data' type='Polar' xName='x' yName='y' drawType='Line'></e-series>
        </e-series-collection>
    </ejs-chart>`
})
export class AppComponent implements OnInit {
    public primaryXAxis?: Object;
    public primaryYAxis?: Object;
    public title?: string;
    public data?: Object[];

    ngOnInit(): void {
        this.data = radarData;
        this.primaryXAxis = {
            title: 'Year',
            coefficient: 50,
            minimum: 2004,
            maximum: 2012,
            interval: 1
        };
        this.primaryYAxis = {
            minimum: 20,
            maximum: 40,
            interval: 5,
            title: 'Efficiency',
            labelFormat: '{value}%'
        };
        this.title = 'Efficiency of oil-fired power production';
    }
}
import { bootstrapApplication } from '@angular/platform-browser';
import { AppComponent } from './app.component';
import 'zone.js';
bootstrapApplication(AppComponent).catch((err) => console.error(err));export let polarCategory: Object[] =[{ x: 'Jan', y: -1 }, { x: 'Feb', y: -1 }, { x: 'Mar', y: 2 },
{ x: 'Apr', y: 8 }, { x: 'May', y: 13 }, { x: 'Jun', y: 18 },
{ x: 'Jul', y: 21 }, { x: 'Aug', y: 20 }, { x: 'Sep', y: 16 },
{ x: 'Oct', y: 10 }, { x: 'Nov', y: 4 }, { x: 'Dec', y: 0 }];
export let stackedData: Object[] = [{ x: '2000', y: 0.61, y1: 0.03, y2: 0.48},
{ x: '2001', y: 0.81, y1: 0.05, y2: 0.53 },
{ x: '2002', y: 0.91, y1: 0.06, y2: 0.57 },
{ x: '2003', y: 1, y1: 0.09, y2: 0.61 },
{ x: '2004', y: 1.19, y1: 0.14, y2: 0.63 },
{ x: '2005', y: 1.47, y1: 0.20, y2: 0.64 },
{ x: '2006', y: 1.74, y1: 0.29, y2: 0.66 },
{ x: '2007', y: 1.98, y1: 0.46, y2: 0.76 },
{ x: '2008', y: 1.99, y1: 0.64, y2: 0.77 },
{ x: '2009', y: 1.70, y1: 0.75, y2: 0.55 }];
export let columnData: Object[] = [
{ country: "USA", gold: 50 },
{ country: "China", gold: 40 },
{ country: "Japan", gold: 70 },
{ country: "Australia", gold: 60 },
{ country: "France", gold: 50 },
{ country: "Germany", gold: 40 },
{ country: "Italy", gold: 40 },
{ country: "Sweden", gold: 30 }];
export let data: Object[] = [
{ x: '2014', y: 111.1, y1: 76.9, y2: 66.1, y3: 34.1 },
{ x: '2015', y: 127.3, y1: 99.5, y2: 79.3, y3: 38.2 },
{ x: '2016', y: 143.4, y1: 121.7, y2: 91.3, y3: 44.0 },
{ x: '2017', y: 159.9, y1: 142.5, y2: 102.4, y3: 51.6 },
{ x: '2018', y: 175.4, y1: 166.7, y2: 112.9, y3: 61.9 },
{ x: '2019', y: 189.0, y1: 182.9, y2: 122.4, y3: 71.5 },
{ x: '2020', y: 202.7, y1: 197.3, y2: 120.9, y3: 82.0 }
];
export let rangeData: Object[] = [
{ x: 'Jan', low: 0.7, high: 6.1 }, { x: 'Feb', low: 1.3, high: 6.3 }, { x: 'Mar', low: 1.9, high: 8.5 },
{ x: 'Apr', low: 3.1, high: 10.8 }, { x: 'May', low: 5.7, high: 14.40 }, { x: 'Jun', low: 8.4, high: 16.90 },
{ x: 'Jul', low: 10.6,high: 19.20 }, { x: 'Aug', low: 10.5,high: 18.9 }, { x: 'Sep', low: 8.5, high: 16.1 },
{ x: 'Oct', low: 6.0, high: 12.5 }, { x: 'Nov', low: 1.5, high: 6.9 }, { x: 'Dec', low: 5.1, high: 12.1 }];
export let radarData: Object[] = [{ x: 2005, y: 28 }, { x: 2006, y: 25 },{ x: 2007, y: 26 }, { x: 2008, y: 27 },
{ x: 2009, y: 32 }, { x: 2010, y: 35 }, { x: 2011, y: 30 }];Empty points
A data point whose mapped value is null or undefined is empty. Configure its behavior with emptyPointSettings.mode.
Mode
Use mode to control empty-point rendering. The default is Gap.
| Mode | Visual behavior |
|---|---|
Gap |
Skip the empty point; the line breaks at the gap. |
Drop |
Drop the empty bar; subsequent segments are still rendered. |
Zero |
Treat the empty point as 0 and render a flat segment. |
Average |
Replace the empty value with the average of the surrounding points. |
import { ChartModule, PolarSeriesService, LineSeriesService } from '@syncfusion/ej2-angular-charts';
import { Component, OnInit } from '@angular/core';
import { radarData } from './datasource';

@Component({
    imports: [ChartModule],
    providers: [PolarSeriesService, LineSeriesService],
    standalone: true,
    selector: 'app-container',
    template: `<ejs-chart id="chart-container" [primaryXAxis]='primaryXAxis' [title]='title'>
        <e-series-collection>
            <e-series [dataSource]='data' type='Polar' xName='x' yName='y' drawType='Line' [emptyPointSettings]='emptyPointSettings'></e-series>
        </e-series-collection>
    </ejs-chart>`
})
export class AppComponent implements OnInit {
    public primaryXAxis?: Object;
    public title?: string;
    public data?: Object[];
    public emptyPointSettings?: Object;

    ngOnInit(): void {
        this.data = radarData;
        this.primaryXAxis = {
            title: 'Year',
            startAngle: 90,
            minimum: 2004,
            maximum: 2012,
            interval: 1
        };
        this.emptyPointSettings = {
            mode: 'Zero'
        };
        this.title = 'Efficiency of oil-fired power production';
    }
}
import { bootstrapApplication } from '@angular/platform-browser';
import { AppComponent } from './app.component';
import 'zone.js';
bootstrapApplication(AppComponent).catch((err) => console.error(err));export let radarData: Object[] = [
{ x: 2005, y: 28 },
{ x: 2006, y: 25 },
{ x: 2007, y: 26 },
{ x: 2008, y: null },
{ x: 2009, y: 32 },
{ x: 2010, y: 35 },
{ x: 2011, y: 30 }
];Empty-point fill
Use the emptyPointSettings.fill property to customize the fill color of empty segments.
import { ChartModule, PolarSeriesService, LineSeriesService } from '@syncfusion/ej2-angular-charts';
import { Component, OnInit } from '@angular/core';
import { radarData } from './datasource';

@Component({
    imports: [ChartModule],
    providers: [PolarSeriesService, LineSeriesService],
    standalone: true,
    selector: 'app-container',
    template: `<ejs-chart id="chart-container" [primaryXAxis]='primaryXAxis' [title]='title'>
        <e-series-collection>
            <e-series [dataSource]='data' type='Polar' xName='x' yName='y' drawType='Line' [emptyPointSettings]='emptyPointSettings' [marker]='marker'></e-series>
        </e-series-collection>
    </ejs-chart>`
})
export class AppComponent implements OnInit {
    public primaryXAxis?: Object;
    public title?: string;
    public data?: Object[];
    public emptyPointSettings?: Object;
    public marker?: Object;

    ngOnInit(): void {
        this.data = radarData;
        this.marker = { visible: true};
        this.primaryXAxis = {
            title: 'Year',
            startAngle: 90,
            minimum: 2004,
            maximum: 2012,
            interval: 1
        };
        this.emptyPointSettings = {
            mode: 'Zero',
            fill: 'red'
        };
        this.title = 'Efficiency of oil-fired power production';
    }
}
import { bootstrapApplication } from '@angular/platform-browser';
import { AppComponent } from './app.component';
import 'zone.js';
bootstrapApplication(AppComponent).catch((err) => console.error(err));export let radarData: Object[] = [
{ x: 2005, y: 28 },
{ x: 2006, y: 25 },
{ x: 2007, y: 26 },
{ x: 2008, y: null },
{ x: 2009, y: 32 },
{ x: 2010, y: 35 },
{ x: 2011, y: 30 }
];Empty-point border
Use the emptyPointSettings.border object ({ width, color }) to customize the outline of empty segments.
import { ChartModule, PolarSeriesService, LineSeriesService } from '@syncfusion/ej2-angular-charts';
import { Component, OnInit } from '@angular/core';
import { radarData } from './datasource';

@Component({
    imports: [ChartModule],
    providers: [PolarSeriesService, LineSeriesService],
    standalone: true,
    selector: 'app-container',
    template: `<ejs-chart id="chart-container" [primaryXAxis]='primaryXAxis' [title]='title'>
        <e-series-collection>
            <e-series [dataSource]='data' type='Polar' xName='x' yName='y' drawType='Line' [marker]='marker' [emptyPointSettings]='emptyPointSettings'></e-series>
        </e-series-collection>
    </ejs-chart>`
})
export class AppComponent implements OnInit {
    public primaryXAxis?: Object;
    public title?: string;
    public data?: Object[];
    public emptyPointSettings?: Object;
    public marker?: Object;

    ngOnInit(): void {
        this.data = radarData;
        this.primaryXAxis = {
            title: 'Year',
            startAngle: 90,
            minimum: 2004,
            maximum: 2012,
            interval: 1
        };
        this.marker = {visible: true};
        this.emptyPointSettings = {
            mode: 'Zero',
            fill: 'red',
            border: { width: 2, color: 'blue' }
        };
        this.title = 'Efficiency of oil-fired power production';
    }
}
import { bootstrapApplication } from '@angular/platform-browser';
import { AppComponent } from './app.component';
import 'zone.js';
bootstrapApplication(AppComponent).catch((err) => console.error(err));export let radarData: Object[] = [
{ x: 2005, y: 28 },
{ x: 2006, y: 25 },
{ x: 2007, y: 26 },
{ x: 2008, y: null },
{ x: 2009, y: 32 },
{ x: 2010, y: 35 },
{ x: 2011, y: 30 }
];Events
Series render
The seriesRender event allows you to customize series properties, such as data, fill, and name, before they are rendered on the chart. The callback receives an ISeriesRenderEventArgs argument that exposes mutable series, data, and fill properties.
<ejs-chart (seriesRender)="onSeriesRender($event)"></ejs-chart>import { ISeriesRenderEventArgs } from '@syncfusion/ej2-charts';
import { ChartModule, PolarSeriesService, LineSeriesService } from '@syncfusion/ej2-angular-charts';
import { Component, OnInit } from '@angular/core';
import { radarData } from './datasource';
@Component({
imports: [ChartModule],
providers: [PolarSeriesService, LineSeriesService],
standalone: true,
selector: 'app-container',
template: `<ejs-chart id="chart-container" (seriesRender)='seriesRender($event)' [primaryXAxis]='primaryXAxis' [title]='title'>
<e-series-collection>
<e-series [dataSource]='data' type='Polar' xName='x' yName='y' drawType='Line'></e-series>
</e-series-collection>
</ejs-chart>`
})
export class AppComponent implements OnInit {
public primaryXAxis?: Object;
public title?: string;
public data?: Object[];
ngOnInit(): void {
this.data = radarData;
this.primaryXAxis = {
title: 'Year',
startAngle: 90,
minimum: 2004,
maximum: 2012,
interval: 1
};
this.title = 'Efficiency of oil-fired power production';
}
public seriesRender(args: ISeriesRenderEventArgs): void {
args.fill = '#ff6347';
}
}import { bootstrapApplication } from '@angular/platform-browser';
import { AppComponent } from './app.component';
import 'zone.js';
bootstrapApplication(AppComponent).catch((err) => console.error(err));export let radarData: Object[] = [{ x: 2005, y: 28 },
{ x: 2006, y: 25 },
{ x: 2007, y: 26 },
{ x: 2008, y: 27 },
{ x: 2009, y: 32 },
{ x: 2010, y: 35 },
{ x: 2011, y: 30 }
];Point render
The pointRender event allows you to customize each data point before it is rendered on the chart. The callback receives an IPointRenderEventArgs argument that exposes the current point, series, fill, and border.
<ejs-chart (pointRender)="onPointRender($event)"></ejs-chart>import { IPointRenderEventArgs } from '@syncfusion/ej2-charts';
import { ChartModule, PolarSeriesService, LineSeriesService } from '@syncfusion/ej2-angular-charts';
import { Component, OnInit } from '@angular/core';
import { radarData } from './datasource';
@Component({
imports: [ChartModule],
providers: [PolarSeriesService, LineSeriesService],
standalone: true,
selector: 'app-container',
template: `<ejs-chart id="chart-container" (pointRender)='pointRender($event)' [primaryXAxis]='primaryXAxis' [title]='title'>
<e-series-collection>
<e-series [dataSource]='data' type='Polar' xName='x' yName='y' drawType='Line' [marker]='marker'></e-series>
</e-series-collection>
</ejs-chart>`
})
export class AppComponent implements OnInit {
public primaryXAxis?: Object;
public title?: string;
public data?: Object[];
public marker?: Object;
ngOnInit(): void {
this.data = radarData;
this.primaryXAxis = {
title: 'Year',
startAngle: 90,
minimum: 2004,
maximum: 2012,
interval: 1
};
this.title = 'Efficiency of oil-fired power production';
this.marker = {visible: true};
}
public pointRender(args: IPointRenderEventArgs): void {
args.fill = '#ff6347';
}
}import { bootstrapApplication } from '@angular/platform-browser';
import { AppComponent } from './app.component';
import 'zone.js';
bootstrapApplication(AppComponent).catch((err) => console.error(err));export let radarData: Object[] = [{ x: 2005, y: 28 },
{ x: 2006, y: 25 },
{ x: 2007, y: 26 },
{ x: 2008, y: 27 },
{ x: 2009, y: 32 },
{ x: 2010, y: 35 },
{ x: 2011, y: 30 }
];Troubleshooting
The following symptoms map to the most common configuration issues.
-
Empty plot area: Verify that
PolarSeriesServiceis registered, the seriestypeisPolar, and the draw-type-specific service (for exampleLineSeriesService,SplineSeriesService,ColumnSeriesService) is also registered. -
startAngleorcoefficienthas no effect: They live onprimaryXAxis, not on the series — Verify the property is set in the axis block, not on<e-series>. -
Empty-point settings have no visual effect: Confirm that
nullorundefinedexists in the data values mapped toyName, and thatemptyPointSettings.modematches the desired behavior. -
Event handlers do not fire: Confirm that
seriesRenderorpointRenderare bound on the<ejs-chart>element, not on the<e-series>, and that the handler is apublicmethod on the component.