Pareto Chart in Angular Charts
Pareto
A Pareto chart ranks categorical data by frequency and overlays a cumulative percentage line. It is a combination of Column and Line series, where the bars represent individual category counts (sorted descending) and the line represents the running cumulative percentage.
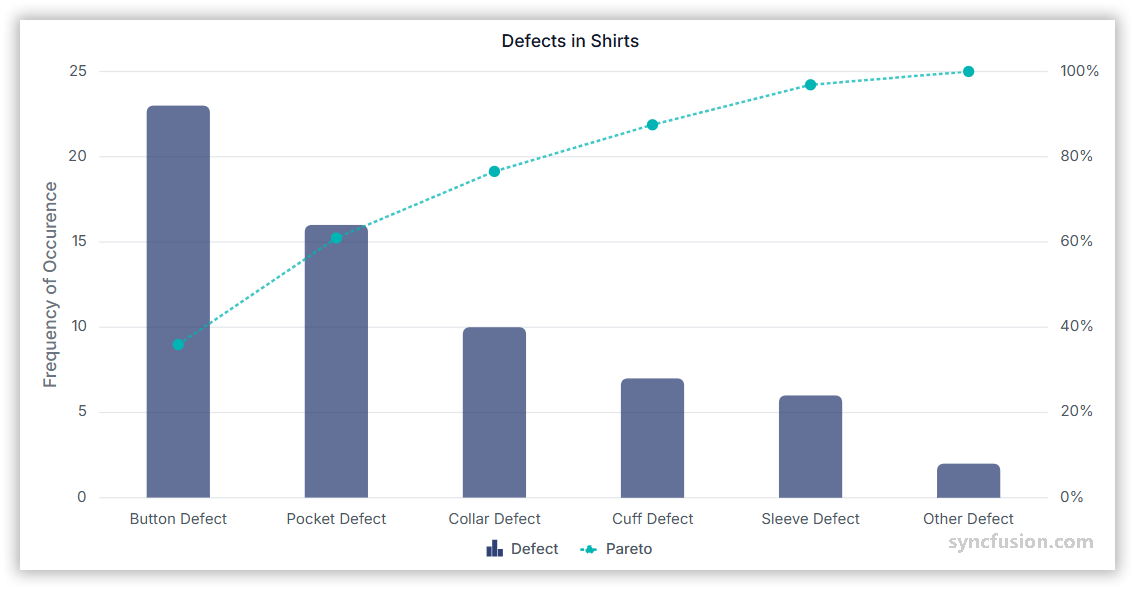
To render a Pareto series in your chart, follow these steps to configure it correctly:
-
Set the series type: Define the series
typeasParetoin your chart configuration. -
Register the services: Inject
ParetoSeriesService,LineSeriesService, andColumnSeriesServiceinto the componentprovidersarray. For category-axis data also includeCategoryService. These services power the line, column, and pareto sub-renderers that compose a Pareto series. -
Map the category and count data: Bind the data through the series
dataSourceproperty and map the category and value fields toxNameandyName. The chart sorts categories byyNamein descending order by default.
import { ChartModule, CategoryService, ParetoSeriesService, LineSeriesService, ColumnSeriesService } from '@syncfusion/ej2-angular-charts';

import { Component, OnInit } from '@angular/core';
import { paretoData } from './datasource';

@Component({
    imports: [ChartModule],
    providers: [CategoryService, ParetoSeriesService, LineSeriesService, ColumnSeriesService],
    standalone: true,
    selector: 'app-container',
    template: `<ejs-chart id="chart-container" [primaryXAxis]='primaryXAxis' [primaryYAxis]='primaryYAxis' [title]='title' [tooltip]='tooltip'>
        <e-series-collection>
            <e-series [dataSource]='chartData' type='Pareto' xName='x' yName='y' name='Defect'></e-series>
        </e-series-collection>
    </ejs-chart>`
})
export class AppComponent implements OnInit {
    public primaryXAxis?: Object;
    public chartData?: Object[];
    public title?: string;
    public primaryYAxis?: Object;
    public tooltip?: Object;

    ngOnInit(): void {
        this.chartData = paretoData;
        this.primaryXAxis = {
            title: 'Defects',
            valueType: 'Category'
        };
        this.primaryYAxis = {
            title: 'Frequency of Occurrence',
            minimum: 0,
            maximum: 150,
            interval: 30
        };
        this.tooltip = { enable: true, shared: true };
        this.title = 'Pareto chart - Defects in Shirts';
    }

}
import { bootstrapApplication } from '@angular/platform-browser';
import { AppComponent } from './app.component';
import 'zone.js';
bootstrapApplication(AppComponent).catch((err) => console.error(err));export let paretoData: Object[] = [
{ x: 'Button Defect', y: 23 },
{ x: 'Pocket Defect', y: 16 },
{ x: 'Coller Defect', y: 10 },
{ x: 'Cuff Defect', y: 7 },
{ x: 'Sleeve Defect', y: 6 },
{ x: 'Other Defect', y: 2 }
];Pareto customization
Customize a Pareto series using the paretoOptions object that exposes fill, width, dashArray, marker, and showAxis for the cumulative line, and standard column properties (fill, width, columnWidth, cornerRadius, opacity) for the bars.
Fill
Use the paretoOptions.fill property to apply a color to the Pareto line.
import { ChartModule, CategoryService, ParetoSeriesService, LineSeriesService, ColumnSeriesService } from '@syncfusion/ej2-angular-charts';

import { Component, OnInit } from '@angular/core';
import { paretoData } from './datasource';

@Component({
    imports: [ChartModule],
    providers: [CategoryService, ParetoSeriesService, LineSeriesService, ColumnSeriesService],
    standalone: true,
    selector: 'app-container',
    template: `<ejs-chart id="chart-container" [primaryXAxis]='primaryXAxis' [primaryYAxis]='primaryYAxis' [title]='title'>
        <e-series-collection>
            <e-series [dataSource]='chartData' type='Pareto' xName='x' yName='y' name='Defect' [paretoOptions]='paretoOptions'></e-series>
        </e-series-collection>
    </ejs-chart>`
})
export class AppComponent implements OnInit {
    public primaryXAxis?: Object;
    public chartData?: Object[];
    public title?: string;
    public primaryYAxis?: Object;
    public paretoOptions: Object = {
        fill: '#F7523F'
    };

    ngOnInit(): void {
        this.chartData = paretoData;
        this.primaryXAxis = {
            title: 'Defects',
            valueType: 'Category'
        };
        this.primaryYAxis = {
            title: 'Frequency of Occurrence',
            minimum: 0,
            maximum: 30
        };
        this.title = 'Defects in Shirts';
    }

}
import { bootstrapApplication } from '@angular/platform-browser';
import { AppComponent } from './app.component';
import 'zone.js';
bootstrapApplication(AppComponent).catch((err) => console.error(err));export let paretoData: Object[] = [
{ x: 'Button Defect', y: 23 },
{ x: 'Pocket Defect', y: 16 },
{ x: 'Collar Defect', y: 10 },
{ x: 'Cuff Defect', y: 7 },
{ x: 'Sleeve Defect', y: 6 },
{ x: 'Other Defect', y: 2 }
];Width
Use the paretoOptions.width property to control the thickness of the Pareto line, in pixels.
import { ChartModule, CategoryService, ParetoSeriesService, LineSeriesService, ColumnSeriesService } from '@syncfusion/ej2-angular-charts';

import { Component, OnInit } from '@angular/core';
import { paretoData } from './datasource';

@Component({
    imports: [ChartModule],
    providers: [CategoryService, ParetoSeriesService, LineSeriesService, ColumnSeriesService],
    standalone: true,
    selector: 'app-container',
    template: `<ejs-chart id="chart-container" [primaryXAxis]='primaryXAxis' [primaryYAxis]='primaryYAxis' [title]='title'>
        <e-series-collection>
            <e-series [dataSource]='chartData' type='Pareto' xName='x' yName='y' name='Defect' [paretoOptions]='paretoOptions'></e-series>
        </e-series-collection>
    </ejs-chart>`
})
export class AppComponent implements OnInit {
    public primaryXAxis?: Object;
    public chartData?: Object[];
    public title?: string;
    public primaryYAxis?: Object;
    public paretoOptions: Object = {
        fill: '#F7523F',
        width: 4
    };

    ngOnInit(): void {
        this.chartData = paretoData;
        this.primaryXAxis = {
            title: 'Defects',
            valueType: 'Category'
        };
        this.primaryYAxis = {
            title: 'Frequency of Occurrence',
            minimum: 0,
            maximum: 30
        };
        this.title = 'Defects in Shirts';
    }

}
import { bootstrapApplication } from '@angular/platform-browser';
import { AppComponent } from './app.component';
import 'zone.js';
bootstrapApplication(AppComponent).catch((err) => console.error(err));export let paretoData: Object[] = [
{ x: 'Button Defect', y: 23 },
{ x: 'Pocket Defect', y: 16 },
{ x: 'Collar Defect', y: 10 },
{ x: 'Cuff Defect', y: 7 },
{ x: 'Sleeve Defect', y: 6 },
{ x: 'Other Defect', y: 2 }
];Dash array
Use the paretoOptions.dashArray property to apply a custom dash pattern (for example "3,3") to the Pareto line.
import { ChartModule, CategoryService, ParetoSeriesService, LineSeriesService, ColumnSeriesService } from '@syncfusion/ej2-angular-charts';

import { Component, OnInit } from '@angular/core';
import { paretoData } from './datasource';

@Component({
    imports: [ChartModule],
    providers: [CategoryService, ParetoSeriesService, LineSeriesService, ColumnSeriesService],
    standalone: true,
    selector: 'app-container',
    template: `<ejs-chart id="chart-container" [primaryXAxis]='primaryXAxis' [primaryYAxis]='primaryYAxis' [title]='title'>
        <e-series-collection>
            <e-series [dataSource]='chartData' type='Pareto' xName='x' yName='y' name='Defect' [paretoOptions]='paretoOptions'></e-series>
        </e-series-collection>
    </ejs-chart>`
})
export class AppComponent implements OnInit {
    public primaryXAxis?: Object;
    public chartData?: Object[];
    public title?: string;
    public primaryYAxis?: Object;
    public paretoOptions: Object = {
        fill: '#F7523F',
        width: 2,
        dashArray: '3,3'
    };

    ngOnInit(): void {
        this.chartData = paretoData;
        this.primaryXAxis = {
            title: 'Defects',
            valueType: 'Category'
        };
        this.primaryYAxis = {
            title: 'Frequency of Occurrence',
            minimum: 0,
            maximum: 30
        };
        this.title = 'Defects in Shirts';
    }

}
import { bootstrapApplication } from '@angular/platform-browser';
import { AppComponent } from './app.component';
import 'zone.js';
bootstrapApplication(AppComponent).catch((err) => console.error(err));export let paretoData: Object[] = [
{ x: 'Button Defect', y: 23 },
{ x: 'Pocket Defect', y: 16 },
{ x: 'Collar Defect', y: 10 },
{ x: 'Cuff Defect', y: 7 },
{ x: 'Sleeve Defect', y: 6 },
{ x: 'Other Defect', y: 2 }
];Marker
Use the paretoOptions.marker object to display and customize markers on every Pareto line point. Set visible: true, and tune width, height, isFilled, and shape.
import { ChartModule, CategoryService, ParetoSeriesService, LineSeriesService, ColumnSeriesService } from '@syncfusion/ej2-angular-charts';

import { Component, OnInit } from '@angular/core';
import { paretoData } from './datasource';

@Component({
    imports: [ChartModule],
    providers: [CategoryService, ParetoSeriesService, LineSeriesService, ColumnSeriesService],
    standalone: true,
    selector: 'app-container',
    template: `<ejs-chart id="chart-container" [primaryXAxis]='primaryXAxis' [primaryYAxis]='primaryYAxis' [title]='title'>
        <e-series-collection>
            <e-series [dataSource]='chartData' type='Pareto' xName='x' yName='y' name='Defect' [paretoOptions]='paretoOptions'></e-series>
        </e-series-collection>
    </ejs-chart>`
})
export class AppComponent implements OnInit {
    public primaryXAxis?: Object;
    public chartData?: Object[];
    public title?: string;
    public primaryYAxis?: Object;
    public paretoOptions: Object = {
        fill: '#F7523F',
        width: 2,
        marker: { visible: true, isFilled: true, width: 7, height: 7 }
    };

    ngOnInit(): void {
        this.chartData = paretoData;
        this.primaryXAxis = {
            title: 'Defects',
            valueType: 'Category'
        };
        this.primaryYAxis = {
            title: 'Frequency of Occurrence',
            minimum: 0,
            maximum: 30
        };
        this.title = 'Defects in Shirts';
    }

}
import { bootstrapApplication } from '@angular/platform-browser';
import { AppComponent } from './app.component';
import 'zone.js';
bootstrapApplication(AppComponent).catch((err) => console.error(err));export let paretoData: Object[] = [
{ x: 'Button Defect', y: 23 },
{ x: 'Pocket Defect', y: 16 },
{ x: 'Collar Defect', y: 10 },
{ x: 'Cuff Defect', y: 7 },
{ x: 'Sleeve Defect', y: 6 },
{ x: 'Other Defect', y: 2 }
];Show axis
Use the paretoOptions.showAxis boolean to show or hide the secondary value axis used for the cumulative percentage. Set showAxis: false to suppress the secondary axis.
import { ChartModule, CategoryService, ParetoSeriesService, LineSeriesService, ColumnSeriesService } from '@syncfusion/ej2-angular-charts';

import { Component, OnInit } from '@angular/core';
import { paretoData } from './datasource';

@Component({
    imports: [ChartModule],
    providers: [CategoryService, ParetoSeriesService, LineSeriesService, ColumnSeriesService],
    standalone: true,
    selector: 'app-container',
    template: `<ejs-chart id="chart-container" [primaryXAxis]='primaryXAxis' [primaryYAxis]='primaryYAxis' [title]='title'>
        <e-series-collection>
            <e-series [dataSource]='chartData' type='Pareto' xName='x' yName='y' name='Defect' [paretoOptions]='paretoOptions'></e-series>
        </e-series-collection>
    </ejs-chart>`
})
export class AppComponent implements OnInit {
    public primaryXAxis?: Object;
    public chartData?: Object[];
    public title?: string;
    public primaryYAxis?: Object;
    public paretoOptions: Object = {
        marker: { visible: true, isFilled: true, width: 7, height: 7 },
        fill: '#F7523F',
        width: 2,
        showAxis: false
    };

    ngOnInit(): void {
        this.chartData = paretoData;
        this.primaryXAxis = {
            title: 'Defects',
            valueType: 'Category'
        };
        this.primaryYAxis = {
            title: 'Frequency of Occurrence',
            minimum: 0,
            maximum: 30
        };
        this.title = 'Defects in Shirts';
    }

}
import { bootstrapApplication } from '@angular/platform-browser';
import { AppComponent } from './app.component';
import 'zone.js';
bootstrapApplication(AppComponent).catch((err) => console.error(err));export let paretoData: Object[] = [
{ x: 'Button Defect', y: 23 },
{ x: 'Pocket Defect', y: 16 },
{ x: 'Collar Defect', y: 10 },
{ x: 'Cuff Defect', y: 7 },
{ x: 'Sleeve Defect', y: 6 },
{ x: 'Other Defect', y: 2 }
];Empty points
A data point whose mapped value is null or undefined is empty. Configure its behavior with emptyPointSettings.mode. The cumulative line recalculates around empty bars according to the chosen mode.
Mode
Use mode to control empty-point rendering. The default is Gap.
| Mode | Visual behavior |
|---|---|
Gap |
Skip the empty point; the cumulative line breaks at the gap. |
Drop |
Drop the empty bar; the cumulative line continues from the previous point. |
Zero |
Treat the empty point as 0 and render a flat bar. |
Average |
Replace the empty value with the average of the surrounding points. |
import { ChartModule, CategoryService, ParetoSeriesService, LineSeriesService, ColumnSeriesService } from '@syncfusion/ej2-angular-charts';

import { Component, OnInit } from '@angular/core';
import { paretoData } from './datasource';

@Component({
    imports: [ChartModule],
    providers: [CategoryService, ParetoSeriesService, LineSeriesService, ColumnSeriesService],
    standalone: true,
    selector: 'app-container',
    template: `<ejs-chart id="chart-container" [primaryXAxis]='primaryXAxis' [primaryYAxis]='primaryYAxis' [title]='title'>
        <e-series-collection>
            <e-series [dataSource]='chartData' type='Pareto' xName='x' yName='y' name='Defect' [paretoOptions]='paretoOptions' [emptyPointSettings]='emptyPointSettings'></e-series>
        </e-series-collection>
    </ejs-chart>`
})
export class AppComponent implements OnInit {
    public primaryXAxis?: Object;
    public chartData?: Object[];
    public title?: string;
    public primaryYAxis?: Object;
    public paretoOptions: Object = {
        marker: { visible: true, isFilled: true, width: 7, height: 7 },
        fill: '#F7523F',
        width: 2
    };
    public emptyPointSettings: Object = {
        mode: 'Average'
    };

    ngOnInit(): void {
        this.chartData = paretoData;
        this.primaryXAxis = {
            title: 'Defects',
            valueType: 'Category'
        };
        this.primaryYAxis = {
            title: 'Frequency of Occurrence',
            minimum: 0,
            maximum: 30
        };
        this.title = 'Defects in Shirts';
    }

}
import { bootstrapApplication } from '@angular/platform-browser';
import { AppComponent } from './app.component';
import 'zone.js';
bootstrapApplication(AppComponent).catch((err) => console.error(err));export let paretoData: Object[] = [
{ x: 'Button Defect', y: 23 },
{ x: 'Pocket Defect', y: 16 },
{ x: 'Collar Defect', y: null },
{ x: 'Cuff Defect', y: 7 },
{ x: 'Sleeve Defect', y: 6 },
{ x: 'Other Defect', y: 2 },
{ x: 'Stitching Defect', y: null },
{ x: 'Zipper Defect', y: 3 },
{ x: 'Fabric Defect', y: 9 }
];Empty-point fill
Use the emptyPointSettings.fill property to customize the fill color of empty bars.
import { ChartModule, CategoryService, ParetoSeriesService, LineSeriesService, ColumnSeriesService } from '@syncfusion/ej2-angular-charts';

import { Component, OnInit } from '@angular/core';
import { paretoData } from './datasource';

@Component({
    imports: [ChartModule],
    providers: [CategoryService, ParetoSeriesService, LineSeriesService, ColumnSeriesService],
    standalone: true,
    selector: 'app-container',
    template: `<ejs-chart id="chart-container" [primaryXAxis]='primaryXAxis' [primaryYAxis]='primaryYAxis' [title]='title'>
        <e-series-collection>
            <e-series [dataSource]='chartData' type='Pareto' xName='x' yName='y' name='Defect' [paretoOptions]='paretoOptions' [emptyPointSettings]='emptyPointSettings'></e-series>
        </e-series-collection>
    </ejs-chart>`
})
export class AppComponent implements OnInit {
    public primaryXAxis?: Object;
    public chartData?: Object[];
    public title?: string;
    public primaryYAxis?: Object;
    public paretoOptions: Object = {
        marker: { visible: true, isFilled: true, width: 7, height: 7 },
        fill: '#F7523F',
        width: 2
    };
    public emptyPointSettings: Object = {
        mode: 'Average',
        fill: 'red'
    };

    ngOnInit(): void {
        this.chartData = paretoData;
        this.primaryXAxis = {
            title: 'Defects',
            valueType: 'Category'
        };
        this.primaryYAxis = {
            title: 'Frequency of Occurrence',
            minimum: 0,
            maximum: 30
        };
        this.title = 'Defects in Shirts';
    }

}
import { bootstrapApplication } from '@angular/platform-browser';
import { AppComponent } from './app.component';
import 'zone.js';
bootstrapApplication(AppComponent).catch((err) => console.error(err));export let paretoData: Object[] = [
{ x: 'Button Defect', y: 23 },
{ x: 'Pocket Defect', y: 16 },
{ x: 'Collar Defect', y: null },
{ x: 'Cuff Defect', y: 7 },
{ x: 'Sleeve Defect', y: 6 },
{ x: 'Other Defect', y: 2 },
{ x: 'Stitching Defect', y: null },
{ x: 'Zipper Defect', y: 3 },
{ x: 'Fabric Defect', y: 9 }
];Empty-point border
Use the emptyPointSettings.border object ({ width, color }) to customize the outline of empty bars.
import { ChartModule, CategoryService, ParetoSeriesService, LineSeriesService, ColumnSeriesService } from '@syncfusion/ej2-angular-charts';

import { Component, OnInit } from '@angular/core';
import { paretoData } from './datasource';

@Component({
    imports: [ChartModule],
    providers: [CategoryService, ParetoSeriesService, LineSeriesService, ColumnSeriesService],
    standalone: true,
    selector: 'app-container',
    template: `<ejs-chart id="chart-container" [primaryXAxis]='primaryXAxis' [primaryYAxis]='primaryYAxis' [title]='title'>
        <e-series-collection>
            <e-series [dataSource]='chartData' type='Pareto' xName='x' yName='y' name='Defect' [paretoOptions]='paretoOptions' [emptyPointSettings]='emptyPointSettings'></e-series>
        </e-series-collection>
    </ejs-chart>`
})
export class AppComponent implements OnInit {
    public primaryXAxis?: Object;
    public chartData?: Object[];
    public title?: string;
    public primaryYAxis?: Object;
    public paretoOptions: Object = {
        marker: { visible: true, isFilled: true, width: 7, height: 7 },
        fill: '#F7523F',
        width: 2
    };
    public emptyPointSettings: Object = {
        mode: 'Average',
        fill: 'red',
        border: { width: 2, color: 'green' }
    };

    ngOnInit(): void {
        this.chartData = paretoData;
        this.primaryXAxis = {
            title: 'Defects',
            valueType: 'Category'
        };
        this.primaryYAxis = {
            title: 'Frequency of Occurrence',
            minimum: 0,
            maximum: 30
        };
        this.title = 'Defects in Shirts';
    }

}
import { bootstrapApplication } from '@angular/platform-browser';
import { AppComponent } from './app.component';
import 'zone.js';
bootstrapApplication(AppComponent).catch((err) => console.error(err));export let paretoData: Object[] = [
{ x: 'Button Defect', y: 23 },
{ x: 'Pocket Defect', y: 16 },
{ x: 'Collar Defect', y: null },
{ x: 'Cuff Defect', y: 7 },
{ x: 'Sleeve Defect', y: 6 },
{ x: 'Other Defect', y: 2 },
{ x: 'Stitching Defect', y: null },
{ x: 'Zipper Defect', y: 3 },
{ x: 'Fabric Defect', y: 9 }
];Events
Series render
The seriesRender event allows you to customize series properties, such as data, fill, and name, before they are rendered on the chart. The callback receives an ISeriesRenderEventArgs argument that exposes mutable series, data, and fill properties — assigning args.fill recolors the Pareto bars by default.
<ejs-chart (seriesRender)="onSeriesRender($event)"></ejs-chart>import { ChartModule, CategoryService, ParetoSeriesService, LineSeriesService, ColumnSeriesService } from '@syncfusion/ej2-angular-charts';
import { ISeriesRenderEventArgs } from '@syncfusion/ej2-charts';
import { Component, OnInit } from '@angular/core';
import { paretoData } from './datasource';
@Component({
imports: [ChartModule],
providers: [CategoryService, ParetoSeriesService, LineSeriesService, ColumnSeriesService],
standalone: true,
selector: 'app-container',
template: `<ejs-chart id="chart-container" (seriesRender)='seriesRender($event)' [primaryXAxis]='primaryXAxis' [primaryYAxis]='primaryYAxis' [title]='title'>
<e-series-collection>
<e-series [dataSource]='chartData' type='Pareto' xName='x' yName='y' name='Defect'></e-series>
</e-series-collection>
</ejs-chart>`
})
export class AppComponent implements OnInit {
public primaryXAxis?: Object;
public chartData?: Object[];
public title?: string;
public primaryYAxis?: Object;
ngOnInit(): void {
this.chartData = paretoData;
this.primaryXAxis = {
title: 'Defects',
valueType: 'Category'
};
this.primaryYAxis = {
title: 'Frequency of Occurrence',
minimum: 0,
maximum: 30
};
this.title = 'Pareto chart - Defects in Shirts';
}
public seriesRender(args: ISeriesRenderEventArgs): void {
args.fill = 'green';
}
}import { bootstrapApplication } from '@angular/platform-browser';
import { AppComponent } from './app.component';
import 'zone.js';
bootstrapApplication(AppComponent).catch((err) => console.error(err));export let paretoData: Object[] = [
{ x: 'Button Defect', y: 23 },
{ x: 'Pocket Defect', y: 16 },
{ x: 'Coller Defect', y: 10 },
{ x: 'Cuff Defect', y: 7 },
{ x: 'Sleeve Defect', y: 6 },
{ x: 'Other Defect', y: 2 }
];Point render
The pointRender event allows you to customize each data point before it is rendered on the chart. The callback receives an IPointRenderEventArgs argument that exposes the current point, series, fill, and border. On Pareto this affects the rendered bar color.
<ejs-chart (pointRender)="onPointRender($event)"></ejs-chart>import { IPointRenderEventArgs } from '@syncfusion/ej2-charts';
import { ChartModule, CategoryService, ParetoSeriesService, LineSeriesService, ColumnSeriesService } from '@syncfusion/ej2-angular-charts';
import { Component, OnInit } from '@angular/core';
import { paretoData } from './datasource';
@Component({
imports: [ChartModule],
providers: [CategoryService, ParetoSeriesService, LineSeriesService, ColumnSeriesService],
standalone: true,
selector: 'app-container',
template: `<ejs-chart id="chart-container" (pointRender)='pointRender($event)' [primaryXAxis]='primaryXAxis' [primaryYAxis]='primaryYAxis' [title]='title'>
<e-series-collection>
<e-series [dataSource]='chartData' type='Pareto' xName='x' yName='y' name='Defect' [marker]='marker'></e-series>
</e-series-collection>
</ejs-chart>`
})
export class AppComponent implements OnInit {
public primaryXAxis?: Object;
public chartData?: Object[];
public title?: string;
public primaryYAxis?: Object;
public marker?: Object;
ngOnInit(): void {
this.chartData = paretoData;
this.primaryXAxis = {
title: 'Defects',
valueType: 'Category'
};
this.marker = { visible: true, width: 10, height: 10 };
this.primaryYAxis = {
title: 'Frequency of Occurrence',
minimum: 0,
maximum: 30
};
this.title = 'Pareto chart - Defects in Shirts';
}
public pointRender(args: IPointRenderEventArgs): void {
args.fill = 'green';
}
}import { bootstrapApplication } from '@angular/platform-browser';
import { AppComponent } from './app.component';
import 'zone.js';
bootstrapApplication(AppComponent).catch((err) => console.error(err));export let paretoData: Object[] = [
{ x: 'Button Defect', y: 23 },
{ x: 'Pocket Defect', y: 16 },
{ x: 'Coller Defect', y: 10 },
{ x: 'Cuff Defect', y: 7 },
{ x: 'Sleeve Defect', y: 6 },
{ x: 'Other Defect', y: 2 }
];Troubleshooting
The following symptoms map to the most common configuration issues.
-
No chart is rendered: Confirm that
ParetoSeriesService,LineSeriesService, andColumnSeriesServiceare all registered. For category-axis data also registerCategoryService. The seriestypemust bePareto. -
Bars render but no cumulative line appears: Verify
LineSeriesServiceis inprovidersand thatparetoOptionsis not accidentally set toundefined. -
Event handlers do not fire: Confirm that
seriesRenderorpointRenderare bound on the<ejs-chart>element, not on the<e-series>, and that the handler is apublicmethod on the component.