Step Line Chart in Angular Charts
Step Line
A step line chart displays data points connected by horizontal and vertical lines, creating a staircase-like pattern.
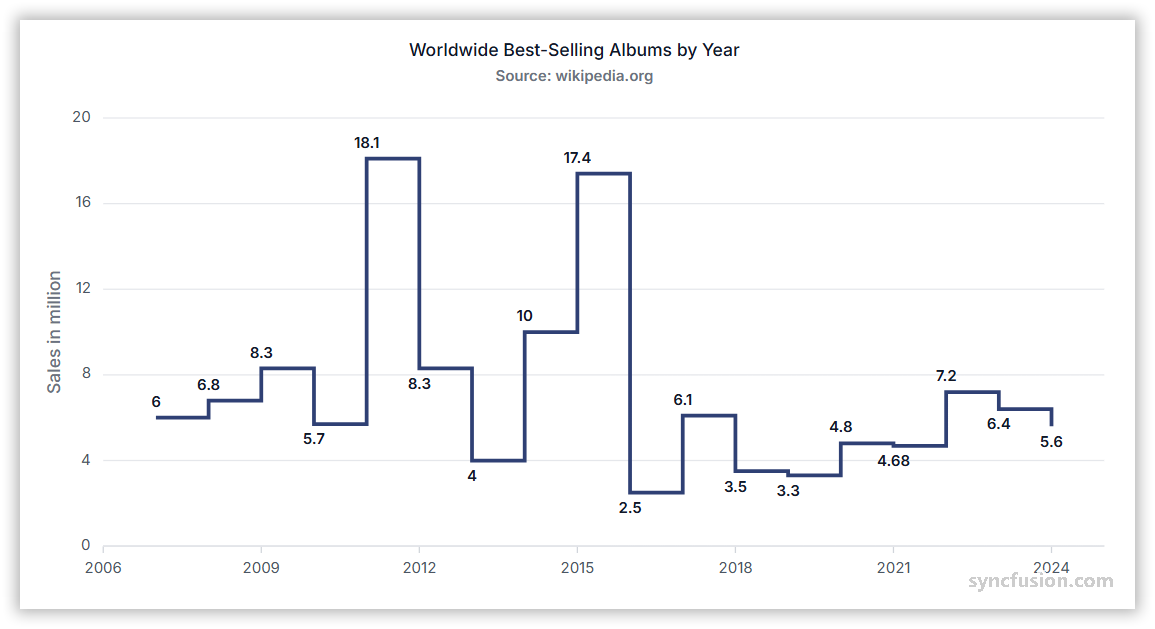
Configure a step line series as follows:
-
Set the series type: Set the series
typetoStepLine. -
Register the service: Register
StepLineSeriesService(and any required axis services) in the moduleprovidersarray, or inApplicationConfig.providersfor standalone applications. Confirm thatChartModuleis imported. -
Map the data fields: Bind the data with
dataSource, and map fields withxNameandyName.
import { ChartModule, CategoryService, StepLineSeriesService } from '@syncfusion/ej2-angular-charts';
import { Component, OnInit } from '@angular/core';
import { stepData } from './datasource';

@Component({
    imports: [ChartModule],
    providers: [CategoryService, StepLineSeriesService],
    standalone: true,
    selector: 'app-container',
    template: `<ejs-chart id="chart-container" [title]='title'>
        <e-series-collection>
            <e-series [dataSource]='chartData' type='StepLine' xName='x' yName='y'></e-series>
        </e-series-collection>
    </ejs-chart>`
})
export class AppComponent implements OnInit {
    public chartData?: Object[];
    public title?: string;

    ngOnInit(): void {
        this.chartData = stepData;
        this.title = 'Monthly Sales Comparison';
    }
}
import { bootstrapApplication } from '@angular/platform-browser';
import { AppComponent } from './app.component';
import 'zone.js';
bootstrapApplication(AppComponent).catch((err) => console.error(err));export let stepData: Object[] = [
{ x: 2005, y: 370 },
{ x: 2006, y: 378 },
{ x: 2007, y: 416 },
{ x: 2008, y: 404 },
{ x: 2009, y: 390 },
{ x: 2010, y: 376 },
{ x: 2011, y: 365 },
{ x: 2012, y: 350 }
];Series customization
Customize a step line series using the following properties.
Solid color
Use the fill property to set a single solid stroke color. Accepted values are CSS color names (for example, blue), hexadecimal strings (for example, #1A75FF), and rgba(...) strings.
import { ChartModule, StepLineSeriesService } from '@syncfusion/ej2-angular-charts';
import { Component, OnInit } from '@angular/core';
import { stepData } from './datasource';

@Component({
    imports: [ChartModule],
    providers: [StepLineSeriesService],
    standalone: true,
    selector: 'app-container',
    template: `<ejs-chart id="chart-container" [title]='title'>
        <e-series-collection>
            <e-series [dataSource]='chartData' type='StepLine' xName='x' yName='y' fill='blue'></e-series>
        </e-series-collection>
    </ejs-chart>`
})
export class AppComponent implements OnInit {
    public chartData?: Object[];
    public title?: string;

    ngOnInit(): void {
        this.chartData = stepData;
        this.title = 'CO2 - Intensity Analysis';
    }
}
import { bootstrapApplication } from '@angular/platform-browser';
import { AppComponent } from './app.component';
import 'zone.js';
bootstrapApplication(AppComponent).catch((err) => console.error(err));export let stepData: Object[] = [
{ x: 2005, y: 370 },
{ x: 2006, y: 378 },
{ x: 2007, y: 416 },
{ x: 2008, y: 404 },
{ x: 2009, y: 390 },
{ x: 2010, y: 376 },
{ x: 2011, y: 365 },
{ x: 2012, y: 350 }
];Gradient color
The fill property can also reference an SVG gradient. Define each gradient in an SVG <defs> element and assign it in the url(#gradientId) format.
import { ChartModule, StepLineSeriesService } from '@syncfusion/ej2-angular-charts';
import { Component, OnInit } from '@angular/core';
import { stepData } from './datasource';

@Component({
    imports: [ChartModule],
    providers: [StepLineSeriesService],
    standalone: true,
    selector: 'app-container',
    template: `
     <svg>
        <defs>
            <linearGradient id="gradient">
                <stop offset="0%" style="stop-color:#FF0000;stop-opacity:5" />
                <stop offset="70%" style="stop-color:#00FF00;stop-opacity:5" />
            </linearGradient>
        </defs>
    </svg>
    <ejs-chart id="chart-container" [title]='title'>
        <e-series-collection>
            <e-series [dataSource]='chartData' type='StepLine' xName='x' yName='y' name='USA' [fill]="'url(#gradient)'" ></e-series>
        </e-series-collection>
    </ejs-chart>`
})
export class AppComponent implements OnInit {
    public chartData?: Object[];
    public title?: string;
    ngOnInit(): void {
        this.chartData = stepData;
        this.title = 'CO2 - Intensity Analysis';
    }

}
import { bootstrapApplication } from '@angular/platform-browser';
import { AppComponent } from './app.component';
import 'zone.js';
bootstrapApplication(AppComponent).catch((err) => console.error(err));export let stepData: Object[] = [
{ x: 2005, y: 370 },
{ x: 2006, y: 378 },
{ x: 2007, y: 416 },
{ x: 2008, y: 404 },
{ x: 2009, y: 390 },
{ x: 2010, y: 376 },
{ x: 2011, y: 365 },
{ x: 2012, y: 350 }
];Opacity
Use the opacity property to control step line transparency. Set a value from 0 (fully transparent) to 1 (fully opaque).
import { ChartModule, StepLineSeriesService } from '@syncfusion/ej2-angular-charts';
import { Component, OnInit } from '@angular/core';
import { stepData } from './datasource';

@Component({
    imports: [ChartModule],
    providers: [StepLineSeriesService],
    standalone: true,
    selector: 'app-container',
    template: `<ejs-chart id="chart-container" [title]='title'>
        <e-series-collection>
            <e-series [dataSource]='chartData' type='StepLine' xName='x' yName='y' opacity='0.5'></e-series>
        </e-series-collection>
    </ejs-chart>`
})
export class AppComponent implements OnInit {
    public chartData?: Object[];
    public title?: string;

    ngOnInit(): void {
        this.chartData = stepData;
        this.title = 'CO2 - Intensity Analysis';
    }
}
import { bootstrapApplication } from '@angular/platform-browser';
import { AppComponent } from './app.component';
import 'zone.js';
bootstrapApplication(AppComponent).catch((err) => console.error(err));export let stepData: Object[] = [
{ x: 2005, y: 370 },
{ x: 2006, y: 378 },
{ x: 2007, y: 416 },
{ x: 2008, y: 404 },
{ x: 2009, y: 390 },
{ x: 2010, y: 376 },
{ x: 2011, y: 365 },
{ x: 2012, y: 350 }
];Dash array
Use the dashArray property to define the step line’s dash pattern. Provide a comma or whitespace-separated list of stroke-gap sizes in pixels (e.g. "5,5", "2,2,10,2", or "4 4").
import { ChartModule, StepLineSeriesService } from '@syncfusion/ej2-angular-charts';
import { Component, OnInit } from '@angular/core';
import { stepData } from './datasource';

@Component({
    imports: [ChartModule],
    providers: [StepLineSeriesService],
    standalone: true,
    selector: 'app-container',
    template: `<ejs-chart id="chart-container" [title]='title'>
        <e-series-collection>
            <e-series [dataSource]='chartData' type='StepLine' xName='x' yName='y' dashArray='2,5'></e-series>
        </e-series-collection>
    </ejs-chart>`
})
export class AppComponent implements OnInit {
    public chartData?: Object[];
    public title?: string;

    ngOnInit(): void {
        this.chartData = stepData;
        this.title = 'CO2 - Intensity Analysis';
    }
}
import { bootstrapApplication } from '@angular/platform-browser';
import { AppComponent } from './app.component';
import 'zone.js';
bootstrapApplication(AppComponent).catch((err) => console.error(err));export let stepData: Object[] = [
{ x: 2005, y: 370 },
{ x: 2006, y: 378 },
{ x: 2007, y: 416 },
{ x: 2008, y: 404 },
{ x: 2009, y: 390 },
{ x: 2010, y: 376 },
{ x: 2011, y: 365 },
{ x: 2012, y: 350 }
];Width
Use the width property to set the step line stroke width in pixels.
import { ChartModule, StepLineSeriesService } from '@syncfusion/ej2-angular-charts';
import { Component, OnInit } from '@angular/core';
import { stepData } from './datasource';

@Component({
    imports: [ChartModule],
    providers: [StepLineSeriesService],
    standalone: true,
    selector: 'app-container',
    template: `<ejs-chart id="chart-container" [title]='title'>
        <e-series-collection>
            <e-series [dataSource]='chartData' type='StepLine' xName='x' yName='y' width='2.5'></e-series>
        </e-series-collection>
    </ejs-chart>`
})
export class AppComponent implements OnInit {
    public chartData?: Object[];
    public title?: string;

    ngOnInit(): void {
        this.chartData = stepData;
        this.title = 'CO2 - Intensity Analysis';
    }
}
import { bootstrapApplication } from '@angular/platform-browser';
import { AppComponent } from './app.component';
import 'zone.js';
bootstrapApplication(AppComponent).catch((err) => console.error(err));export let stepData: Object[] = [
{ x: 2005, y: 370 },
{ x: 2006, y: 378 },
{ x: 2007, y: 416 },
{ x: 2008, y: 404 },
{ x: 2009, y: 390 },
{ x: 2010, y: 376 },
{ x: 2011, y: 365 },
{ x: 2012, y: 350 }
];Step
The step property controls where the vertical riser is positioned between two adjacent data points. Supported values are Left, Center, and Right. The default is Left.
import { ChartModule, StepLineSeriesService } from '@syncfusion/ej2-angular-charts';
import { Component, OnInit } from '@angular/core';
import { stepData } from './datasource';

@Component({
    imports: [ChartModule],
    providers: [StepLineSeriesService],
    standalone: true,
    selector: 'app-container',
    template: `<ejs-chart id="chart-container" [title]='title'>
        <e-series-collection>
            <e-series [dataSource]='chartData' type='StepLine' xName='x' yName='y' step='Left'></e-series>
        </e-series-collection>
    </ejs-chart>`
})
export class AppComponent implements OnInit {
    public chartData?: Object[];
    public title?: string;

    ngOnInit(): void {
        this.chartData = stepData;
        this.title = 'CO2 - Intensity Analysis';
    }
}
import { bootstrapApplication } from '@angular/platform-browser';
import { AppComponent } from './app.component';
import 'zone.js';
bootstrapApplication(AppComponent).catch((err) => console.error(err));export let stepData: Object[] = [
{ x: 2005, y: 370 },
{ x: 2006, y: 378 },
{ x: 2007, y: 416 },
{ x: 2008, y: 404 },
{ x: 2009, y: 390 },
{ x: 2010, y: 376 },
{ x: 2011, y: 365 },
{ x: 2012, y: 350 }
];No risers
Use the noRisers property to render the step line without the vertical lines between points. Bind it as a boolean property ([noRisers]="true").
import { ChartModule, StepLineSeriesService } from '@syncfusion/ej2-angular-charts';
import { Component, OnInit } from '@angular/core';
import { stepData } from './datasource';

@Component({
    imports: [ChartModule],
    providers: [StepLineSeriesService],
    standalone: true,
    selector: 'app-container',
    template: `<ejs-chart id="chart-container" [title]='title'>
        <e-series-collection>
            <e-series [dataSource]='chartData' type='StepLine' xName='x' yName='y' [noRisers]='true'></e-series>
        </e-series-collection>
    </ejs-chart>`
})
export class AppComponent implements OnInit {
    public chartData?: Object[];
    public title?: string;

    ngOnInit(): void {
        this.chartData = stepData;
        this.title = 'CO2 - Intensity Analysis';
    }
}
import { bootstrapApplication } from '@angular/platform-browser';
import { AppComponent } from './app.component';
import 'zone.js';
bootstrapApplication(AppComponent).catch((err) => console.error(err));export let stepData: Object[] = [
{ x: 2005, y: 370 },
{ x: 2006, y: 378 },
{ x: 2007, y: 416 },
{ x: 2008, y: 404 },
{ x: 2009, y: 390 },
{ x: 2010, y: 376 },
{ x: 2011, y: 365 },
{ x: 2012, y: 350 }
];Empty points
A data point whose mapped value is null or undefined is empty. Configure its behavior with emptyPointSettings.mode.
Mode
Use mode to control empty-point rendering. The default is Gap.
| Mode | Visual behavior |
|---|---|
Gap |
Leave a gap at the empty position and continue the staircase through the next available point. |
Zero |
Treat the empty point as 0 and connect it. |
Drop |
Drop the step segment; subsequent points are still rendered. |
Average |
Replace the empty value with the average of the surrounding points. |
import { ChartModule, StepLineSeriesService } from '@syncfusion/ej2-angular-charts';
import { Component, OnInit } from '@angular/core';
import { stepData } from './datasource';

@Component({
    imports: [ChartModule],
    providers: [StepLineSeriesService],
    standalone: true,
    selector: 'app-container',
    template: `<ejs-chart id="chart-container" [title]='title'>
        <e-series-collection>
            <e-series [dataSource]='chartData' type='StepLine' xName='x' yName='y' [emptyPointSettings]='emptyPointSettings'></e-series>
        </e-series-collection>
    </ejs-chart>`
})
export class AppComponent implements OnInit {
    public chartData?: Object[];
    public title?: string;
    public emptyPointSettings?: Object;

    ngOnInit(): void {
        this.chartData = stepData;
        this.title = 'CO2 - Intensity Analysis';
        this.emptyPointSettings = {
            mode: 'Gap'
        };
    }
}
import { bootstrapApplication } from '@angular/platform-browser';
import { AppComponent } from './app.component';
import 'zone.js';
bootstrapApplication(AppComponent).catch((err) => console.error(err));export let stepData: Object[] = [
{ x: 2005, y: 370 },
{ x: 2006, y: 378 },
{ x: 2007, y: 416 },
{ x: 2008, y: 404 },
{ x: 2009, y: undefined },
{ x: 2010, y: 376 },
{ x: 2011, y: 365 },
{ x: 2012, y: 350 }
];Empty-point fill
Use the emptyPointSettings.fill property to customize the fill color of empty points.
import { ChartModule, StepLineSeriesService } from '@syncfusion/ej2-angular-charts';
import { Component, OnInit } from '@angular/core';
import { stepData } from './datasource';

@Component({
    imports: [ChartModule],
    providers: [StepLineSeriesService],
    standalone: true,
    selector: 'app-container',
    template: `<ejs-chart id="chart-container" [title]='title'>
        <e-series-collection>
            <e-series [dataSource]='chartData' type='StepLine' xName='x' yName='y' [marker]='marker' [emptyPointSettings]='emptyPointSettings'></e-series>
        </e-series-collection>
    </ejs-chart>`
})
export class AppComponent implements OnInit {
    public chartData?: Object[];
    public title?: string;
    public emptyPointSettings?: Object;
    public marker?: Object;

    ngOnInit(): void {
        this.chartData = stepData;
        this.marker = { visible: true, width: 7, height: 7, isFilled: true };
        this.title = 'CO2 - Intensity Analysis';
        this.emptyPointSettings = {
            mode: 'Average',
            fill: '#800000'
        };
    }
}
import { bootstrapApplication } from '@angular/platform-browser';
import { AppComponent } from './app.component';
import 'zone.js';
bootstrapApplication(AppComponent).catch((err) => console.error(err));export let stepData: Object[] = [
{ x: 2005, y: 370 },
{ x: 2006, y: 378 },
{ x: 2007, y: 416 },
{ x: 2008, y: 404 },
{ x: 2009, y: undefined },
{ x: 2010, y: 376 },
{ x: 2011, y: 365 },
{ x: 2012, y: 350 },
];Empty-point border
Use the emptyPointSettings.border property to customize the width and color of a rendered empty point’s border.
import { ChartModule, StepLineSeriesService } from '@syncfusion/ej2-angular-charts';
import { Component, OnInit } from '@angular/core';
import { stepData } from './datasource';

@Component({
    imports: [ChartModule],
    providers: [StepLineSeriesService],
    standalone: true,
    selector: 'app-container',
    template: `<ejs-chart id="chart-container" [title]='title'>
        <e-series-collection>
            <e-series [dataSource]='chartData' type='StepLine' xName='x' yName='y' [marker]='marker' [emptyPointSettings]='emptyPointSettings'></e-series>
        </e-series-collection>
    </ejs-chart>`
})
export class AppComponent implements OnInit {
    public chartData?: Object[];
    public title?: string;
    public emptyPointSettings?: Object;
    public marker?: Object;

    ngOnInit(): void {
        this.chartData = stepData;
        this.marker = { visible: true, width: 7, height: 7, isFilled: true };
        this.title = 'CO2 - Intensity Analysis';
        this.emptyPointSettings = {
            mode: 'Average',
            fill: '#800000',
            border: { color: '#00FFFF', width: 2 }
        };
    }
}
import { bootstrapApplication } from '@angular/platform-browser';
import { AppComponent } from './app.component';
import 'zone.js';
bootstrapApplication(AppComponent).catch((err) => console.error(err));export let stepData: Object[] = [
{ x: 2005, y: 370 },
{ x: 2006, y: 378 },
{ x: 2007, y: 416 },
{ x: 2008, y: 404 },
{ x: 2009, y: undefined },
{ x: 2010, y: 376 },
{ x: 2011, y: 365 },
{ x: 2012, y: 350 },
];Events
Series render
The seriesRender event allows you to customize series properties, such as data, fill, and name, before they are rendered on the chart. The callback receives an ISeriesRenderEventArgs argument that exposes mutable series and data properties.
<ejs-chart (seriesRender)="onSeriesRender($event)"></ejs-chart>import { ChartModule, StepLineSeriesService } from '@syncfusion/ej2-angular-charts';
import { ISeriesRenderEventArgs } from '@syncfusion/ej2-charts';
import { Component, OnInit } from '@angular/core';
import { stepData } from './datasource';
@Component({
imports: [ChartModule],
providers: [StepLineSeriesService],
standalone: true,
selector: 'app-container',
template: `<ejs-chart id="chart-container" (seriesRender)='seriesRender($event)' [title]='title'>
<e-series-collection>
<e-series [dataSource]='chartData' type='StepLine' xName='x' yName='y' name='USA'></e-series>
</e-series-collection>
</ejs-chart>`
})
export class AppComponent implements OnInit {
public chartData?: Object[];
public title?: string;
ngOnInit(): void {
this.chartData = stepData;
this.title = 'CO2 - Intensity Analysis';
}
public seriesRender(args: ISeriesRenderEventArgs): void {
args.fill = '#ff6347';
}
}import { bootstrapApplication } from '@angular/platform-browser';
import { AppComponent } from './app.component';
import 'zone.js';
bootstrapApplication(AppComponent).catch((err) => console.error(err));export let stepData: Object[] = [
{ x: 2005, y: 370 },
{ x: 2006, y: 378 },
{ x: 2007, y: 416 },
{ x: 2008, y: 404 },
{ x: 2009, y: 390 },
{ x: 2010, y: 376 },
{ x: 2011, y: 365 },
{ x: 2012, y: 350 }
];Point render
The pointRender event allows you to customize each data point before it is rendered on the chart. The callback receives an IPointRenderEventArgs argument that exposes the current point, series, fill, and border, plus a cancel flag.
<ejs-chart (pointRender)="onPointRender($event)"></ejs-chart>import { ChartModule, StepLineSeriesService } from '@syncfusion/ej2-angular-charts';
import { IPointRenderEventArgs } from '@syncfusion/ej2-charts';
import { Component, OnInit } from '@angular/core';
import { stepData } from './datasource';
@Component({
imports: [ChartModule],
providers: [StepLineSeriesService],
standalone: true,
selector: 'app-container',
template: `<ejs-chart id="chart-container" (pointRender)='pointRender($event)' [title]='title'>
<e-series-collection>
<e-series [dataSource]='chartData' type='StepLine' xName='x' yName='y' [marker]='marker'></e-series>
</e-series-collection>
</ejs-chart>`
})
export class AppComponent implements OnInit {
public chartData?: Object[];
public title?: string;
public marker?: Object;
ngOnInit(): void {
this.chartData = stepData;
this.title = 'CO2 - Intensity Analysis';
this.marker = { visible: true };
}
public pointRender(args: IPointRenderEventArgs): void {
if (args.point.index % 2 !== 0) {
args.fill = '#ff6347';
} else {
args.fill = '#009cb8';
}
}
}import { bootstrapApplication } from '@angular/platform-browser';
import { AppComponent } from './app.component';
import 'zone.js';
bootstrapApplication(AppComponent).catch((err) => console.error(err));export let stepData: Object[] = [
{ x: 2005, y: 370 },
{ x: 2006, y: 378 },
{ x: 2007, y: 416 },
{ x: 2008, y: 404 },
{ x: 2009, y: 390 },
{ x: 2010, y: 376 },
{ x: 2011, y: 365 },
{ x: 2012, y: 350 }
];Troubleshooting
The following symptoms map to the most common configuration issues.
-
The step line is not displayed: Confirm that
StepLineSeriesServiceis registered, the seriestypeisStepLine, and thatxName/yNamemap to fields in the data source. -
An empty point is missing: Review
emptyPointSettings.modeand verify that the mapped value isnullorundefined(not0or''). -
The
widthproperty has no effect: Confirm that you are settingwidthon the<e-series>directive and not onborder.width. -
Risers remain visible despite
noRisers: Bind the property with brackets ([noRisers]="true") so Angular treats it as a boolean; the string'true'is not coerced to a boolean in Angular templates.