100% Stacked Line Chart in Angular Charts
100% Stacked Line
A 100% stacked line chart displays the relative percentage contribution of each series, with the total normalized to 100% at every point.
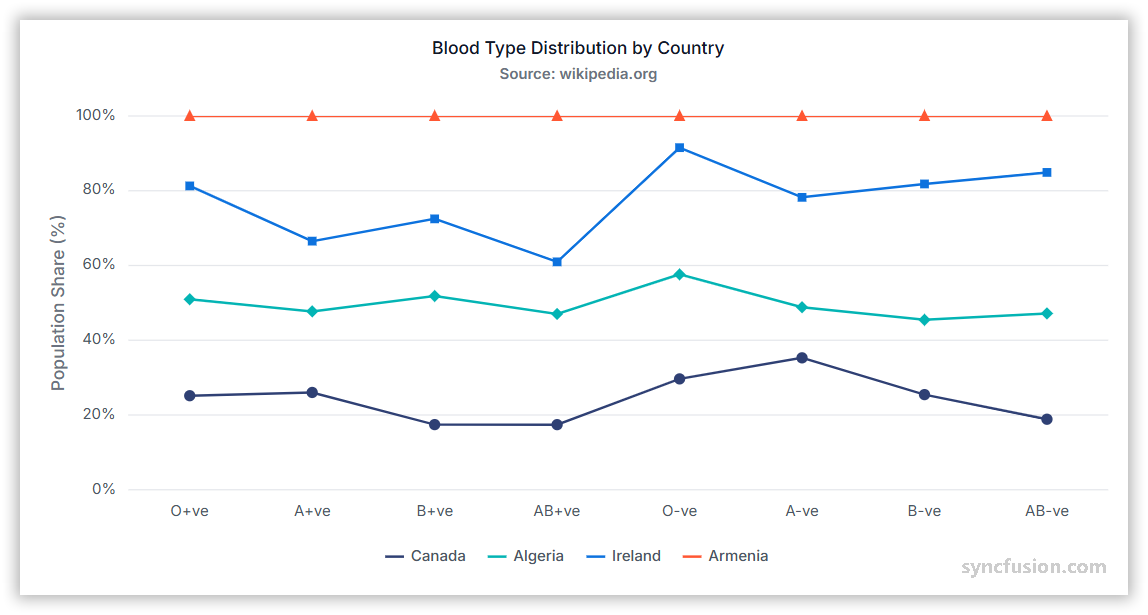
To render a 100% stacked line series in your chart, you need to follow a few steps to configure it correctly.
Here’s a concise guide on how to do this:
-
Set the series type: Set the series
typetoStackingLine100. The 100% stacked variant normalizes the stacked totals at eachxvalue so that all series always sum to 100%. -
Register the service: Register
StackingLineSeriesService(and any required axis services) in the moduleprovidersarray, or inApplicationConfig.providersfor standalone applications. Confirm thatChartModuleis imported. -
Bind the data: Add at least two
<e-series>entries that share the sametypebut use differentyNamevalues. Each wrapper series contributes one slice of the 100% total at every data point.
import { ChartModule } from '@syncfusion/ej2-angular-charts';
import { CategoryService, StackingLineSeriesService } from '@syncfusion/ej2-angular-charts';

import { Component, OnInit } from '@angular/core';
import { chartData } from './datasource';

@Component({
    imports: [
        ChartModule
    ],
    providers: [CategoryService, StackingLineSeriesService],
    standalone: true,
    selector: 'app-container',
    template: `<ejs-chart id="chart-container" [primaryXAxis]='primaryXAxis' [primaryYAxis]='primaryYAxis'>
        <e-series-collection>
            <e-series [dataSource]='chartData' type='StackingLine100' xName='x' yName='y' name='John' [marker]='marker'></e-series>
            <e-series [dataSource]='chartData' type='StackingLine100' xName='x' yName='y1' name='Peter' [marker]='marker'></e-series>
            <e-series [dataSource]='chartData' type='StackingLine100' xName='x' yName='y2' name='Steve' [marker]='marker'></e-series>
            <e-series [dataSource]='chartData' type='StackingLine100' xName='x' yName='y3' name='Charle' [marker]='marker'></e-series>
        </e-series-collection>
    </ejs-chart>`
})
export class AppComponent implements OnInit {
    public primaryXAxis?: Object;
    public primaryYAxis?: Object;
    public marker?: Object;
    public chartData?: Object[];

    ngOnInit(): void {
        this.primaryXAxis = {
            interval: 1,
            valueType: 'Category'
        };
        this.primaryYAxis = {
            title: 'Percentage',
            interval: 25,
            labelFormat: '{value}%'
        };
        this.chartData = chartData;
        this.marker = { visible: true };
    }
}
import { bootstrapApplication } from '@angular/platform-browser';
import { AppComponent } from './app.component';
import 'zone.js';
bootstrapApplication(AppComponent).catch((err) => console.error(err));export let chartData: Object[] = [
{ x: 'Food', y: 90, y1: 40, y2: 70, y3: 120 },
{ x: 'Transport', y: 80, y1: 90, y2: 110, y3: 70 },
{ x: 'Medical', y: 50, y1: 80, y2: 120, y3: 50 },
{ x: 'Clothes', y: 70, y1: 30, y2: 60, y3: 180 },
{ x: 'Personal Care', y: 30, y1: 80, y2: 80, y3: 30 },
{ x: 'Books', y: 10, y1: 40, y2: 30, y3: 270 },
{ x: 'Fitness', y: 100, y1: 30, y2: 70, y3: 40 },
{ x: 'Electricity', y: 55, y1: 95, y2: 55, y3: 75 },
{ x: 'Tax', y: 20, y1: 50, y2: 40, y3: 65 },
{ x: 'Pet Care', y: 40, y1: 20, y2: 80, y3: 95 },
{ x: 'Education', y: 45, y1: 15, y2: 45, y3: 195 },
{ x: 'Entertainment', y: 75, y1: 45, y2: 65, y3: 115 }
];Series customization
Customize a 100% stacked line series using the following properties.
Solid color
Use the fill property to set a single solid stroke color. Accepted values are CSS color names (for example, blue), hexadecimal strings (for example, #1A75FF), and rgba(...) strings. To color several series independently, set a different fill per <e-series> element.
import { ChartModule } from '@syncfusion/ej2-angular-charts';
import { CategoryService, StackingLineSeriesService } from '@syncfusion/ej2-angular-charts';

import { Component, OnInit } from '@angular/core';
import { chartData } from './datasource';

@Component({
    imports: [
        ChartModule
    ],
    providers: [CategoryService, StackingLineSeriesService],
    standalone: true,
    selector: 'app-container',
    template: `<ejs-chart id="chart-container" [primaryXAxis]='primaryXAxis' [primaryYAxis]='primaryYAxis'>
        <e-series-collection>
            <e-series [dataSource]='chartData' type='StackingLine100' xName='x' yName='y' name='John' [marker]='marker' fill='#ff4251'></e-series>
            <e-series [dataSource]='chartData' type='StackingLine100' xName='x' yName='y1' name='Peter' [marker]='marker' fill='#4C4C4C'></e-series>
            <e-series [dataSource]='chartData' type='StackingLine100' xName='x' yName='y2' name='Steve' [marker]='marker' fill='#794F1B'></e-series>
            <e-series [dataSource]='chartData' type='StackingLine100' xName='x' yName='y3' name='Charle' [marker]='marker' fill='#1a9a6f'></e-series>
        </e-series-collection>
    </ejs-chart>`
})
export class AppComponent implements OnInit {
    public primaryXAxis?: Object;
    public primaryYAxis?: Object;
    public marker?: Object;
    public chartData?: Object[];

    ngOnInit(): void {
        this.primaryXAxis = {
            interval: 1,
            valueType: 'Category'
        };
        this.primaryYAxis = {
            title: 'Percentage',
            interval: 25,
            labelFormat: '{value}%'
        };
        this.chartData = chartData;
        this.marker = { visible: true };
    }
}
import { bootstrapApplication } from '@angular/platform-browser';
import { AppComponent } from './app.component';
import 'zone.js';
bootstrapApplication(AppComponent).catch((err) => console.error(err));export let chartData: Object[] = [
{ x: 'Food', y: 90, y1: 40, y2: 70, y3: 120 },
{ x: 'Transport', y: 80, y1: 90, y2: 110, y3: 70 },
{ x: 'Medical', y: 50, y1: 80, y2: 120, y3: 50 },
{ x: 'Clothes', y: 70, y1: 30, y2: 60, y3: 180 },
{ x: 'Personal Care', y: 30, y1: 80, y2: 80, y3: 30 },
{ x: 'Books', y: 10, y1: 40, y2: 30, y3: 270 },
{ x: 'Fitness', y: 100, y1: 30, y2: 70, y3: 40 },
{ x: 'Electricity', y: 55, y1: 95, y2: 55, y3: 75 },
{ x: 'Tax', y: 20, y1: 50, y2: 40, y3: 65 },
{ x: 'Pet Care', y: 40, y1: 20, y2: 80, y3: 95 },
{ x: 'Education', y: 45, y1: 15, y2: 45, y3: 195 },
{ x: 'Entertainment', y: 75, y1: 45, y2: 65, y3: 115 }
];Gradient color
The fill property can also reference an SVG gradient. Define each gradient in an SVG <defs> element and assign it in the url(#gradientId) format.
Place the following definitions in the application’s index.html file, inside <body> and outside <app-container>.
<svg>
    <defs>
        <linearGradient id="gradient1">
            <stop offset="0%" style="stop-color:blue;stop-opacity:1" />
            <stop offset="50%" style="stop-color:violet;stop-opacity:1" />
        </linearGradient>
    </defs>
</svg>

<svg>
    <defs>
        <linearGradient id="gradient2">
            <stop offset="0%" style="stop-color:darkred;stop-opacity:1" />
            <stop offset="50%" style="stop-color:darkorange;stop-opacity:1" />
        </linearGradient>
    </defs>
</svg>

<svg>
    <defs>
        <linearGradient id="gradient3">
            <stop offset="0%" style="stop-color:darkmagenta;stop-opacity:1" />
            <stop offset="50%" style="stop-color:darkcyan;stop-opacity:1" />
        </linearGradient>
    </defs>
</svg>

<svg>
    <defs>
        <linearGradient id="gradient4">
            <stop offset="0%" style="stop-color:darkviolet;stop-opacity:1" />
            <stop offset="50%" style="stop-color:darkgoldenrod;stop-opacity:1" />
        </linearGradient>
    </defs>
</svg>
Set each series fill to url(#gradient1), url(#gradient2), … and so on.
import { ChartModule } from '@syncfusion/ej2-angular-charts';
import { CategoryService, StackingLineSeriesService } from '@syncfusion/ej2-angular-charts';

import { Component, OnInit } from '@angular/core';
import { chartData } from './datasource';

@Component({
    imports: [
        ChartModule
    ],
    providers: [CategoryService, StackingLineSeriesService],
    standalone: true,
    selector: 'app-container',
    template: `
  <ejs-chart id="chart-container" [primaryXAxis]='primaryXAxis' [primaryYAxis]='primaryYAxis'>
    <e-series-collection>
      <e-series [dataSource]='chartData' type='StackingLine100' xName='x' yName='y' name='John' [marker]='marker' [fill]="'url(#gradient1)'"></e-series>
      <e-series [dataSource]='chartData' type='StackingLine100' xName='x' yName='y1' name='Peter' [marker]='marker' [fill]="'url(#gradient2)'"></e-series>
      <e-series [dataSource]='chartData' type='StackingLine100' xName='x' yName='y2' name='Steve' [marker]='marker' [fill]="'url(#gradient3)'"></e-series>
      <e-series [dataSource]='chartData' type='StackingLine100' xName='x' yName='y3' name='Charle' [marker]='marker' [fill]="'url(#gradient4)'"></e-series>
    </e-series-collection>
  </ejs-chart>`
})
export class AppComponent implements OnInit {
    public primaryXAxis?: Object;
    public primaryYAxis?: Object;
    public marker?: Object;
    public chartData?: Object[];

    ngOnInit(): void {
        this.primaryXAxis = {
            interval: 1,
            valueType: 'Category'
        };
        this.primaryYAxis = {
            title: 'Percentage',
            interval: 25,
            labelFormat: '{value}%'
        };
        this.chartData = chartData;
        this.marker = { visible: true };
    }
}
import { bootstrapApplication } from '@angular/platform-browser';
import { AppComponent } from './app.component';
import 'zone.js';
bootstrapApplication(AppComponent).catch((err) => console.error(err));export let chartData: Object[] = [
{ x: 'Food', y: 90, y1: 40, y2: 70, y3: 120 },
{ x: 'Transport', y: 80, y1: 90, y2: 110, y3: 70 },
{ x: 'Medical', y: 50, y1: 80, y2: 120, y3: 50 },
{ x: 'Clothes', y: 70, y1: 30, y2: 60, y3: 180 },
{ x: 'Personal Care', y: 30, y1: 80, y2: 80, y3: 30 },
{ x: 'Books', y: 10, y1: 40, y2: 30, y3: 270 },
{ x: 'Fitness', y: 100, y1: 30, y2: 70, y3: 40 },
{ x: 'Electricity', y: 55, y1: 95, y2: 55, y3: 75 },
{ x: 'Tax', y: 20, y1: 50, y2: 40, y3: 65 },
{ x: 'Pet Care', y: 40, y1: 20, y2: 80, y3: 95 },
{ x: 'Education', y: 45, y1: 15, y2: 45, y3: 195 },
{ x: 'Entertainment', y: 75, y1: 45, y2: 65, y3: 115 }
];Opacity
Use the opacity property to control line transparency. Set a value from 0 to 1.
import { ChartModule } from '@syncfusion/ej2-angular-charts';
import { CategoryService, StackingLineSeriesService } from '@syncfusion/ej2-angular-charts';

import { Component, OnInit } from '@angular/core';
import { chartData } from './datasource';

@Component({
    imports: [
        ChartModule
    ],
    providers: [CategoryService, StackingLineSeriesService],
    standalone: true,
    selector: 'app-container',
    template: `<ejs-chart id="chart-container" [primaryXAxis]='primaryXAxis' [primaryYAxis]='primaryYAxis'>
        <e-series-collection>
            <e-series [dataSource]='chartData' type='StackingLine100' xName='x' yName='y' name='John' [marker]='marker' opacity='0.5'></e-series>
            <e-series [dataSource]='chartData' type='StackingLine100' xName='x' yName='y1' name='Peter' [marker]='marker' opacity='0.5'></e-series>
            <e-series [dataSource]='chartData' type='StackingLine100' xName='x' yName='y2' name='Steve' [marker]='marker' opacity='0.5'></e-series>
            <e-series [dataSource]='chartData' type='StackingLine100' xName='x' yName='y3' name='Charle' [marker]='marker' opacity='0.5'></e-series>
        </e-series-collection>
    </ejs-chart>`
})
export class AppComponent implements OnInit {
    public primaryXAxis?: Object;
    public primaryYAxis?: Object;
    public marker?: Object;
    public chartData?: Object[];

    ngOnInit(): void {
        this.primaryXAxis = {
            interval: 1,
            valueType: 'Category'
        };
        this.primaryYAxis = {
            title: 'Percentage',
            interval: 25,
            labelFormat: '{value}%'
        };
        this.chartData = chartData;
        this.marker = { visible: true };
    }
}
import { bootstrapApplication } from '@angular/platform-browser';
import { AppComponent } from './app.component';
import 'zone.js';
bootstrapApplication(AppComponent).catch((err) => console.error(err));export let chartData: Object[] = [
{ x: 'Food', y: 90, y1: 40, y2: 70, y3: 120 },
{ x: 'Transport', y: 80, y1: 90, y2: 110, y3: 70 },
{ x: 'Medical', y: 50, y1: 80, y2: 120, y3: 50 },
{ x: 'Clothes', y: 70, y1: 30, y2: 60, y3: 180 },
{ x: 'Personal Care', y: 30, y1: 80, y2: 80, y3: 30 },
{ x: 'Books', y: 10, y1: 40, y2: 30, y3: 270 },
{ x: 'Fitness', y: 100, y1: 30, y2: 70, y3: 40 },
{ x: 'Electricity', y: 55, y1: 95, y2: 55, y3: 75 },
{ x: 'Tax', y: 20, y1: 50, y2: 40, y3: 65 },
{ x: 'Pet Care', y: 40, y1: 20, y2: 80, y3: 95 },
{ x: 'Education', y: 45, y1: 15, y2: 45, y3: 195 },
{ x: 'Entertainment', y: 75, y1: 45, y2: 65, y3: 115 }
];Dash array
Use the dashArray property to define the line stroke’s dash pattern. Provide a comma or whitespace-separated list of stroke-gap sizes in pixels, for example "5,5", "2,2,10,2", or "4 4".
import { ChartModule } from '@syncfusion/ej2-angular-charts';
import { CategoryService, StackingLineSeriesService } from '@syncfusion/ej2-angular-charts';

import { Component, OnInit } from '@angular/core';
import { chartData } from './datasource';

@Component({
    imports: [
        ChartModule
    ],
    providers: [CategoryService, StackingLineSeriesService],
    standalone: true,
    selector: 'app-container',
    template: `<ejs-chart id="chart-container" [primaryXAxis]='primaryXAxis' [primaryYAxis]='primaryYAxis'>
        <e-series-collection>
            <e-series [dataSource]='chartData' type='StackingLine100' xName='x' yName='y' name='John' [marker]='marker' dashArray='2,5'></e-series>
            <e-series [dataSource]='chartData' type='StackingLine100' xName='x' yName='y1' name='Peter' [marker]='marker' dashArray='2,5'></e-series>
            <e-series [dataSource]='chartData' type='StackingLine100' xName='x' yName='y2' name='Steve' [marker]='marker' dashArray='2,5'></e-series>
            <e-series [dataSource]='chartData' type='StackingLine100' xName='x' yName='y3' name='Charle' [marker]='marker' dashArray='2,5'></e-series>
        </e-series-collection>
    </ejs-chart>`
})
export class AppComponent implements OnInit {
    public primaryXAxis?: Object;
    public primaryYAxis?: Object;
    public marker?: Object;
    public chartData?: Object[];

    ngOnInit(): void {
        this.primaryXAxis = {
            interval: 1,
            valueType: 'Category'
        };
        this.primaryYAxis = {
            title: 'Percentage',
            interval: 25,
            labelFormat: '{value}%'
        };
        this.chartData = chartData;
        this.marker = { visible: true };
    }
}
import { bootstrapApplication } from '@angular/platform-browser';
import { AppComponent } from './app.component';
import 'zone.js';
bootstrapApplication(AppComponent).catch((err) => console.error(err));export let chartData: Object[] = [
{ x: 'Food', y: 90, y1: 40, y2: 70, y3: 120 },
{ x: 'Transport', y: 80, y1: 90, y2: 110, y3: 70 },
{ x: 'Medical', y: 50, y1: 80, y2: 120, y3: 50 },
{ x: 'Clothes', y: 70, y1: 30, y2: 60, y3: 180 },
{ x: 'Personal Care', y: 30, y1: 80, y2: 80, y3: 30 },
{ x: 'Books', y: 10, y1: 40, y2: 30, y3: 270 },
{ x: 'Fitness', y: 100, y1: 30, y2: 70, y3: 40 },
{ x: 'Electricity', y: 55, y1: 95, y2: 55, y3: 75 },
{ x: 'Tax', y: 20, y1: 50, y2: 40, y3: 65 },
{ x: 'Pet Care', y: 40, y1: 20, y2: 80, y3: 95 },
{ x: 'Education', y: 45, y1: 15, y2: 45, y3: 195 },
{ x: 'Entertainment', y: 75, y1: 45, y2: 65, y3: 115 }
];Width
Use the width property to set the line stroke width in pixels.
import { ChartModule } from '@syncfusion/ej2-angular-charts';
import { CategoryService, StackingLineSeriesService } from '@syncfusion/ej2-angular-charts';

import { Component, OnInit } from '@angular/core';
import { chartData } from './datasource';

@Component({
    imports: [
        ChartModule
    ],
    providers: [CategoryService, StackingLineSeriesService],
    standalone: true,
    selector: 'app-container',
    template: `<ejs-chart id="chart-container" [primaryXAxis]='primaryXAxis' [primaryYAxis]='primaryYAxis'>
        <e-series-collection>
            <e-series [dataSource]='chartData' type='StackingLine100' xName='x' yName='y' name='John' [marker]='marker' width='5'></e-series>
            <e-series [dataSource]='chartData' type='StackingLine100' xName='x' yName='y1' name='Peter' [marker]='marker' width='5'></e-series>
            <e-series [dataSource]='chartData' type='StackingLine100' xName='x' yName='y2' name='Steve' [marker]='marker' width='5'></e-series>
            <e-series [dataSource]='chartData' type='StackingLine100' xName='x' yName='y3' name='Charle' [marker]='marker' width='5'></e-series>
        </e-series-collection>
    </ejs-chart>`
})
export class AppComponent implements OnInit {
    public primaryXAxis?: Object;
    public primaryYAxis?: Object;
    public marker?: Object;
    public chartData?: Object[];

    ngOnInit(): void {
        this.primaryXAxis = {
            interval: 1,
            valueType: 'Category'
        };
        this.primaryYAxis = {
            title: 'Percentage',
            interval: 25,
            labelFormat: '{value}%'
        };
        this.chartData = chartData;
        this.marker = { visible: true };
    }
}
import { bootstrapApplication } from '@angular/platform-browser';
import { AppComponent } from './app.component';
import 'zone.js';
bootstrapApplication(AppComponent).catch((err) => console.error(err));export let chartData: Object[] = [
{ x: 'Food', y: 90, y1: 40, y2: 70, y3: 120 },
{ x: 'Transport', y: 80, y1: 90, y2: 110, y3: 70 },
{ x: 'Medical', y: 50, y1: 80, y2: 120, y3: 50 },
{ x: 'Clothes', y: 70, y1: 30, y2: 60, y3: 180 },
{ x: 'Personal Care', y: 30, y1: 80, y2: 80, y3: 30 },
{ x: 'Books', y: 10, y1: 40, y2: 30, y3: 270 },
{ x: 'Fitness', y: 100, y1: 30, y2: 70, y3: 40 },
{ x: 'Electricity', y: 55, y1: 95, y2: 55, y3: 75 },
{ x: 'Tax', y: 20, y1: 50, y2: 40, y3: 65 },
{ x: 'Pet Care', y: 40, y1: 20, y2: 80, y3: 95 },
{ x: 'Education', y: 45, y1: 15, y2: 45, y3: 195 },
{ x: 'Entertainment', y: 75, y1: 45, y2: 65, y3: 115 }
];Empty points
A data point whose mapped value is null or undefined is empty. Configure its behavior with emptyPointSettings.mode.
Mode
Use mode to control empty-point rendering. The default is Gap.
| Mode | Visual behavior |
|---|---|
Gap |
Leave a gap at the empty position and continue the stack through the next available point. |
Zero |
Treat the empty point as 0 and connect it. |
Drop |
Drop the line segment; subsequent points are still rendered. |
Average |
Replace the empty value with the average of the surrounding points. |
import { ChartModule } from '@syncfusion/ej2-angular-charts';
import { CategoryService, StackingLineSeriesService } from '@syncfusion/ej2-angular-charts';

import { Component, OnInit } from '@angular/core';
import { chartData } from './datasource';

@Component({
    imports: [
        ChartModule
    ],
    providers: [CategoryService, StackingLineSeriesService],
    standalone: true,
    selector: 'app-container',
    template: `<ejs-chart id="chart-container" [primaryXAxis]='primaryXAxis' [primaryYAxis]='primaryYAxis'>
        <e-series-collection>
            <e-series [dataSource]='chartData' type='StackingLine100' xName='x' yName='y' name='John' [marker]='marker' [emptyPointSettings]='emptyPointSettings'></e-series>
            <e-series [dataSource]='chartData' type='StackingLine100' xName='x' yName='y1' name='Peter' [marker]='marker'></e-series>
            <e-series [dataSource]='chartData' type='StackingLine100' xName='x' yName='y2' name='Steve' [marker]='marker' [emptyPointSettings]='emptyPointSettings1'></e-series>
            <e-series [dataSource]='chartData' type='StackingLine100' xName='x' yName='y3' name='Charle' [marker]='marker'></e-series>
        </e-series-collection>
    </ejs-chart>`
})
export class AppComponent implements OnInit {
    public primaryXAxis?: Object;
    public primaryYAxis?: Object;
    public marker?: Object;
    public chartData?: Object[];
    public emptyPointSettings?: Object;
    public emptyPointSettings1?: Object;

    ngOnInit(): void {
        this.primaryXAxis = {
            interval: 1,
            valueType: 'Category'
        };
        this.primaryYAxis = {
            title: 'Percentage',
            interval: 25,
            labelFormat: '{value}%'
        };
        this.chartData = chartData;
        this.marker = { visible: true };
        this.emptyPointSettings = { mode: 'Average' };
        this.emptyPointSettings1 = { mode: 'Gap' };
    }
}
import { bootstrapApplication } from '@angular/platform-browser';
import { AppComponent } from './app.component';
import 'zone.js';
bootstrapApplication(AppComponent).catch((err) => console.error(err));export let chartData: Object[] = [
{ x: 'Food', y: 90, y1: 40, y2: 70, y3: 120 },
{ x: 'Transport', y: 80, y1: 90, y2: 110, y3: 70 },
{ x: 'Medical', y: 50, y1: 80, y2: 120, y3: 50 },
{ x: 'Clothes', y: null, y1: 30, y2: 60, y3: 180 },
{ x: 'Personal Care', y: 30, y1: 80, y2: 80, y3: 30 },
{ x: 'Books', y: 10, y1: 40, y2: 30, y3: 270 },
{ x: 'Fitness', y: 100, y1: 30, y2: 70, y3: 40 },
{ x: 'Electricity', y: 55, y1: 95, y2: undefined, y3: 75 },
{ x: 'Tax', y: 20, y1: 50, y2: 40, y3: 65 },
{ x: 'Pet Care', y: 40, y1: 20, y2: 80, y3: 95 },
{ x: 'Education', y: 45, y1: 15, y2: 45, y3: 195 },
{ x: 'Entertainment', y: 75, y1: 45, y2: 65, y3: 115 }
];Empty-point fill
Use the emptyPointSettings.fill property to customize the fill color of empty points.
import { ChartModule } from '@syncfusion/ej2-angular-charts';
import { CategoryService, StackingLineSeriesService } from '@syncfusion/ej2-angular-charts';

import { Component, OnInit } from '@angular/core';
import { chartData } from './datasource';

@Component({
    imports: [
        ChartModule
    ],
    providers: [CategoryService, StackingLineSeriesService],
    standalone: true,
    selector: 'app-container',
    template: `<ejs-chart id="chart-container" [primaryXAxis]='primaryXAxis' [primaryYAxis]='primaryYAxis'>
        <e-series-collection>
            <e-series [dataSource]='chartData' type='StackingLine100' xName='x' yName='y' name='John' [marker]='marker' [emptyPointSettings]='emptyPointSettings'></e-series>
            <e-series [dataSource]='chartData' type='StackingLine100' xName='x' yName='y1' name='Peter' [marker]='marker'></e-series>
            <e-series [dataSource]='chartData' type='StackingLine100' xName='x' yName='y2' name='Steve' [marker]='marker' [emptyPointSettings]='emptyPointSettings1'></e-series>
            <e-series [dataSource]='chartData' type='StackingLine100' xName='x' yName='y3' name='Charle' [marker]='marker'></e-series>
        </e-series-collection>
    </ejs-chart>`
})
export class AppComponent implements OnInit {
    public primaryXAxis?: Object;
    public primaryYAxis?: Object;
    public marker?: Object;
    public chartData?: Object[];
    public emptyPointSettings?: Object;
    public emptyPointSettings1?: Object;

    ngOnInit(): void {
        this.primaryXAxis = {
            interval: 1,
            valueType: 'Category'
        };
        this.primaryYAxis = {
            title: 'Percentage',
            interval: 25,
            labelFormat: '{value}%'
        };
        this.chartData = chartData;
        this.marker = { visible: true };
        this.emptyPointSettings = { mode: 'Average', fill: 'red' };
        this.emptyPointSettings1 = { mode: 'Gap' };
    }
}
import { bootstrapApplication } from '@angular/platform-browser';
import { AppComponent } from './app.component';
import 'zone.js';
bootstrapApplication(AppComponent).catch((err) => console.error(err));export let chartData: Object[] = [
{ x: 'Food', y: 90, y1: 40, y2: 70, y3: 120 },
{ x: 'Transport', y: 80, y1: 90, y2: 110, y3: 70 },
{ x: 'Medical', y: 50, y1: 80, y2: 120, y3: 50 },
{ x: 'Clothes', y: null, y1: 30, y2: 60, y3: 180 },
{ x: 'Personal Care', y: 30, y1: 80, y2: 80, y3: 30 },
{ x: 'Books', y: 10, y1: 40, y2: 30, y3: 270 },
{ x: 'Fitness', y: 100, y1: 30, y2: 70, y3: 40 },
{ x: 'Electricity', y: 55, y1: 95, y2: undefined, y3: 75 },
{ x: 'Tax', y: 20, y1: 50, y2: 40, y3: 65 },
{ x: 'Pet Care', y: 40, y1: 20, y2: 80, y3: 95 },
{ x: 'Education', y: 45, y1: 15, y2: 45, y3: 195 },
{ x: 'Entertainment', y: 75, y1: 45, y2: 65, y3: 115 }
];Empty-point border
Use the emptyPointSettings.border property to customize the width and color of a rendered empty point’s border.
import { ChartModule } from '@syncfusion/ej2-angular-charts';
import { CategoryService, StackingLineSeriesService } from '@syncfusion/ej2-angular-charts';

import { Component, OnInit } from '@angular/core';
import { chartData } from './datasource';

@Component({
    imports: [
        ChartModule
    ],
    providers: [CategoryService, StackingLineSeriesService],
    standalone: true,
    selector: 'app-container',
    template: `<ejs-chart id="chart-container" [primaryXAxis]='primaryXAxis' [primaryYAxis]='primaryYAxis'>
        <e-series-collection>
            <e-series [dataSource]='chartData' type='StackingLine100' xName='x' yName='y' name='John' [marker]='marker' [emptyPointSettings]='emptyPointSettings'></e-series>
            <e-series [dataSource]='chartData' type='StackingLine100' xName='x' yName='y1' name='Peter' [marker]='marker'></e-series>
            <e-series [dataSource]='chartData' type='StackingLine100' xName='x' yName='y2' name='Steve' [marker]='marker' [emptyPointSettings]='emptyPointSettings1'></e-series>
            <e-series [dataSource]='chartData' type='StackingLine100' xName='x' yName='y3' name='Charle' [marker]='marker'></e-series>
        </e-series-collection>
    </ejs-chart>`
})
export class AppComponent implements OnInit {
    public primaryXAxis?: Object;
    public primaryYAxis?: Object;
    public marker?: Object;
    public chartData?: Object[];
    public emptyPointSettings?: Object;
    public emptyPointSettings1?: Object;

    ngOnInit(): void {
        this.primaryXAxis = {
            interval: 1,
            valueType: 'Category'
        };
        this.primaryYAxis = {
            title: 'Percentage',
            interval: 25,
            labelFormat: '{value}%'
        };
        this.chartData = chartData;
        this.marker = { visible: true };
        this.emptyPointSettings = { mode: 'Average', fill: 'red', border: { width: 1.5, color: '#0F9D58' } };
        this.emptyPointSettings1 = { mode: 'Gap' };
    }
}
import { bootstrapApplication } from '@angular/platform-browser';
import { AppComponent } from './app.component';
import 'zone.js';
bootstrapApplication(AppComponent).catch((err) => console.error(err));export let chartData: Object[] = [
{ x: 'Food', y: 90, y1: 40, y2: 70, y3: 120 },
{ x: 'Transport', y: 80, y1: 90, y2: 110, y3: 70 },
{ x: 'Medical', y: 50, y1: 80, y2: 120, y3: 50 },
{ x: 'Clothes', y: null, y1: 30, y2: 60, y3: 180 },
{ x: 'Personal Care', y: 30, y1: 80, y2: 80, y3: 30 },
{ x: 'Books', y: 10, y1: 40, y2: 30, y3: 270 },
{ x: 'Fitness', y: 100, y1: 30, y2: 70, y3: 40 },
{ x: 'Electricity', y: 55, y1: 95, y2: undefined, y3: 75 },
{ x: 'Tax', y: 20, y1: 50, y2: 40, y3: 65 },
{ x: 'Pet Care', y: 40, y1: 20, y2: 80, y3: 95 },
{ x: 'Education', y: 45, y1: 15, y2: 45, y3: 195 },
{ x: 'Entertainment', y: 75, y1: 45, y2: 65, y3: 115 }
];Events
Series render
The seriesRender event allows you to customize series properties, such as data, fill, and name, before they are rendered on the chart. The callback receives an ISeriesRenderEventArgs argument that exposes mutable series and data properties.
<ejs-chart (seriesRender)="onSeriesRender($event)"></ejs-chart>import { ChartModule } from '@syncfusion/ej2-angular-charts';
import { CategoryService, StackingLineSeriesService } from '@syncfusion/ej2-angular-charts';
import { ISeriesRenderEventArgs } from '@syncfusion/ej2-charts';
import { Component, OnInit } from '@angular/core';
import { chartData } from './datasource';
@Component({
imports: [
ChartModule
],
providers: [CategoryService, StackingLineSeriesService],
standalone: true,
selector: 'app-container',
template: `<ejs-chart id="chart-container" (seriesRender)='seriesRender($event)' [primaryXAxis]='primaryXAxis' [primaryYAxis]='primaryYAxis'>
<e-series-collection>
<e-series [dataSource]='chartData' type='StackingLine100' xName='x' yName='y' name='John' [marker]='marker'></e-series>
<e-series [dataSource]='chartData' type='StackingLine100' xName='x' yName='y1' name='Peter' [marker]='marker'></e-series>
<e-series [dataSource]='chartData' type='StackingLine100' xName='x' yName='y2' name='Steve' [marker]='marker'></e-series>
<e-series [dataSource]='chartData' type='StackingLine100' xName='x' yName='y3' name='Charle' [marker]='marker'></e-series>
</e-series-collection>
</ejs-chart>`
})
export class AppComponent implements OnInit {
public primaryXAxis?: Object;
public primaryYAxis?: Object;
public marker?: Object;
public chartData?: Object[];
ngOnInit(): void {
this.primaryXAxis = {
interval: 1,
valueType: 'Category'
};
this.primaryYAxis = {
title: 'Percentage',
interval: 25,
labelFormat: '{value}%'
};
this.chartData = chartData;
this.marker = { visible: true };
}
public seriesRender(args: ISeriesRenderEventArgs): void {
const palette = ['#ff4251', '#4C4C4C', '#794F1B', '#1a9a6f'];
if (args.series.index >= 0 && args.series.index < palette.length) {
args.fill = palette[args.series.index];
}
}
}import { bootstrapApplication } from '@angular/platform-browser';
import { AppComponent } from './app.component';
import 'zone.js';
bootstrapApplication(AppComponent).catch((err) => console.error(err));export let chartData: Object[] = [
{ x: 'Food', y: 90, y1: 40, y2: 70, y3: 120 },
{ x: 'Transport', y: 80, y1: 90, y2: 110, y3: 70 },
{ x: 'Medical', y: 50, y1: 80, y2: 120, y3: 50 },
{ x: 'Clothes', y: 70, y1: 30, y2: 60, y3: 180 },
{ x: 'Personal Care', y: 30, y1: 80, y2: 80, y3: 30 },
{ x: 'Books', y: 10, y1: 40, y2: 30, y3: 270 },
{ x: 'Fitness', y: 100, y1: 30, y2: 70, y3: 40 },
{ x: 'Electricity', y: 55, y1: 95, y2: 55, y3: 75 },
{ x: 'Tax', y: 20, y1: 50, y2: 40, y3: 65 },
{ x: 'Pet Care', y: 40, y1: 20, y2: 80, y3: 95 },
{ x: 'Education', y: 45, y1: 15, y2: 45, y3: 195 },
{ x: 'Entertainment', y: 75, y1: 45, y2: 65, y3: 115 }
];Point render
The pointRender event allows you to customize each data point before it is rendered on the chart. The callback receives an IPointRenderEventArgs argument that exposes the current point, series, fill, and border, plus a cancel flag.
<ejs-chart (pointRender)="onPointRender($event)"></ejs-chart>import { ChartModule } from '@syncfusion/ej2-angular-charts';
import { CategoryService, StackingLineSeriesService } from '@syncfusion/ej2-angular-charts';
import { IPointRenderEventArgs } from '@syncfusion/ej2-charts';
import { Component, OnInit } from '@angular/core';
import { chartData } from './datasource';
@Component({
imports: [
ChartModule
],
providers: [CategoryService, StackingLineSeriesService],
standalone: true,
selector: 'app-container',
template: `<ejs-chart id="chart-container" (pointRender)='pointRender($event)' [primaryXAxis]='primaryXAxis' [primaryYAxis]='primaryYAxis'>
<e-series-collection>
<e-series [dataSource]='chartData' type='StackingLine100' xName='x' yName='y' name='John' [marker]='marker'></e-series>
<e-series [dataSource]='chartData' type='StackingLine100' xName='x' yName='y1' name='Peter' [marker]='marker'></e-series>
<e-series [dataSource]='chartData' type='StackingLine100' xName='x' yName='y2' name='Steve' [marker]='marker'></e-series>
<e-series [dataSource]='chartData' type='StackingLine100' xName='x' yName='y3' name='Charle' [marker]='marker'></e-series>
</e-series-collection>
</ejs-chart>`
})
export class AppComponent implements OnInit {
public primaryXAxis?: Object;
public primaryYAxis?: Object;
public marker?: Object;
public chartData?: Object[];
ngOnInit(): void {
this.primaryXAxis = {
interval: 1,
valueType: 'Category'
};
this.primaryYAxis = {
title: 'Percentage',
interval: 25,
labelFormat: '{value}%'
};
this.chartData = chartData;
this.marker = { visible: true };
}
public pointRender(args: IPointRenderEventArgs): void {
if (args.point.y !== undefined && args.point.y < 70) {
args.fill = '#ff6347';
} else {
args.fill = '#009cb8';
}
}
}import { bootstrapApplication } from '@angular/platform-browser';
import { AppComponent } from './app.component';
import 'zone.js';
bootstrapApplication(AppComponent).catch((err) => console.error(err));export let chartData: Object[] = [
{ x: 'Food', y: 90, y1: 40, y2: 70, y3: 120 },
{ x: 'Transport', y: 80, y1: 90, y2: 110, y3: 70 },
{ x: 'Medical', y: 50, y1: 80, y2: 120, y3: 50 },
{ x: 'Clothes', y: 70, y1: 30, y2: 60, y3: 180 },
{ x: 'Personal Care', y: 30, y1: 80, y2: 80, y3: 30 },
{ x: 'Books', y: 10, y1: 40, y2: 30, y3: 270 },
{ x: 'Fitness', y: 100, y1: 30, y2: 70, y3: 40 },
{ x: 'Electricity', y: 55, y1: 95, y2: 55, y3: 75 },
{ x: 'Tax', y: 20, y1: 50, y2: 40, y3: 65 },
{ x: 'Pet Care', y: 40, y1: 20, y2: 80, y3: 95 },
{ x: 'Education', y: 45, y1: 15, y2: 45, y3: 195 },
{ x: 'Entertainment', y: 75, y1: 45, y2: 65, y3: 115 }
];Troubleshooting
-
All stacks collapse to a single value: Verify each
<e-series>references a differentyName. If every series uses the same field, the stack will sum to that one value rather than accumulate across series. -
The 100% normalization is missing: Confirm that the series
typeis exactlyStackingLine100(notStackingLine). -
An empty point is missing: Review
emptyPointSettings.modeand verify that the mapped value isnullorundefined(not0or''). -
The
widthproperty has no effect: Confirm that you are settingwidthon the<e-series>directive and not onborder.width.