Histogram Chart in Angular Charts
Histogram
A histogram displays the distribution of numeric data by grouping values into bins and showing their frequencies as vertical bars. The Histogram series automatically calculates bin counts and can optionally overlay a normal-distribution curve for statistical analysis.
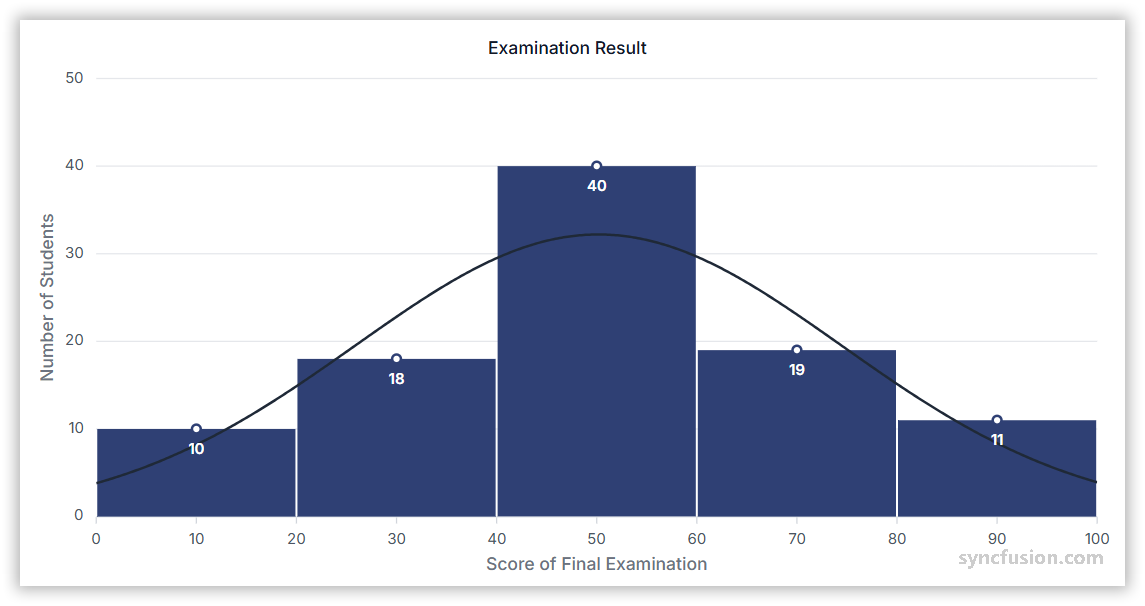
To render a histogram series in your chart, follow these steps to configure it correctly:
-
Set the series type: Define the series
typeasHistogram. Histogram is ideal for visualizing large datasets that are difficult to read in tabular form. -
Provide HistogramSeriesService: Inject the
HistogramSeriesServiceinto the componentprovidersarray. This is required for rendering Histogram series. -
Bind numeric data: A Histogram series requires a single numeric field on each data point. Map the field to the series
yNameproperty.
import { ChartModule, HistogramSeriesService } from '@syncfusion/ej2-angular-charts';
import { points } from './datasource';
import { Component, OnInit } from '@angular/core';

@Component({
    imports: [ChartModule],
    providers: [HistogramSeriesService],
    standalone: true,
    selector: 'app-container',
    template: `<ejs-chart id="chart-container" align='center' [primaryXAxis]='primaryXAxis' [primaryYAxis]='primaryYAxis'>
        <e-series-collection>
            <e-series [dataSource]='data' type='Histogram' yName='y' name='Score' [width]='2' [binInterval]='binInterval' [showNormalDistribution]='showNormalDistribution' [columnWidth]='columnWidth'></e-series>
        </e-series-collection>
    </ejs-chart>`
})
export class AppComponent implements OnInit {
    public primaryXAxis: Object = {
        minimum: 0,
        maximum: 100
    };
    public primaryYAxis: Object = {
        minimum: 0,
        maximum: 50,
        interval: 10
    };
    public data: Object[] = points.map((value: number) => ({ y: value }));
    public binInterval: number = 20;
    public columnWidth: number = 0.99;
    public showNormalDistribution: boolean = true;

    ngOnInit(): void {
    }
}
import { bootstrapApplication } from '@angular/platform-browser';
import { AppComponent } from './app.component';
import 'zone.js';
bootstrapApplication(AppComponent).catch((err) => console.error(err));export let points: number[] = [5.250, 7.750, 0, 8.275, 9.750, 7.750, 8.275, 6.250, 5.750,
5.250, 23.000, 26.500, 27.750, 25.025, 26.500, 26.500, 28.025, 29.250, 26.750, 27.250,
26.250, 25.250, 34.500, 25.625, 25.500, 26.625, 36.275, 36.250, 26.875, 40.000, 43.000,
46.500, 47.750, 45.025, 56.500, 56.500, 58.025, 59.250, 56.750, 57.250,
46.250, 55.250, 44.500, 45.525, 55.500, 46.625, 46.275, 56.250, 46.875, 43.000,
46.250, 55.250, 44.500, 45.425, 55.500, 56.625, 46.275, 56.250, 46.875, 43.000,
46.250, 55.250, 44.500, 45.425, 55.500, 46.625, 56.275, 46.250, 56.875, 41.000, 63.000,
66.500, 67.750, 65.025, 66.500, 76.500, 78.025, 79.250, 76.750, 77.250,
66.250, 75.250, 74.500, 65.625, 75.500, 76.625, 76.275, 66.250, 66.875, 80.000, 85.250,
87.750, 89.000, 88.275, 89.750, 97.750, 98.275, 96.250, 95.750, 95.250
];Events
Series render
The seriesRender event allows you to customize series properties, such as data, fill, and name, before they are rendered on the chart. The callback receives an ISeriesRenderEventArgs argument that exposes mutable series and data properties.
<ejs-chart (seriesRender)="onSeriesRender($event)"></ejs-chart>import { ChartModule, HistogramSeriesService } from '@syncfusion/ej2-angular-charts';
import { ISeriesRenderEventArgs } from '@syncfusion/ej2-charts';
import { points } from './datasource';
import { Component, OnInit } from '@angular/core';
@Component({
imports: [ChartModule],
providers: [HistogramSeriesService],
standalone: true,
selector: 'app-container',
template: `<ejs-chart id="chart-container" align='center' [primaryXAxis]='primaryXAxis' [primaryYAxis]='primaryYAxis' (seriesRender)='seriesRender($event)'>
<e-series-collection>
<e-series [dataSource]='data' type='Histogram' yName='y' name='Score' [width]='2' [binInterval]='binInterval' [showNormalDistribution]='showNormalDistribution' [columnWidth]='columnWidth'></e-series>
</e-series-collection>
</ejs-chart>`
})
export class AppComponent implements OnInit {
public primaryXAxis: Object = {
minimum: 0,
maximum: 100
};
public primaryYAxis: Object = {
minimum: 0,
maximum: 50,
interval: 10
};
public data: Object[] = points.map((value: number) => ({ y: value }));
public binInterval: number = 20;
public columnWidth: number = 0.99;
public showNormalDistribution: boolean = true;
ngOnInit(): void {
}
public seriesRender(args: ISeriesRenderEventArgs): void {
args.fill = '#ff6347';
}
}import { bootstrapApplication } from '@angular/platform-browser';
import { AppComponent } from './app.component';
import 'zone.js';
bootstrapApplication(AppComponent).catch((err) => console.error(err));export let points: number[] = [5.250, 7.750, 0, 8.275, 9.750, 7.750, 8.275, 6.250, 5.750,
5.250, 23.000, 26.500, 27.750, 25.025, 26.500, 26.500, 28.025, 29.250, 26.750, 27.250,
26.250, 25.250, 34.500, 25.625, 25.500, 26.625, 36.275, 36.250, 26.875, 40.000, 43.000,
46.500, 47.750, 45.025, 56.500, 56.500, 58.025, 59.250, 56.750, 57.250,
46.250, 55.250, 44.500, 45.525, 55.500, 46.625, 46.275, 56.250, 46.875, 43.000,
46.250, 55.250, 44.500, 45.425, 55.500, 56.625, 46.275, 56.250, 46.875, 43.000,
46.250, 55.250, 44.500, 45.425, 55.500, 46.625, 56.275, 46.250, 56.875, 41.000, 63.000,
66.500, 67.750, 65.025, 66.500, 76.500, 78.025, 79.250, 76.750, 77.250,
66.250, 75.250, 74.500, 65.625, 75.500, 76.625, 76.275, 66.250, 66.875, 80.000, 85.250,
87.750, 89.000, 88.275, 89.750, 97.750, 98.275, 96.250, 95.750, 95.250
];Point render
The pointRender event allows you to customize each data point before it is rendered on the chart. The callback receives an IPointRenderEventArgs argument that exposes the current point, series, fill, and border, plus a cancel flag.
<ejs-chart (pointRender)="onPointRender($event)"></ejs-chart>import { ChartModule, HistogramSeriesService } from '@syncfusion/ej2-angular-charts';
import { IPointRenderEventArgs } from '@syncfusion/ej2-charts';
import { points } from './datasource';
import { Component, OnInit } from '@angular/core';
@Component({
imports: [ChartModule],
providers: [HistogramSeriesService],
standalone: true,
selector: 'app-container',
template: `<ejs-chart id="chart-container" align='center' [primaryXAxis]='primaryXAxis' [primaryYAxis]='primaryYAxis' (pointRender)='pointRender($event)'>
<e-series-collection>
<e-series [dataSource]='data' type='Histogram' yName='y' name='Score' [width]='2' [binInterval]='binInterval' [showNormalDistribution]='showNormalDistribution' [columnWidth]='columnWidth'></e-series>
</e-series-collection>
</ejs-chart>`
})
export class AppComponent implements OnInit {
public primaryXAxis: Object = {
minimum: 0,
maximum: 100
};
public primaryYAxis: Object = {
minimum: 0,
maximum: 50,
interval: 10
};
public data: Object[] = points.map((value: number) => ({ y: value }));
public binInterval: number = 20;
public columnWidth: number = 0.99;
public showNormalDistribution: boolean = true;
ngOnInit(): void {
}
public pointRender(args: IPointRenderEventArgs): void {
args.fill = '#009cb8';
}
}import { bootstrapApplication } from '@angular/platform-browser';
import { AppComponent } from './app.component';
import 'zone.js';
bootstrapApplication(AppComponent).catch((err) => console.error(err));export let points: number[] = [5.250, 7.750, 0, 8.275, 9.750, 7.750, 8.275, 6.250, 5.750,
5.250, 23.000, 26.500, 27.750, 25.025, 26.500, 26.500, 28.025, 29.250, 26.750, 27.250,
26.250, 25.250, 34.500, 25.625, 25.500, 26.625, 36.275, 36.250, 26.875, 40.000, 43.000,
46.500, 47.750, 45.025, 56.500, 56.500, 58.025, 59.250, 56.750, 57.250,
46.250, 55.250, 44.500, 45.525, 55.500, 46.625, 46.275, 56.250, 46.875, 43.000,
46.250, 55.250, 44.500, 45.425, 55.500, 56.625, 46.275, 56.250, 46.875, 43.000,
46.250, 55.250, 44.500, 45.425, 55.500, 46.625, 56.275, 46.250, 56.875, 41.000, 63.000,
66.500, 67.750, 65.025, 66.500, 76.500, 78.025, 79.250, 76.750, 77.250,
66.250, 75.250, 74.500, 65.625, 75.500, 76.625, 76.275, 66.250, 66.875, 80.000, 85.250,
87.750, 89.000, 88.275, 89.750, 97.750, 98.275, 96.250, 95.750, 95.250
];Troubleshooting
The following symptoms map to the most common configuration issues.
-
No series is rendered: Verify that
HistogramSeriesServiceis registered, the seriestypeisHistogram, and thatyNamemaps to a numeric field on each data point. -
Event handlers do not fire: Confirm that
seriesRenderorpointRenderare bound on the<ejs-chart>element, not on the<e-series>, and that the handler is apublicmethod on the component.