Error Bar Chart in Angular Charts
Error Bar
Error bars are graphical representations of the variability of data and are used on graphs to indicate the error or uncertainty in a reported measurement.
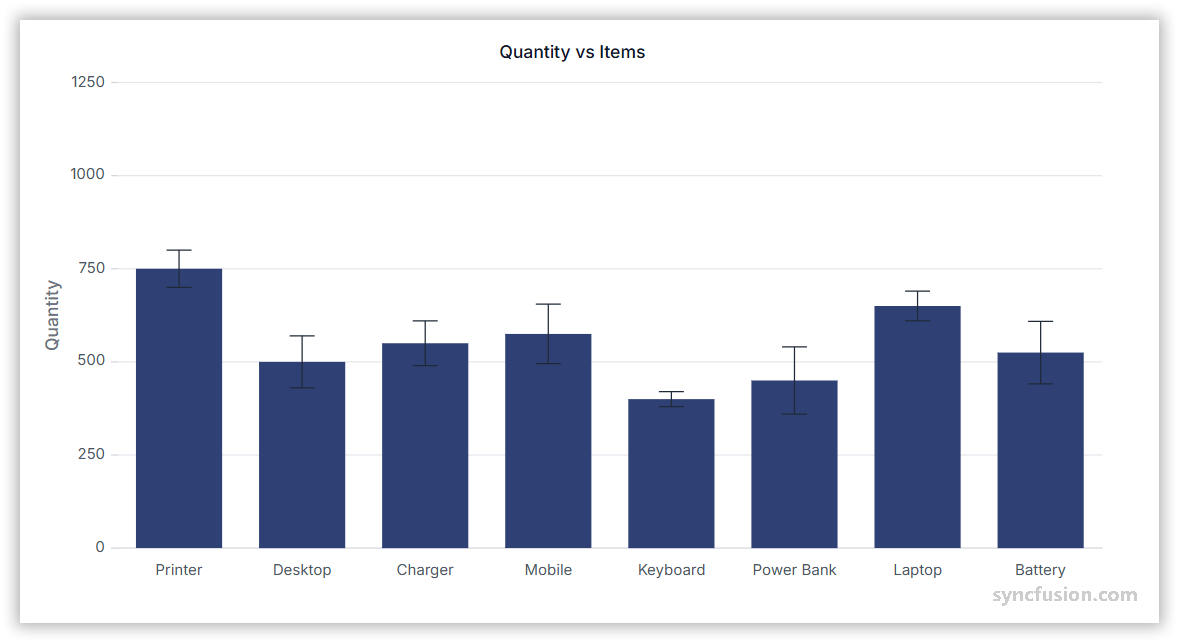
Configure an error bar on a series as follows:
-
Set the series type: Use any series that supports error bars (for example,
Line). -
Enable error bars: Set
errorBarSettings.visibletotrueon the<e-series>directive. -
Register the service: Register
ErrorBarService(and the matching series / axis services) in the moduleprovidersarray, or inApplicationConfig.providersfor standalone applications. Confirm thatChartModuleis imported.
import { ChartModule, LineSeriesService, ErrorBarService } from '@syncfusion/ej2-angular-charts';
import { Component, OnInit } from '@angular/core';

@Component({
    imports: [ChartModule],
    providers: [LineSeriesService, ErrorBarService],
    standalone: true,
    selector: 'app-container',
    template: `<ejs-chart id="chart-container" [primaryXAxis]='primaryXAxis' [title]='title'>
        <e-series-collection>
            <e-series [dataSource]='chartData' type='Line' xName='x' yName='y' name='India' width='2' [marker]='marker' [errorBar]='errorBar'></e-series>
        </e-series-collection>
    </ejs-chart>`
})
export class AppComponent implements OnInit {
    public primaryXAxis?: Object;
    public chartData?: Object[];
    public title?: string;
    public marker?: Object;
    public errorBar?: Object;

    ngOnInit(): void {
        this.chartData = [
            { x: 2006, y: 7.8 }, { x: 2007, y: 7.2 },
            { x: 2008, y: 6.8 }, { x: 2009, y: 10.7 },
            { x: 2010, y: 10.8 }, { x: 2011, y: 9.8 }
        ];
        this.primaryXAxis = {
            title: 'Year',
            minimum: 2005,
            maximum: 2012,
            interval: 1
        };
        this.marker = { visible: true };
        this.errorBar = { visible: true };
        this.title = 'Unemployment rate (%)';
    }
}
import { bootstrapApplication } from '@angular/platform-browser';
import { AppComponent } from './app.component';
import 'zone.js';
bootstrapApplication(AppComponent).catch((err) => console.error(err));Error bar type
Use errorBarSettings.type to set the error bar variant. Combine with errorBarSettings.verticalError (or the per-direction verticalNegativeError / verticalPositiveError) to control magnitude.
| Type | Use it to |
|---|---|
Fixed |
Apply a constant magnitude from verticalError to every point. |
Percentage |
Apply a magnitude that is a percentage of the y-value. |
StandardDeviation |
Apply a magnitude derived from the data’s standard deviation. |
StandardError |
Renders a standard error type error bar. |
Custom |
Provide per-point positive and negative errors via the data source. |
import { ChartModule, LineSeriesService, ErrorBarService } from '@syncfusion/ej2-angular-charts';
import { Component, OnInit } from '@angular/core';
import { errorData } from './datasource';

@Component({
    imports: [ChartModule],
    providers: [LineSeriesService, ErrorBarService],
    standalone: true,
    selector: 'app-container',
    template: `<ejs-chart id="chart-container" [title]='title'>
        <e-series-collection>
            <e-series [dataSource]='chartData' type='Line' xName='x' yName='y' name='India' width='2' [marker]='marker' [errorBar]='errorBar'></e-series>
        </e-series-collection>
    </ejs-chart>`
})
export class AppComponent implements OnInit {
    public chartData?: Object[];
    public title?: string;
    public marker?: Object;
    public errorBar?: Object;

    ngOnInit(): void {
        this.chartData = errorData;
        this.marker = { visible: true };
        this.errorBar = { visible: true, type: 'Percentage', verticalError: 4 };
        this.title = 'Unemployment rate (%)';
    }
}
import { bootstrapApplication } from '@angular/platform-browser';
import { AppComponent } from './app.component';
import 'zone.js';
bootstrapApplication(AppComponent).catch((err) => console.error(err));Customizing error bar type
To provide per-point errors, set errorBarSettings.type to Custom and map fields on the data source to verticalNegativeError, verticalPositiveError, horizontalNegativeError, and horizontalPositiveError.
import { ChartModule, LineSeriesService, ErrorBarService } from '@syncfusion/ej2-angular-charts';
import { Component, OnInit } from '@angular/core';
import { errorData } from './datasource';

@Component({
    imports: [ChartModule],
    providers: [LineSeriesService, ErrorBarService],
    standalone: true,
    selector: 'app-container',
    template: `<ejs-chart id="chart-container" [title]='title'>
        <e-series-collection>
            <e-series [dataSource]='chartData' type='Line' xName='x' yName='y' name='India' width='2' [marker]='marker' [errorBar]='errorBar'></e-series>
        </e-series-collection>
    </ejs-chart>`
})
export class AppComponent implements OnInit {
    public chartData?: Object[];
    public title?: string;
    public marker?: Object;
    public errorBar?: Object;

    ngOnInit(): void {
        this.chartData = errorData;
        this.marker = { visible: true };
        this.errorBar = {
            visible: true,
            type: 'Custom',
            mode: 'Both',
            verticalPositiveError: 3,
            horizontalPositiveError: 2,
            verticalNegativeError: 3,
            horizontalNegativeError: 2
        };
        this.title = 'Unemployment rate (%)';
    }
}
import { bootstrapApplication } from '@angular/platform-browser';
import { AppComponent } from './app.component';
import 'zone.js';
bootstrapApplication(AppComponent).catch((err) => console.error(err));export let errorData: Object[] = [
{ x: 2006, y: 7.8 }, { x: 2007, y: 7.2 },
{ x: 2008, y: 6.8 }, { x: 2009, y: 5.7 },
{ x: 2010, y: 10.8 }, { x: 2011, y: 9.8 }
];Error bar mode
Use errorBarSettings.mode to choose how the error bar is drawn.
| Mode | Visual behavior |
|---|---|
Vertical |
Draw a vertical line only. |
Horizontal |
Draw a horizontal line only. |
Both |
Draw vertical and horizontal lines. |
import { ChartModule, LineSeriesService, ErrorBarService } from '@syncfusion/ej2-angular-charts';
import { Component, OnInit } from '@angular/core';
import { errorData } from './datasource';

@Component({
    imports: [ChartModule],
    providers: [LineSeriesService, ErrorBarService],
    standalone: true,
    selector: 'app-container',
    template: `<ejs-chart id="chart-container" [title]='title'>
        <e-series-collection>
            <e-series [dataSource]='chartData' type='Line' xName='x' yName='y' name='India' width='2' [marker]='marker' [errorBar]='errorBar'></e-series>
        </e-series-collection>
    </ejs-chart>`
})
export class AppComponent implements OnInit {
    public chartData?: Object[];
    public title?: string;
    public marker?: Object;
    public errorBar?: Object;

    ngOnInit(): void {
        this.chartData = errorData;
        this.marker = { visible: true };
        this.errorBar = { visible: true, mode: 'Horizontal' };
        this.title = 'Unemployment rate (%)';
    }
}
import { bootstrapApplication } from '@angular/platform-browser';
import { AppComponent } from './app.component';
import 'zone.js';
bootstrapApplication(AppComponent).catch((err) => console.error(err));export let errorData: Object[] = [
{ x: 2006, y: 7.8 }, { x: 2007, y: 7.2 },
{ x: 2008, y: 6.8 }, { x: 2009, y: 5.7 },
{ x: 2010, y: 10.8 }, { x: 2011, y: 9.8 }
];Error bar direction
Use errorBarSettings.direction to choose which side of the point receives the error bar.
| Direction | Visual behavior |
|---|---|
Both |
Draw error bars on both sides of the point. |
Minus |
Draw the error bar on the minus side only. |
Plus |
Draw the error bar on the plus side only. |
import { ChartModule, LineSeriesService, ErrorBarService } from '@syncfusion/ej2-angular-charts';
import { Component, OnInit } from '@angular/core';
import { errorData } from './datasource';

@Component({
    imports: [ChartModule],
    providers: [LineSeriesService, ErrorBarService],
    standalone: true,
    selector: 'app-container',
    template: `<ejs-chart id="chart-container" [title]='title'>
        <e-series-collection>
            <e-series [dataSource]='chartData' type='Line' xName='x' yName='y' name='India' width='2' [marker]='marker' [errorBar]='errorBar'></e-series>
        </e-series-collection>
    </ejs-chart>`
})
export class AppComponent implements OnInit {
    public chartData?: Object[];
    public title?: string;
    public marker?: Object;
    public errorBar?: Object;

    ngOnInit(): void {
        this.chartData = errorData;
        this.marker = { visible: true };
        this.errorBar = { visible: true, mode: 'Vertical', direction: 'Minus' };
        this.title = 'Unemployment rate (%)';
    }
}
import { bootstrapApplication } from '@angular/platform-browser';
import { AppComponent } from './app.component';
import 'zone.js';
bootstrapApplication(AppComponent).catch((err) => console.error(err));export let errorData: Object[] = [
{ x: 2006, y: 7.8 }, { x: 2007, y: 7.2 },
{ x: 2008, y: 6.8 }, { x: 2009, y: 5.7 },
{ x: 2010, y: 10.8 }, { x: 2011, y: 9.8 }
];Customizing error bar cap
Use errorBarSettings.errorBarCap to customize the end caps of an error bar.
| Property | Type | Use it to |
|---|---|---|
length |
number |
Cap length in pixels. |
width |
number |
Cap width in pixels. |
color |
string |
Cap fill color. |
opacity |
number |
Cap opacity (0 to 1). |
import { ChartModule, LineSeriesService, ErrorBarService } from '@syncfusion/ej2-angular-charts';
import { Component, OnInit } from '@angular/core';
import { errorData } from './datasource';

@Component({
    imports: [ChartModule],
    providers: [LineSeriesService, ErrorBarService],
    standalone: true,
    selector: 'app-container',
    template: `<ejs-chart id="chart-container" [primaryXAxis]='primaryXAxis' [title]='title'>
        <e-series-collection>
            <e-series [dataSource]='chartData' type='Line' xName='x' yName='y' name='India' width='2' [marker]='marker' [errorBar]='errorBar'></e-series>
        </e-series-collection>
    </ejs-chart>`
})
export class AppComponent implements OnInit {
    public primaryXAxis?: Object;
    public chartData?: Object[];
    public title?: string;
    public marker?: Object;
    public errorBar?: Object;

    ngOnInit(): void {
        this.chartData = errorData;
        this.primaryXAxis = {
            title: 'Year',
            minimum: 2005,
            maximum: 2012,
            interval: 1
        };
        this.marker = { visible: true };
        this.errorBar = {
            visible: true,
            errorBarCap: { length: 10, width: 10, color: '#0000ff' }
        };
        this.title = 'Unemployment rate (%)';
    }
}
import { bootstrapApplication } from '@angular/platform-browser';
import { AppComponent } from './app.component';
import 'zone.js';
bootstrapApplication(AppComponent).catch((err) => console.error(err));export let errorData: Object[] = [
{ x: 2006, y: 7.8 }, { x: 2007, y: 7.2 },
{ x: 2008, y: 6.8 }, { x: 2009, y: 5.7 },
{ x: 2010, y: 10.8 }, { x: 2011, y: 9.8 }
];Customizing error bar color
Use the errorBarColorMapping property to map data values to error-bar colors. The per-point error fields listed below accept numeric values that override verticalError and horizontalError for each point.
| Property | Use it to |
|---|---|
verticalError |
Default vertical error magnitude. |
horizontalError |
Default horizontal error magnitude. |
verticalNegativeError |
Vertical error on the minus side. |
verticalPositiveError |
Vertical error on the plus side. |
horizontalNegativeError |
Horizontal error on the minus side. |
horizontalPositiveError |
Horizontal error on the plus side. |
import { ChartModule, LineSeriesService, ErrorBarService } from '@syncfusion/ej2-angular-charts';
import { Component, OnInit } from '@angular/core';
import { errorData } from './datasource';

@Component({
    imports: [ChartModule],
    providers: [LineSeriesService, ErrorBarService],
    standalone: true,
    selector: 'app-container',
    template: `<ejs-chart id="chart-container" [primaryXAxis]='primaryXAxis' [title]='title'>
        <e-series-collection>
            <e-series [dataSource]='chartData' type='Line' xName='x' yName='y' name='India' width='2' [marker]='marker' [errorBar]='errorBar'></e-series>
        </e-series-collection>
    </ejs-chart>`
})
export class AppComponent implements OnInit {
    public primaryXAxis?: Object;
    public chartData: Object[] = errorData;
    public title?: string;
    public marker?: Object;
    public errorBar?: Object;

    ngOnInit(): void {
        this.primaryXAxis = {
            title: 'Year',
            minimum: 2005,
            maximum: 2012,
            interval: 1
        };
        this.marker = { visible: true };
        this.errorBar = { visible: true, errorBarColorMapping: 'color', verticalError: 'error' };
        this.title = 'Unemployment rate (%)';
    }
}
import { bootstrapApplication } from '@angular/platform-browser';
import { AppComponent } from './app.component';
import 'zone.js';
bootstrapApplication(AppComponent).catch((err) => console.error(err));export let errorData: Object[] = [
{ x: 2006, y: 7.8, color: 'red', error: 1.5 },
{ x: 2007, y: 7.2, color: 'green', error: 2.5 },
{ x: 2008, y: 6.8, color: 'blue', error: 3.5 },
{ x: 2009, y: 5.7, color: 'yellow', error: 1.5 },
{ x: 2010, y: 10.8, color: 'grey', error: 0.5 },
{ x: 2011, y: 9.8, color: 'brown', error: 1 },
];Events
Series render
The seriesRender event allows you to customize series properties, such as data, fill, and name, before they are rendered on the chart. The callback receives an ISeriesRenderEventArgs argument that exposes mutable series and data properties.
<ejs-chart (seriesRender)="onSeriesRender($event)"></ejs-chart>import { ChartModule, LineSeriesService, ErrorBarService } from '@syncfusion/ej2-angular-charts';
import { ISeriesRenderEventArgs } from '@syncfusion/ej2-charts';
import { Component, OnInit } from '@angular/core';
@Component({
imports: [ChartModule],
providers: [LineSeriesService, ErrorBarService],
standalone: true,
selector: 'app-container',
template: `<ejs-chart id="chart-container" (seriesRender)='seriesRender($event)' [primaryXAxis]='primaryXAxis' [title]='title'>
<e-series-collection>
<e-series [dataSource]='chartData' type='Line' xName='x' yName='y' name='India' width='2' [marker]='marker' [errorBar]='errorBar'></e-series>
</e-series-collection>
</ejs-chart>`
})
export class AppComponent implements OnInit {
public primaryXAxis?: Object;
public chartData?: Object[];
public title?: string;
public marker?: Object;
public errorBar?: Object;
ngOnInit(): void {
this.chartData = [
{ x: 2006, y: 7.8 }, { x: 2007, y: 7.2 },
{ x: 2008, y: 6.8 }, { x: 2009, y: 10.7 },
{ x: 2010, y: 10.8 }, { x: 2011, y: 9.8 }
];
this.primaryXAxis = {
title: 'Year',
minimum: 2005,
maximum: 2012,
interval: 1
};
this.marker = { visible: true };
this.errorBar = { visible: true };
this.title = 'Unemployment rate (%)';
}
public seriesRender(args: ISeriesRenderEventArgs): void {
args.fill = '#ff6347';
}
}import { bootstrapApplication } from '@angular/platform-browser';
import { AppComponent } from './app.component';
import 'zone.js';
bootstrapApplication(AppComponent).catch((err) => console.error(err));export let errorData: Object[] = [
{ x: 2006, y: 7.8 }, { x: 2007, y: 7.2 },
{ x: 2008, y: 6.8 }, { x: 2009, y: 5.7 },
{ x: 2010, y: 10.8 }, { x: 2011, y: 9.8 }
];Point render
The pointRender event allows you to customize each data point before it is rendered on the chart. The callback receives an IPointRenderEventArgs argument that exposes the current point, series, fill, and border, plus a cancel flag.
<ejs-chart (pointRender)="onPointRender($event)"></ejs-chart>import { ChartModule, LineSeriesService, ErrorBarService } from '@syncfusion/ej2-angular-charts';
import { IPointRenderEventArgs } from '@syncfusion/ej2-charts';
import { Component, OnInit } from '@angular/core';
@Component({
imports: [ChartModule],
providers: [LineSeriesService, ErrorBarService],
standalone: true,
selector: 'app-container',
template: `<ejs-chart id="chart-container" (pointRender)='pointRender($event)' [primaryXAxis]='primaryXAxis' [title]='title'>
<e-series-collection>
<e-series [dataSource]='chartData' type='Line' xName='x' yName='y' name='India' width='2' [marker]='marker' [errorBar]='errorBar'></e-series>
</e-series-collection>
</ejs-chart>`
})
export class AppComponent implements OnInit {
public primaryXAxis?: Object;
public chartData?: Object[];
public title?: string;
public marker?: Object;
public errorBar?: Object;
ngOnInit(): void {
this.chartData = [
{ x: 2006, y: 7.8 }, { x: 2007, y: 7.2 },
{ x: 2008, y: 6.8 }, { x: 2009, y: 10.7 },
{ x: 2010, y: 10.8 }, { x: 2011, y: 9.8 }
];
this.primaryXAxis = {
title: 'Year',
minimum: 2005,
maximum: 2012,
interval: 1
};
this.marker = { visible: true };
this.errorBar = { visible: true };
this.title = 'Unemployment rate (%)';
}
public pointRender(args: IPointRenderEventArgs): void {
args.fill = '#ff6347';
}
}import { bootstrapApplication } from '@angular/platform-browser';
import { AppComponent } from './app.component';
import 'zone.js';
bootstrapApplication(AppComponent).catch((err) => console.error(err));export let errorData: Object[] = [
{ x: 2006, y: 7.8 }, { x: 2007, y: 7.2 },
{ x: 2008, y: 6.8 }, { x: 2009, y: 5.7 },
{ x: 2010, y: 10.8 }, { x: 2011, y: 9.8 }
];Troubleshooting
The following symptoms map to the most common configuration issues.
-
Error bars do not appear: Confirm that
ErrorBarServiceis registered, and that the series has[errorBarSettings]='errorBarSettings'withvisible: true. -
Error bars are the same length on every point: With
type: 'Fixed', the magnitude is taken fromverticalError. Switch toCustomto provide per-point values. -
The custom error values are ignored: Verify that
errorBarSettings.typeisCustom, and that the data source fields match the names mapped viaverticalNegativeError,verticalPositiveError,horizontalNegativeError, andhorizontalPositiveError. -
pointRenderdoes not fire: Confirm you bind the event on the<ejs-chart>element with(pointRender)="...", not on the series.