Range Column Chart in Angular Charts
Range Column
A range column chart displays vertical columns whose lower and upper boundaries represent the low and high values of each data point. Use it to visualize ranges such as temperature variation or price movement.
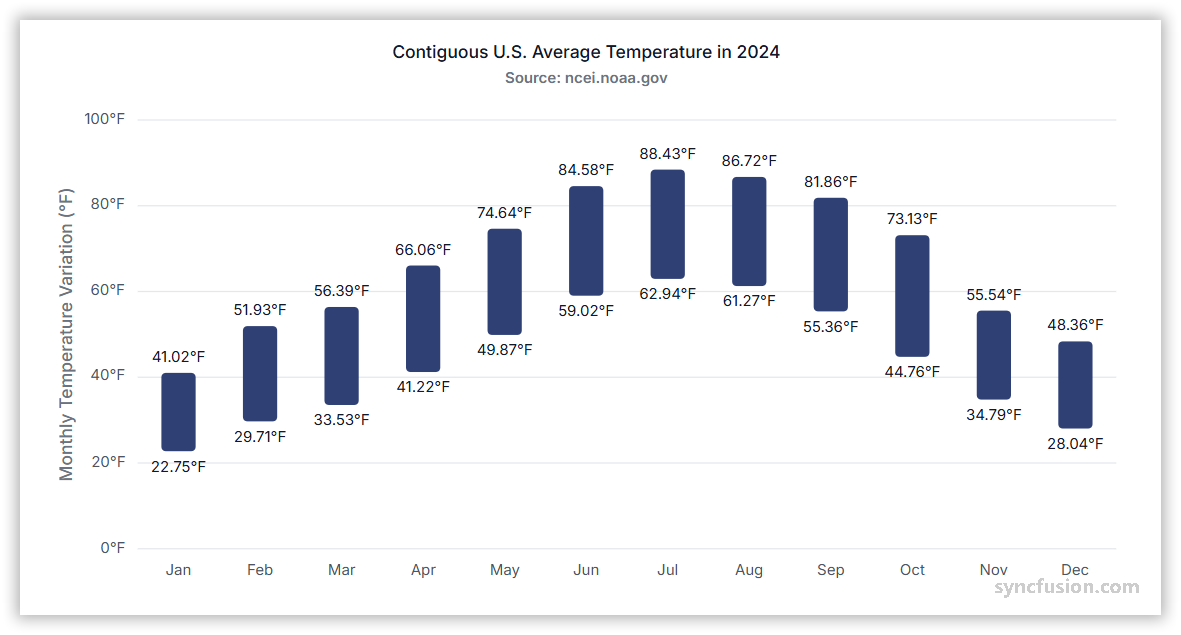
To render a range column series:
-
Set the series type: Define the series
typeasRangeColumnin your chart configuration. -
Provide RangeColumnSeriesService: Add
RangeColumnSeriesServiceto your module’sprovidersarray so the chart can render the RangeColumn series. -
Provide high and low values: The
RangeColumnseries requires two y-values for each data point. Specify thehighvalue as the upper boundary and thelowvalue as the lower boundary of each column.
import { ChartModule } from '@syncfusion/ej2-angular-charts';
import { CategoryService, RangeColumnSeriesService } from '@syncfusion/ej2-angular-charts';


import { Component, OnInit } from '@angular/core';
import { data1 } from './datasource';
import { data2 } from './datasource';
@Component({
imports: [
         ChartModule
    ],

providers: [CategoryService, RangeColumnSeriesService],
standalone: true,
    selector: 'app-container',
    template: `<ejs-chart id="chart-container" [primaryXAxis]='primaryXAxis' [title]='title'>
        <e-series-collection>
            <e-series [dataSource]='data1' type='RangeColumn' xName='x' low='low' high='high'></e-series>
            <e-series [dataSource]='data2' type='RangeColumn' xName='x' low='low' high='high'></e-series>
        </e-series-collection>
    </ejs-chart>`
})

export class AppComponent implements OnInit {
    public primaryXAxis?: Object;
    public title?: string;
    public data1?: Object[];
    public data2?: Object[];
    ngOnInit(): void {
        this.data1 = data1;
        this.data2 = data2;
        this.primaryXAxis = {
            title: 'month',
            valueType: 'Category'
        };
        this.title = 'Maximum and minimum Temperature';
    }
}
import { bootstrapApplication } from '@angular/platform-browser';
import { AppComponent } from './app.component';
import 'zone.js';
bootstrapApplication(AppComponent).catch((err) => console.error(err));export let data1: Object[] = [
{ x: 'Jan', low: 0.7, high: 6.1 }, { x: 'Feb', low: 1.3, high: 6.3 }, { x: 'Mar', low: 1.9, high: 8.5 },
{ x: 'Apr', low: 3.1, high: 10.8 }, { x: 'May', low: 5.7, high: 14.40 }, { x: 'Jun', low: 8.4, high: 16.90 },
{ x: 'Jul', low: 10.6, high: 19.20 }, { x: 'Aug', low: 10.5, high: 18.9 }, { x: 'Sep', low: 8.5, high: 16.1 },
{ x: 'Oct', low: 6.0, high: 12.5 }, { x: 'Nov', low: 1.5, high: 6.9 }, { x: 'Dec', low: 5.1, high: 12.1 }
];
export let data2: Object[] = [
{ x: 'Jan', low: 1.7, high: 7.1 }, { x: 'Feb', low: 1.9, high: 7.7 }, { x: 'Mar', low: 1.2, high: 7.5 },
{ x: 'Apr', low: 2.5, high: 9.8 }, { x: 'May', low: 4.7, high: 11.4 }, { x: 'Jun', low: 6.4, high: 14.4 },
{ x: 'Jul', low: 9.6, high: 17.2 }, { x: 'Aug', low: 10.7, high: 17.9 }, { x: 'Sep', low: 7.5, high: 15.1 },
{ x: 'Oct', low: 3.0, high: 10.5 }, { x: 'Nov', low: 1.2, high: 7.9 }, { x: 'Dec', low: 4.1, high: 9.1 }
];Binding data to a series
Bind a local JSON array to the series with the dataSource property. Map the data fields with xName, high, and low, as shown in the preceding example.
When data is loaded asynchronously, assign the resolved array to the bound property. Handle loading and request failures in the application’s data service before updating the chart data source.
import { ChartModule } from '@syncfusion/ej2-angular-charts';
import { CategoryService, RangeColumnSeriesService } from '@syncfusion/ej2-angular-charts';


import { Component, OnInit } from '@angular/core';
import { data1 } from './datasource';
import { data2 } from './datasource';
@Component({
imports: [
         ChartModule
    ],

providers: [CategoryService, RangeColumnSeriesService],
standalone: true,
    selector: 'app-container',
    template: `<ejs-chart id="chart-container" [primaryXAxis]='primaryXAxis' [title]='title'>
        <e-series-collection>
            <e-series [dataSource]='data1' type='RangeColumn' xName='x' low='low' high='high'></e-series>
            <e-series [dataSource]='data2' type='RangeColumn' xName='x' low='low' high='high'></e-series>
        </e-series-collection>
    </ejs-chart>`
})

export class AppComponent implements OnInit {
    public primaryXAxis?: Object;
    public title?: string;
    public data1?: Object[];
    public data2?: Object[];
    ngOnInit(): void {
        this.data1 = data1;
        this.data2 = data2;
        this.primaryXAxis = {
            title: 'month',
            valueType: 'Category'
        };
        this.title = 'Maximum and minimum Temperature';
    }
}
import { bootstrapApplication } from '@angular/platform-browser';
import { AppComponent } from './app.component';
import 'zone.js';
bootstrapApplication(AppComponent).catch((err) => console.error(err));export let data1: Object[] = [
{ x: 'Jan', low: 0.7, high: 6.1 }, { x: 'Feb', low: 1.3, high: 6.3 }, { x: 'Mar', low: 1.9, high: 8.5 },
{ x: 'Apr', low: 3.1, high: 10.8 }, { x: 'May', low: 5.7, high: 14.40 }, { x: 'Jun', low: 8.4, high: 16.90 },
{ x: 'Jul', low: 10.6, high: 19.20 }, { x: 'Aug', low: 10.5, high: 18.9 }, { x: 'Sep', low: 8.5, high: 16.1 },
{ x: 'Oct', low: 6.0, high: 12.5 }, { x: 'Nov', low: 1.5, high: 6.9 }, { x: 'Dec', low: 5.1, high: 12.1 }
];
export let data2: Object[] = [
{ x: 'Jan', low: 1.7, high: 7.1 }, { x: 'Feb', low: 1.9, high: 7.7 }, { x: 'Mar', low: 1.2, high: 7.5 },
{ x: 'Apr', low: 2.5, high: 9.8 }, { x: 'May', low: 4.7, high: 11.4 }, { x: 'Jun', low: 6.4, high: 14.4 },
{ x: 'Jul', low: 9.6, high: 17.2 }, { x: 'Aug', low: 10.7, high: 17.9 }, { x: 'Sep', low: 7.5, high: 15.1 },
{ x: 'Oct', low: 3.0, high: 10.5 }, { x: 'Nov', low: 1.2, high: 7.9 }, { x: 'Dec', low: 4.1, high: 9.1 }
];Series customization
The following properties can be used to customize the appearance of the RangeColumn series.
Solid fill
Use the fill property to set a solid fill color for the series.
import { ChartModule } from '@syncfusion/ej2-angular-charts';
import { CategoryService, RangeColumnSeriesService } from '@syncfusion/ej2-angular-charts';


import { Component, OnInit } from '@angular/core';
import { data1 } from './datasource';
import { data2 } from './datasource';
@Component({
imports: [
         ChartModule
    ],

providers: [CategoryService, RangeColumnSeriesService],
standalone: true,
    selector: 'app-container',
    template: `<ejs-chart id="chart-container" [primaryXAxis]='primaryXAxis' [title]='title'>
        <e-series-collection>
            <e-series [dataSource]='data1' type='RangeColumn' xName='x' low='low' high='high' fill='red' ></e-series>
            <e-series [dataSource]='data2' type='RangeColumn' xName='x' low='low' high='high' fill='yellow' ></e-series>
        </e-series-collection>
    </ejs-chart>`
})

export class AppComponent implements OnInit {
    public primaryXAxis?: Object;
    public title?: string;
    public data1?: Object[];
    public data2?: Object[];
    ngOnInit(): void {
        this.data1 = data1;
        this.data2 = data2;
        this.primaryXAxis = {
            title: 'month',
            valueType: 'Category'
        };
        this.title = 'Maximum and minimum Temperature';
    }
}
import { bootstrapApplication } from '@angular/platform-browser';
import { AppComponent } from './app.component';
import 'zone.js';
bootstrapApplication(AppComponent).catch((err) => console.error(err));export let data1: Object[] = [
{ x: 'Jan', low: 0.7, high: 6.1 }, { x: 'Feb', low: 1.3, high: 6.3 }, { x: 'Mar', low: 1.9, high: 8.5 },
{ x: 'Apr', low: 3.1, high: 10.8 }, { x: 'May', low: 5.7, high: 14.40 }, { x: 'Jun', low: 8.4, high: 16.90 },
{ x: 'Jul', low: 10.6, high: 19.20 }, { x: 'Aug', low: 10.5, high: 18.9 }, { x: 'Sep', low: 8.5, high: 16.1 },
{ x: 'Oct', low: 6.0, high: 12.5 }, { x: 'Nov', low: 1.5, high: 6.9 }, { x: 'Dec', low: 5.1, high: 12.1 }
];
export let data2: Object[] = [
{ x: 'Jan', low: 1.7, high: 7.1 }, { x: 'Feb', low: 1.9, high: 7.7 }, { x: 'Mar', low: 1.2, high: 7.5 },
{ x: 'Apr', low: 2.5, high: 9.8 }, { x: 'May', low: 4.7, high: 11.4 }, { x: 'Jun', low: 6.4, high: 14.4 },
{ x: 'Jul', low: 9.6, high: 17.2 }, { x: 'Aug', low: 10.7, high: 17.9 }, { x: 'Sep', low: 7.5, high: 15.1 },
{ x: 'Oct', low: 3.0, high: 10.5 }, { x: 'Nov', low: 1.2, high: 7.9 }, { x: 'Dec', low: 4.1, high: 9.1 }
];Gradient fill
The fill property can apply an SVG gradient to a range column series. Define the gradient within an SVG <defs> element using a unique ID, and assign it to the series in the url(#gradientId) format. Place the following SVG elements in your application’s index.html file, inside the <body> element and outside the <app-container> element.
<svg>
    <defs>
        <linearGradient id="gradient1">
            <stop offset="0%" style="stop-color:blue;stop-opacity:5" />
            <stop offset="50%" style="stop-color:violet;stop-opacity:5" />
        </linearGradient>
    </defs>
</svg>
<svg>
    <defs>
        <linearGradient id="gradient2">
            <stop offset="0%" style="stop-color:darkred;stop-opacity:5" />
            <stop offset="50%" style="stop-color:darkorange;stop-opacity:5" />
        </linearGradient>
    </defs>
</svg>
Apply the gradients to the series by setting fill to url(#gradient1) and url(#gradient2), respectively.
import { ChartModule } from '@syncfusion/ej2-angular-charts'
import { CategoryService, DateTimeService, ScrollBarService, ColumnSeriesService, LineSeriesService,
    ChartAnnotationService, RangeColumnSeriesService, StackingColumnSeriesService,LegendService, TooltipService
 } from '@syncfusion/ej2-angular-charts'


import { Component, OnInit } from '@angular/core';
import { data1 } from './datasource';
import { data2 } from './datasource';
@Component({
imports: [
         ChartModule
    ],

providers: [ CategoryService, DateTimeService, ScrollBarService, LineSeriesService, ColumnSeriesService,
        ChartAnnotationService, RangeColumnSeriesService, StackingColumnSeriesService, LegendService, TooltipService,],
standalone: true,
    selector: 'app-container',
    template: `<ejs-chart id="chart-container" [primaryXAxis]='primaryXAxis' [title]='title'>
        <e-series-collection>
            <e-series [dataSource]='data1' type='RangeColumn' xName='x' low='low' high='high' fill='url(#gradient1)' ></e-series>
            <e-series [dataSource]='data2' type='RangeColumn' xName='x' low='low' high='high' fill='url(#gradient2)' ></e-series>
        </e-series-collection>
    </ejs-chart>`
})

export class AppComponent implements OnInit {
    public primaryXAxis?: Object;
    public border?: Object;
    public title?: string;
    public data1?: Object[];
    public data2?: Object[];
    ngOnInit(): void {
        this.data1 = data1;
        this.data2 = data2;
        this.primaryXAxis = {
            title: 'month',
            valueType: 'Category'
        };
        this.title = 'Maximum and minimum Temperature';
    }
}
import { bootstrapApplication } from '@angular/platform-browser';
import { AppComponent } from './app.component';
import 'zone.js';
bootstrapApplication(AppComponent).catch((err) => console.error(err));export let data1: Object[] = [
{ x: 'Jan', low: 0.7, high: 6.1 }, { x: 'Feb', low: 1.3, high: 6.3 }, { x: 'Mar', low: 1.9, high: 8.5 },
{ x: 'Apr', low: 3.1, high: 10.8 }, { x: 'May', low: 5.7, high: 14.40 }, { x: 'Jun', low: 8.4, high: 16.90 },
{ x: 'Jul', low: 10.6, high: 19.20 }, { x: 'Aug', low: 10.5, high: 18.9 }, { x: 'Sep', low: 8.5, high: 16.1 },
{ x: 'Oct', low: 6.0, high: 12.5 }, { x: 'Nov', low: 1.5, high: 6.9 }, { x: 'Dec', low: 5.1, high: 12.1 }
];
export let data2: Object[] = [
{ x: 'Jan', low: 1.7, high: 7.1 }, { x: 'Feb', low: 1.9, high: 7.7 }, { x: 'Mar', low: 1.2, high: 7.5 },
{ x: 'Apr', low: 2.5, high: 9.8 }, { x: 'May', low: 4.7, high: 11.4 }, { x: 'Jun', low: 6.4, high: 14.4 },
{ x: 'Jul', low: 9.6, high: 17.2 }, { x: 'Aug', low: 10.7, high: 17.9 }, { x: 'Sep', low: 7.5, high: 15.1 },
{ x: 'Oct', low: 3.0, high: 10.5 }, { x: 'Nov', low: 1.2, high: 7.9 }, { x: 'Dec', low: 4.1, high: 9.1 }
];Opacity
Use the opacity property to set the transparency of the series. Values range from 0 (fully transparent) to 1 (fully opaque).
import { ChartModule } from '@syncfusion/ej2-angular-charts';
import { CategoryService, RangeColumnSeriesService } from '@syncfusion/ej2-angular-charts';


import { Component, OnInit } from '@angular/core';
import { data1 } from './datasource';
import { data2 } from './datasource';
@Component({
imports: [
         ChartModule
    ],

providers: [CategoryService, RangeColumnSeriesService],
standalone: true,
    selector: 'app-container',
    template: `<ejs-chart id="chart-container" [primaryXAxis]='primaryXAxis' [title]='title'>
        <e-series-collection>
            <e-series [dataSource]='data1' type='RangeColumn' xName='x' low='low' high='high' opacity='0.5' ></e-series>
            <e-series [dataSource]='data2' type='RangeColumn' xName='x' low='low' high='high' opacity='0.5' ></e-series>
        </e-series-collection>
    </ejs-chart>`
})

export class AppComponent implements OnInit {
    public primaryXAxis?: Object;
    public title?: string;
    public data1?: Object[];
    public data2?: Object[];
    ngOnInit(): void {
        this.data1 = data1;
        this.data2 = data2;
        this.primaryXAxis = {
            title: 'month',
            valueType: 'Category'
        };
        this.title = 'Maximum and minimum Temperature';
    }
}
import { bootstrapApplication } from '@angular/platform-browser';
import { AppComponent } from './app.component';
import 'zone.js';
bootstrapApplication(AppComponent).catch((err) => console.error(err));export let data1: Object[] = [
{ x: 'Jan', low: 0.7, high: 6.1 }, { x: 'Feb', low: 1.3, high: 6.3 }, { x: 'Mar', low: 1.9, high: 8.5 },
{ x: 'Apr', low: 3.1, high: 10.8 }, { x: 'May', low: 5.7, high: 14.40 }, { x: 'Jun', low: 8.4, high: 16.90 },
{ x: 'Jul', low: 10.6, high: 19.20 }, { x: 'Aug', low: 10.5, high: 18.9 }, { x: 'Sep', low: 8.5, high: 16.1 },
{ x: 'Oct', low: 6.0, high: 12.5 }, { x: 'Nov', low: 1.5, high: 6.9 }, { x: 'Dec', low: 5.1, high: 12.1 }
];
export let data2: Object[] = [
{ x: 'Jan', low: 1.7, high: 7.1 }, { x: 'Feb', low: 1.9, high: 7.7 }, { x: 'Mar', low: 1.2, high: 7.5 },
{ x: 'Apr', low: 2.5, high: 9.8 }, { x: 'May', low: 4.7, high: 11.4 }, { x: 'Jun', low: 6.4, high: 14.4 },
{ x: 'Jul', low: 9.6, high: 17.2 }, { x: 'Aug', low: 10.7, high: 17.9 }, { x: 'Sep', low: 7.5, high: 15.1 },
{ x: 'Oct', low: 3.0, high: 10.5 }, { x: 'Nov', low: 1.2, high: 7.9 }, { x: 'Dec', low: 4.1, high: 9.1 }
];Border
Use the border property to customize the series border color, width, and dash pattern.
import { ChartModule } from '@syncfusion/ej2-angular-charts';
import { CategoryService, RangeColumnSeriesService } from '@syncfusion/ej2-angular-charts';


import { Component, OnInit } from '@angular/core';
import { data1 } from './datasource';
import { data2 } from './datasource';
@Component({
imports: [
         ChartModule
    ],

providers: [CategoryService, RangeColumnSeriesService],
standalone: true,
    selector: 'app-container',
    template: `<ejs-chart id="chart-container" [primaryXAxis]='primaryXAxis' [title]='title'>
        <e-series-collection>
            <e-series [dataSource]='data1' type='RangeColumn' xName='x' low='low' high='high' [border]='border' ></e-series>
            <e-series [dataSource]='data2' type='RangeColumn' xName='x' low='low' high='high' [border]='border' ></e-series>
        </e-series-collection>
    </ejs-chart>`
})

export class AppComponent implements OnInit {
    public primaryXAxis?: Object;
    public border?: Object;
    public title?: string;
    public data1?: Object[];
    public data2?: Object[];
    ngOnInit(): void {
        this.data1 = data1;
        this.data2 = data2;
        this.primaryXAxis = {
            title: 'month',
            valueType: 'Category'
        };
        this.title = 'Maximum and minimum Temperature';
        this.border = { width: 2, color: '#4C4C4C', dashArray: '2,5' }
    }
}
import { bootstrapApplication } from '@angular/platform-browser';
import { AppComponent } from './app.component';
import 'zone.js';
bootstrapApplication(AppComponent).catch((err) => console.error(err));export let data1: Object[] = [
{ x: 'Jan', low: 0.7, high: 6.1 }, { x: 'Feb', low: 1.3, high: 6.3 }, { x: 'Mar', low: 1.9, high: 8.5 },
{ x: 'Apr', low: 3.1, high: 10.8 }, { x: 'May', low: 5.7, high: 14.40 }, { x: 'Jun', low: 8.4, high: 16.90 },
{ x: 'Jul', low: 10.6, high: 19.20 }, { x: 'Aug', low: 10.5, high: 18.9 }, { x: 'Sep', low: 8.5, high: 16.1 },
{ x: 'Oct', low: 6.0, high: 12.5 }, { x: 'Nov', low: 1.5, high: 6.9 }, { x: 'Dec', low: 5.1, high: 12.1 }
];
export let data2: Object[] = [
{ x: 'Jan', low: 1.7, high: 7.1 }, { x: 'Feb', low: 1.9, high: 7.7 }, { x: 'Mar', low: 1.2, high: 7.5 },
{ x: 'Apr', low: 2.5, high: 9.8 }, { x: 'May', low: 4.7, high: 11.4 }, { x: 'Jun', low: 6.4, high: 14.4 },
{ x: 'Jul', low: 9.6, high: 17.2 }, { x: 'Aug', low: 10.7, high: 17.9 }, { x: 'Sep', low: 7.5, high: 15.1 },
{ x: 'Oct', low: 3.0, high: 10.5 }, { x: 'Nov', low: 1.2, high: 7.9 }, { x: 'Dec', low: 4.1, high: 9.1 }
];Empty points
A range point is empty when a mapped high or low value is null or undefined. Configure its behavior with emptyPointSettings.mode. The supported modes are:
-
Gap: Leaves a gap at the empty point. This is the default mode. -
Zero: Replaces the missing value with zero. -
Average: Replaces the missing value with an average derived from neighboring points. -
Drop: Omits the empty point from rendering.
Mode
import { ChartModule } from '@syncfusion/ej2-angular-charts';
import { CategoryService, RangeColumnSeriesService } from '@syncfusion/ej2-angular-charts';


import { Component, OnInit } from '@angular/core';
import { data1 } from './datasource';
import { data2 } from './datasource';
@Component({
imports: [
         ChartModule
    ],

providers: [CategoryService, RangeColumnSeriesService],
standalone: true,
    selector: 'app-container',
    template: `<ejs-chart id="chart-container" [primaryXAxis]='primaryXAxis' [title]='title'>
        <e-series-collection>
            <e-series [dataSource]='data1' type='RangeColumn' xName='x' low='low' high='high' [emptyPointSettings]='emptyPointSettings' ></e-series>
            <e-series [dataSource]='data2' type='RangeColumn' xName='x' low='low' high='high' [emptyPointSettings]='emptyPointSettings' ></e-series>
        </e-series-collection>
    </ejs-chart>`
})

export class AppComponent implements OnInit {
    public primaryXAxis?: Object;
    public emptyPointSettings?: Object;
    public title?: string;
    public data1?: Object[];
    public data2?: Object[];
    ngOnInit(): void {
        this.data1 = data1;
        this.data2 = data2;
        this.primaryXAxis = {
            title: 'month',
            valueType: 'Category'
        };
        this.title = 'Maximum and minimum Temperature';
        this.emptyPointSettings = {
            mode: 'Gap'
        }
    }
}
import { bootstrapApplication } from '@angular/platform-browser';
import { AppComponent } from './app.component';
import 'zone.js';
bootstrapApplication(AppComponent).catch((err) => console.error(err));export let data1: Object[] = [
{ x: 'Jan', low: 0.7, high: 6.1 }, { x: 'Feb', low: 1.3, high: 6.3 }, { x: 'Mar', low: 1.9, high: 8.5 },
{ x: 'Apr', low: null, high: 10.8 }, { x: 'May', low: 5.7, high: 14.40 }, { x: 'Jun', low: 8.4, high: 16.90 },
{ x: 'Jul', low: 10.6, high: 19.20 }, { x: 'Aug', low: 10.5, high: 18.9 }, { x: 'Sep', low: undefined, high: 16.1 },
{ x: 'Oct', low: 6.0, high: 12.5 }, { x: 'Nov', low: 1.5, high: 6.9 }, { x: 'Dec', low: 5.1, high: 12.1 }
];
export let data2: Object[] = [
{ x: 'Jan', low: 1.7, high: 7.1 }, { x: 'Feb', low: 1.9, high: 7.7 }, { x: 'Mar', low: 1.2, high: null },
{ x: 'Apr', low: 2.5, high: 9.8 }, { x: 'May', low: 4.7, high: 11.4 }, { x: 'Jun', low: 6.4, high: 14.4 },
{ x: 'Jul', low: 9.6, high: undefined }, { x: 'Aug', low: 10.7, high: 17.9 }, { x: 'Sep', low: 7.5, high: 15.1 },
{ x: 'Oct', low: 3.0, high: 10.5 }, { x: 'Nov', low: 1.2, high: 7.9 }, { x: 'Dec', low: 4.1, high: 9.1 }
];Empty-point fill
Use emptyPointSettings.fill to set the fill color of an empty point rendered by a mode such as Zero or Average. This setting has no visible effect when the mode is Gap or Drop.
import { ChartModule } from '@syncfusion/ej2-angular-charts';
import { CategoryService, RangeColumnSeriesService } from '@syncfusion/ej2-angular-charts';


import { Component, OnInit } from '@angular/core';
import { data1 } from './datasource';
import { data2 } from './datasource';
@Component({
imports: [
         ChartModule
    ],

providers: [CategoryService, RangeColumnSeriesService],
standalone: true,
    selector: 'app-container',
    template: `<ejs-chart id="chart-container" [primaryXAxis]='primaryXAxis' [title]='title'>
        <e-series-collection>
            <e-series [dataSource]='data1' type='RangeColumn' xName='x' low='low' high='high' [emptyPointSettings]='emptyPointSettings' ></e-series>
            <e-series [dataSource]='data2' type='RangeColumn' xName='x' low='low' high='high' [emptyPointSettings]='emptyPointSettings1' ></e-series>
        </e-series-collection>
    </ejs-chart>`
})

export class AppComponent implements OnInit {
    public primaryXAxis?: Object;
    public emptyPointSettings?: Object;
    public emptyPointSettings1?: Object;
    public title?: string;
    public data1?: Object[];
    public data2?: Object[];
    ngOnInit(): void {
        this.data1 = data1;
        this.data2 = data2;
        this.primaryXAxis = {
            title: 'month',
            valueType: 'Category'
        };
        this.title = 'Maximum and minimum Temperature';
        this.emptyPointSettings = {
             mode: 'Average',
                fill: 'red'
        };
        this.emptyPointSettings1 = {
            mode: 'Gap',
       }
    }
}
import { bootstrapApplication } from '@angular/platform-browser';
import { AppComponent } from './app.component';
import 'zone.js';
bootstrapApplication(AppComponent).catch((err) => console.error(err));export let data1: Object[] = [
{ x: 'Jan', low: 0.7, high: 6.1 }, { x: 'Feb', low: 1.3, high: 6.3 }, { x: 'Mar', low: 1.9, high: 8.5 },
{ x: 'Apr', low: null, high: 10.8 }, { x: 'May', low: 5.7, high: 14.40 }, { x: 'Jun', low: 8.4, high: 16.90 },
{ x: 'Jul', low: 10.6, high: 19.20 }, { x: 'Aug', low: 10.5, high: 18.9 }, { x: 'Sep', low: undefined, high: 16.1 },
{ x: 'Oct', low: 6.0, high: 12.5 }, { x: 'Nov', low: 1.5, high: 6.9 }, { x: 'Dec', low: 5.1, high: 12.1 }
];
export let data2: Object[] = [
{ x: 'Jan', low: 1.7, high: 7.1 }, { x: 'Feb', low: 1.9, high: 7.7 }, { x: 'Mar', low: 1.2, high: null },
{ x: 'Apr', low: 2.5, high: 9.8 }, { x: 'May', low: 4.7, high: 11.4 }, { x: 'Jun', low: 6.4, high: 14.4 },
{ x: 'Jul', low: 9.6, high: undefined }, { x: 'Aug', low: 10.7, high: 17.9 }, { x: 'Sep', low: 7.5, high: 15.1 },
{ x: 'Oct', low: 3.0, high: 10.5 }, { x: 'Nov', low: 1.2, high: 7.9 }, { x: 'Dec', low: 4.1, high: 9.1 }
];Empty-point border
Use emptyPointSettings.border to set the width and color of an empty point’s border. This setting has no visible effect when the mode is Gap or Drop.
import { ChartModule } from '@syncfusion/ej2-angular-charts';
import { CategoryService, RangeColumnSeriesService } from '@syncfusion/ej2-angular-charts';


import { Component, OnInit } from '@angular/core';
import { data1 } from './datasource';
import { data2 } from './datasource';
@Component({
imports: [
         ChartModule
    ],

providers: [CategoryService, RangeColumnSeriesService],
standalone: true,
    selector: 'app-container',
    template: `<ejs-chart id="chart-container" [primaryXAxis]='primaryXAxis' [title]='title'>
        <e-series-collection>
            <e-series [dataSource]='data1' type='RangeColumn' xName='x' low='low' high='high' [emptyPointSettings]='emptyPointSettings' ></e-series>
            <e-series [dataSource]='data2' type='RangeColumn' xName='x' low='low' high='high' [emptyPointSettings]='emptyPointSettings1' ></e-series>
        </e-series-collection>
    </ejs-chart>`
})

export class AppComponent implements OnInit {
    public primaryXAxis?: Object;
    public emptyPointSettings?: Object;
    public emptyPointSettings1?: Object;
    public title?: string;
    public data1?: Object[];
    public data2?: Object[];
    ngOnInit(): void {
        this.data1 = data1;
        this.data2 = data2;
        this.primaryXAxis = {
            title: 'month',
            valueType: 'Category'
        };
        this.title = 'Maximum and minimum Temperature';
        this.emptyPointSettings = {
            mode: 'Average',
            fill: 'red',
            border: { width: 2, color: 'green' }
        };
        this.emptyPointSettings1 = {
            mode: 'Gap',
       }
    }
}
import { bootstrapApplication } from '@angular/platform-browser';
import { AppComponent } from './app.component';
import 'zone.js';
bootstrapApplication(AppComponent).catch((err) => console.error(err));export let data1: Object[] = [
{ x: 'Jan', low: 0.7, high: 6.1 }, { x: 'Feb', low: 1.3, high: 6.3 }, { x: 'Mar', low: 1.9, high: 8.5 },
{ x: 'Apr', low: null, high: 10.8 }, { x: 'May', low: 5.7, high: 14.40 }, { x: 'Jun', low: 8.4, high: 16.90 },
{ x: 'Jul', low: 10.6, high: 19.20 }, { x: 'Aug', low: 10.5, high: 18.9 }, { x: 'Sep', low: undefined, high: 16.1 },
{ x: 'Oct', low: 6.0, high: 12.5 }, { x: 'Nov', low: 1.5, high: 6.9 }, { x: 'Dec', low: 5.1, high: 12.1 }
];
export let data2: Object[] = [
{ x: 'Jan', low: 1.7, high: 7.1 }, { x: 'Feb', low: 1.9, high: 7.7 }, { x: 'Mar', low: 1.2, high: null },
{ x: 'Apr', low: 2.5, high: 9.8 }, { x: 'May', low: 4.7, high: 11.4 }, { x: 'Jun', low: 6.4, high: 14.4 },
{ x: 'Jul', low: 9.6, high: undefined }, { x: 'Aug', low: 10.7, high: 17.9 }, { x: 'Sep', low: 7.5, high: 15.1 },
{ x: 'Oct', low: 3.0, high: 10.5 }, { x: 'Nov', low: 1.2, high: 7.9 }, { x: 'Dec', low: 4.1, high: 9.1 }
];Corner radius
Series corner radius
Use cornerRadius to round the corners of every column in the series. Configure individual corners with topLeft, topRight, bottomLeft, and bottomRight.
import { ChartModule } from '@syncfusion/ej2-angular-charts';
import { IPointRenderEventArgs } from '@syncfusion/ej2-charts';
import { CategoryService, RangeColumnSeriesService } from '@syncfusion/ej2-angular-charts';


import { Component, OnInit } from '@angular/core';
import { data1 } from './datasource';
import { data2 } from './datasource';
@Component({
imports: [
         ChartModule
    ],

providers: [CategoryService, RangeColumnSeriesService],
standalone: true,
    selector: 'app-container',
    template: `<ejs-chart id="chart-container" (pointRender)='pointRender($event)' [primaryXAxis]='primaryXAxis' [title]='title'>
        <e-series-collection>
            <e-series [dataSource]='data1' type='RangeColumn' xName='x' low='low' high='high' [cornerRadius]='cornerRadius' ></e-series>
            <e-series [dataSource]='data2' type='RangeColumn' xName='x' low='low' high='high' [cornerRadius]='cornerRadius' ></e-series>
        </e-series-collection>
    </ejs-chart>`
})

export class AppComponent implements OnInit {
    public primaryXAxis?: Object;
    public title?: string;
    public data1?: Object[];
    public data2?: Object[];
    public cornerRadius?: Object;
    ngOnInit(): void {
        this.data1 = data1;
        this.data2 = data2;
        this.primaryXAxis = {
            title: 'month',
            valueType: 'Category'
        };
        this.cornerRadius = { topLeft: 10, bottomLeft: 10, topRight: 10, bottomRight: 10 },
        this.title = 'Maximum and minimum Temperature';
    }
    public pointRender(args: IPointRenderEventArgs) {
        args.fill = 'green';
    }
}
import { bootstrapApplication } from '@angular/platform-browser';
import { AppComponent } from './app.component';
import 'zone.js';
bootstrapApplication(AppComponent).catch((err) => console.error(err));export let data1: Object[] = [
{ x: 'Jan', low: 0.7, high: 6.1 }, { x: 'Feb', low: 1.3, high: 6.3 }, { x: 'Mar', low: 1.9, high: 8.5 },
{ x: 'Apr', low: 3.1, high: 10.8 }, { x: 'May', low: 5.7, high: 14.40 }, { x: 'Jun', low: 8.4, high: 16.90 },
{ x: 'Jul', low: 10.6, high: 19.20 }, { x: 'Aug', low: 10.5, high: 18.9 }, { x: 'Sep', low: 8.5, high: 16.1 },
{ x: 'Oct', low: 6.0, high: 12.5 }, { x: 'Nov', low: 1.5, high: 6.9 }, { x: 'Dec', low: 5.1, high: 12.1 }
];
export let data2: Object[] = [
{ x: 'Jan', low: 1.7, high: 7.1 }, { x: 'Feb', low: 1.9, high: 7.7 }, { x: 'Mar', low: 1.2, high: 7.5 },
{ x: 'Apr', low: 2.5, high: 9.8 }, { x: 'May', low: 4.7, high: 11.4 }, { x: 'Jun', low: 6.4, high: 14.4 },
{ x: 'Jul', low: 9.6, high: 17.2 }, { x: 'Aug', low: 10.7, high: 17.9 }, { x: 'Sep', low: 7.5, high: 15.1 },
{ x: 'Oct', low: 3.0, high: 10.5 }, { x: 'Nov', low: 1.2, high: 7.9 }, { x: 'Dec', low: 4.1, high: 9.1 }
];Point corner radius
Handle the pointRender event and set the event argument’s cornerRadius property to customize a specific point before it is rendered.
import { ChartModule } from '@syncfusion/ej2-angular-charts';
import { IPointRenderEventArgs } from '@syncfusion/ej2-charts';
import { CategoryService, RangeColumnSeriesService } from '@syncfusion/ej2-angular-charts';


import { Component, OnInit } from '@angular/core';
import { data1 } from './datasource';
import { data2 } from './datasource';
@Component({
imports: [
         ChartModule
    ],

providers: [CategoryService, RangeColumnSeriesService],
standalone: true,
    selector: 'app-container',
    template: `<ejs-chart id="chart-container" (pointRender)='pointRender($event)' [primaryXAxis]='primaryXAxis' [title]='title'>
        <e-series-collection>
            <e-series [dataSource]='data1' type='RangeColumn' xName='x' low='low' high='high'  ></e-series>
            <e-series [dataSource]='data2' type='RangeColumn' xName='x' low='low' high='high'  ></e-series>
        </e-series-collection>
    </ejs-chart>`
})

export class AppComponent implements OnInit {
    public primaryXAxis?: Object;
    public title?: string;
    public data1?: Object[];
    public data2?: Object[];
    ngOnInit(): void {
        this.data1 = data1;
        this.data2 = data2;
        this.primaryXAxis = {
            title: 'month',
            valueType: 'Category'
        };
        this.title = 'Maximum and minimum Temperature';
    }
    public pointRender(args: IPointRenderEventArgs) {
        if (args.point.index === 1) {
            args.cornerRadius = { topLeft: 10, bottomLeft: 10, topRight: 10, bottomRight: 10 };
        }
        if (args.point.index === 4) {
            args.cornerRadius = { topLeft: 10, bottomLeft: 10, topRight: 10, bottomRight: 10 };
        }
    }
}
import { bootstrapApplication } from '@angular/platform-browser';
import { AppComponent } from './app.component';
import 'zone.js';
bootstrapApplication(AppComponent).catch((err) => console.error(err));export let data1: Object[] = [
{ x: 'Jan', low: 0.7, high: 6.1 }, { x: 'Feb', low: 1.3, high: 6.3 }, { x: 'Mar', low: 1.9, high: 8.5 },
{ x: 'Apr', low: 3.1, high: 10.8 }, { x: 'May', low: 5.7, high: 14.40 }, { x: 'Jun', low: 8.4, high: 16.90 },
{ x: 'Jul', low: 10.6, high: 19.20 }, { x: 'Aug', low: 10.5, high: 18.9 }, { x: 'Sep', low: 8.5, high: 16.1 },
{ x: 'Oct', low: 6.0, high: 12.5 }, { x: 'Nov', low: 1.5, high: 6.9 }, { x: 'Dec', low: 5.1, high: 12.1 }
];
export let data2: Object[] = [
{ x: 'Jan', low: 1.7, high: 7.1 }, { x: 'Feb', low: 1.9, high: 7.7 }, { x: 'Mar', low: 1.2, high: 7.5 },
{ x: 'Apr', low: 2.5, high: 9.8 }, { x: 'May', low: 4.7, high: 11.4 }, { x: 'Jun', low: 6.4, high: 14.4 },
{ x: 'Jul', low: 9.6, high: 17.2 }, { x: 'Aug', low: 10.7, high: 17.9 }, { x: 'Sep', low: 7.5, high: 15.1 },
{ x: 'Oct', low: 3.0, high: 10.5 }, { x: 'Nov', low: 1.2, high: 7.9 }, { x: 'Dec', low: 4.1, high: 9.1 }
];Events
Series render
The seriesRender event runs before a series is rendered. Use its event arguments to customize supported series properties such as data, fill, and name.
import { ChartModule } from '@syncfusion/ej2-angular-charts';
import { ISeriesRenderEventArgs } from '@syncfusion/ej2-charts';
import { CategoryService, RangeColumnSeriesService } from '@syncfusion/ej2-angular-charts';


import { Component, OnInit } from '@angular/core';
import { data1 } from './datasource';
import { data2 } from './datasource';
@Component({
imports: [
         ChartModule
    ],

providers: [CategoryService, RangeColumnSeriesService],
standalone: true,
    selector: 'app-container',
    template: `<ejs-chart id="chart-container" (seriesRender)='seriesRender($event)' [primaryXAxis]='primaryXAxis' [title]='title'>
        <e-series-collection>
            <e-series [dataSource]='data1' type='RangeColumn' xName='x' low='low' high='high'  ></e-series>
            <e-series [dataSource]='data2' type='RangeColumn' xName='x' low='low' high='high'  ></e-series>
        </e-series-collection>
    </ejs-chart>`
})

export class AppComponent implements OnInit {
    public primaryXAxis?: Object;
    public title?: string;
    public data1?: Object[];
    public data2?: Object[];
    ngOnInit(): void {
        this.data1 = data1;
        this.data2 = data2;
        this.primaryXAxis = {
            title: 'month',
            valueType: 'Category'
        };
        this.title = 'Maximum and minimum Temperature';
    }
    public seriesRender(args: ISeriesRenderEventArgs) {
        args.fill = '#ff6347';
    }
}
import { bootstrapApplication } from '@angular/platform-browser';
import { AppComponent } from './app.component';
import 'zone.js';
bootstrapApplication(AppComponent).catch((err) => console.error(err));export let data1: Object[] = [
{ x: 'Jan', low: 0.7, high: 6.1 }, { x: 'Feb', low: 1.3, high: 6.3 }, { x: 'Mar', low: 1.9, high: 8.5 },
{ x: 'Apr', low: 3.1, high: 10.8 }, { x: 'May', low: 5.7, high: 14.40 }, { x: 'Jun', low: 8.4, high: 16.90 },
{ x: 'Jul', low: 10.6, high: 19.20 }, { x: 'Aug', low: 10.5, high: 18.9 }, { x: 'Sep', low: 8.5, high: 16.1 },
{ x: 'Oct', low: 6.0, high: 12.5 }, { x: 'Nov', low: 1.5, high: 6.9 }, { x: 'Dec', low: 5.1, high: 12.1 }
];
export let data2: Object[] = [
{ x: 'Jan', low: 1.7, high: 7.1 }, { x: 'Feb', low: 1.9, high: 7.7 }, { x: 'Mar', low: 1.2, high: 7.5 },
{ x: 'Apr', low: 2.5, high: 9.8 }, { x: 'May', low: 4.7, high: 11.4 }, { x: 'Jun', low: 6.4, high: 14.4 },
{ x: 'Jul', low: 9.6, high: 17.2 }, { x: 'Aug', low: 10.7, high: 17.9 }, { x: 'Sep', low: 7.5, high: 15.1 },
{ x: 'Oct', low: 3.0, high: 10.5 }, { x: 'Nov', low: 1.2, high: 7.9 }, { x: 'Dec', low: 4.1, high: 9.1 }
];Point render
The pointRender event runs before each point is rendered. Use its event arguments to customize supported point properties. The point corner radius section shows how to use this event for per-point corner styling.
import { ChartModule } from '@syncfusion/ej2-angular-charts';
import { IPointRenderEventArgs } from '@syncfusion/ej2-charts';
import { CategoryService, RangeColumnSeriesService } from '@syncfusion/ej2-angular-charts';


import { Component, OnInit } from '@angular/core';
import { data1 } from './datasource';
import { data2 } from './datasource';
@Component({
imports: [
         ChartModule
    ],

providers: [CategoryService, RangeColumnSeriesService],
standalone: true,
    selector: 'app-container',
    template: `<ejs-chart id="chart-container" (pointRender)='pointRender($event)' [primaryXAxis]='primaryXAxis' [title]='title'>
        <e-series-collection>
            <e-series [dataSource]='data1' type='RangeColumn' xName='x' low='low' high='high'  ></e-series>
            <e-series [dataSource]='data2' type='RangeColumn' xName='x' low='low' high='high'  ></e-series>
        </e-series-collection>
    </ejs-chart>`
})

export class AppComponent implements OnInit {
    public primaryXAxis?: Object;
    public title?: string;
    public data1?: Object[];
    public data2?: Object[];
    ngOnInit(): void {
        this.data1 = data1;
        this.data2 = data2;
        this.primaryXAxis = {
            title: 'month',
            valueType: 'Category'
        };
        this.title = 'Maximum and minimum Temperature';
    }
    public pointRender(args: IPointRenderEventArgs) {
        args.fill = 'green';
    }
}
import { bootstrapApplication } from '@angular/platform-browser';
import { AppComponent } from './app.component';
import 'zone.js';
bootstrapApplication(AppComponent).catch((err) => console.error(err));export let data1: Object[] = [
{ x: 'Jan', low: 0.7, high: 6.1 }, { x: 'Feb', low: 1.3, high: 6.3 }, { x: 'Mar', low: 1.9, high: 8.5 },
{ x: 'Apr', low: 3.1, high: 10.8 }, { x: 'May', low: 5.7, high: 14.40 }, { x: 'Jun', low: 8.4, high: 16.90 },
{ x: 'Jul', low: 10.6, high: 19.20 }, { x: 'Aug', low: 10.5, high: 18.9 }, { x: 'Sep', low: 8.5, high: 16.1 },
{ x: 'Oct', low: 6.0, high: 12.5 }, { x: 'Nov', low: 1.5, high: 6.9 }, { x: 'Dec', low: 5.1, high: 12.1 }
];
export let data2: Object[] = [
{ x: 'Jan', low: 1.7, high: 7.1 }, { x: 'Feb', low: 1.9, high: 7.7 }, { x: 'Mar', low: 1.2, high: 7.5 },
{ x: 'Apr', low: 2.5, high: 9.8 }, { x: 'May', low: 4.7, high: 11.4 }, { x: 'Jun', low: 6.4, high: 14.4 },
{ x: 'Jul', low: 9.6, high: 17.2 }, { x: 'Aug', low: 10.7, high: 17.9 }, { x: 'Sep', low: 7.5, high: 15.1 },
{ x: 'Oct', low: 3.0, high: 10.5 }, { x: 'Nov', low: 1.2, high: 7.9 }, { x: 'Dec', low: 4.1, high: 9.1 }
];Troubleshooting
-
The chart renders without columns: Confirm that
RangeColumnSeriesServiceis registered and the seriestypeisRangeColumn. -
Categories do not appear correctly: Register the axis service required by the configured axis value type, such as
CategoryService, and verifyxNamematches the data field. -
A point does not render: Verify that both mapped
highandlowvalues are numeric. If either value isnullorundefined, reviewemptyPointSettings.mode. -
The range is inverted: Verify that each point’s
highvalue is greater than or equal to itslowvalue.