Candle Chart in Angular Charts
Candle
A Candle series represents the low, high, open, and closing prices over time. It is commonly used in financial charts to visualize stock price movements.
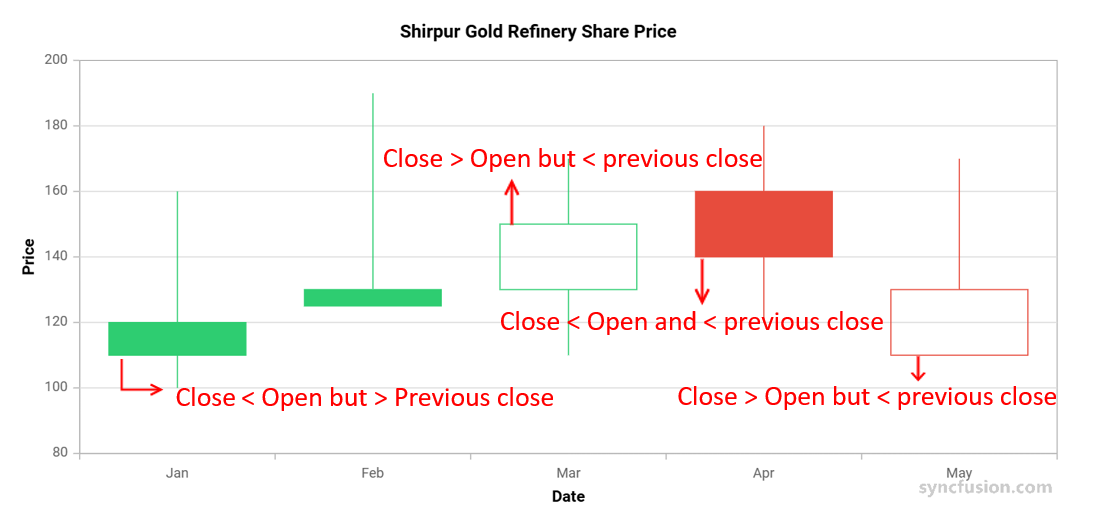
The default styling uses the following conventions:
- Green Hollow Candle - The closing price is higher than both the opening price and the previous candle’s closing price. Signals strong bullish momentum.
- Green Filled Candle - The closing price is lower than the opening price but still higher than the previous candle’s closing price. Suggests an overall upward trend with short-term weakness.
- Red Hollow Candle - The closing price is higher than the opening price but lower than the previous candle’s closing price. Indicates a downward trend with short-term strength.
- Red Filled Candle - The closing price is lower than both the opening price and the previous candle’s closing price. Signals strong bearish momentum.
Configure a Candle series as follows:
-
Set the series type: Set the series
typetoCandle. -
Register the service: Register
CandleSeriesService(and any required axis services) in the moduleprovidersarray, or inApplicationConfig.providersfor standalone applications. Confirm thatChartModuleis imported. -
Map the OHLC fields: Bind the data with
dataSource, and map the date and price fields withxName,high,low,open, andclose.
import { ChartModule, CategoryService, CandleSeriesService } from '@syncfusion/ej2-angular-charts';
import { Component, OnInit } from '@angular/core';

@Component({
    imports: [ChartModule],
    providers: [CategoryService, CandleSeriesService],
    standalone: true,
    selector: 'app-container',
    template: `<ejs-chart id="chart-container" [primaryXAxis]='primaryXAxis' [primaryYAxis]='primaryYAxis' [title]='title'>
        <e-series-collection>
            <e-series [dataSource]='data' type='Candle' xName='x' high='high' low='low' open='open' close='close' name='SHIRPUR-G'></e-series>
        </e-series-collection>
    </ejs-chart>`
})
export class AppComponent implements OnInit {
    public primaryXAxis?: Object;
    public title?: string;
    public primaryYAxis?: Object;
    public data?: Object[];

    ngOnInit(): void {
        this.data = [
            { x: 'Jan', open: 120, high: 160, low: 100, close: 140 },
            { x: 'Feb', open: 150, high: 190, low: 130, close: 170 },
            { x: 'Mar', open: 130, high: 170, low: 110, close: 150 },
            { x: 'Apr', open: 160, high: 180, low: 120, close: 140 },
            { x: 'May', open: 150, high: 170, low: 110, close: 130 }
        ];
        this.primaryXAxis = {
            title: 'Date',
            valueType: 'Category'
        };
        this.primaryYAxis = {
            title: 'Price',
            minimum: 100,
            maximum: 200,
            interval: 20
        };
        this.title = 'Shirpur Gold Refinery Share Price';
    }
}
import { bootstrapApplication } from '@angular/platform-browser';
import { AppComponent } from './app.component';
import 'zone.js';
bootstrapApplication(AppComponent).catch((err) => console.error(err));export let candleData : Object[] = [
{ x: 'Jan', open: 120, high: 160, low: 100, close: 140 },
{ x: 'Feb', open: 150, high: 190, low: 130, close: 170 },
{ x: 'Mar', open: 130, high: 170, low: 110, close: 150 },
{ x: 'Apr', open: 160, high: 180, low: 120, close: 140 },
{ x: 'May', open: 150, high: 170, low: 110, close: 130 }
];Series customization
Customize a Candle series using the following properties.
Hollow candles
Hollow candles let you visually compare the current price with the previous price by coloring them differently. The candles are filled or left hollow based on the following criteria:
| State | Behavior |
|---|---|
Filled |
Candlesticks are filled when the close value is lesser than the open value. |
Unfilled |
Candlesticks are unfilled when the close value is greater than the open value. |
By default, bullFillColor is red and bearFillColor is green. Override these values on the series to match your market convention.
Solid candles
The enableSolidCandles property is used to enable or disable solid candles. By default, it is set to false. When solid candles are enabled, the fill color of the candle is determined solely by its opening and closing values:
- The
bearFillColoris applied when the opening value is less than the closing value. - The
bullFillColoris applied when the opening value is greater than the closing value.
import { ChartModule, CategoryService, CandleSeriesService } from '@syncfusion/ej2-angular-charts';
import { Component, OnInit } from '@angular/core';
import { candleData } from './datasource';

@Component({
    imports: [ChartModule],
    providers: [CategoryService, CandleSeriesService],
    standalone: true,
    selector: 'app-container',
    template: `<ejs-chart id="chart-container" [primaryXAxis]='primaryXAxis' [primaryYAxis]='primaryYAxis' [title]='title'>
        <e-series-collection>
            <e-series [dataSource]='data' type='Candle' xName='x' high='high' low='low' open='open' close='close' name='SHIRPUR-G' bearFillColor='#e56590' bullFillColor='#f8b883' [enableSolidCandles]='enableSolidCandles'></e-series>
        </e-series-collection>
    </ejs-chart>`
})
export class AppComponent implements OnInit {
    public primaryXAxis?: Object;
    public title?: string;
    public primaryYAxis?: Object;
    public data?: Object[];
    public enableSolidCandles?: boolean;

    ngOnInit(): void {
        this.data = candleData;
        this.primaryXAxis = {
            title: 'Date',
            valueType: 'Category'
        };
        this.primaryYAxis = {
            title: 'Price in Dollar',
            minimum: 100,
            maximum: 200,
            interval: 20
        };
        this.enableSolidCandles = true;
        this.title = 'Financial Analysis';
    }
}
import { bootstrapApplication } from '@angular/platform-browser';
import { AppComponent } from './app.component';
import 'zone.js';
bootstrapApplication(AppComponent).catch((err) => console.error(err));export let candleData : Object[] = [
{ x: 'Jan', open: 120, high: 160, low: 100, close: 140 },
{ x: 'Feb', open: 150, high: 190, low: 130, close: 170 },
{ x: 'Mar', open: 130, high: 170, low: 110, close: 150 },
{ x: 'Apr', open: 160, high: 180, low: 120, close: 140 },
{ x: 'May', open: 150, high: 170, low: 110, close: 130 }
];Empty points
A data point whose mapped value is null or undefined is empty. Configure its behavior with emptyPointSettings.mode.
Mode
Use mode to control empty-point rendering. The default is Gap.
| Mode | Visual behavior |
|---|---|
Gap |
Skip the empty point; subsequent candles are still rendered. |
Zero |
Treat the empty point as 0 and render a flat candle. |
Drop |
Drop the empty candle; subsequent points are still rendered. |
Average |
Replace the empty value with the average of the surrounding points. |
import { ChartModule, CategoryService, CandleSeriesService } from '@syncfusion/ej2-angular-charts';
import { Component, OnInit } from '@angular/core';
import { chartData } from './datasource';

@Component({
    imports: [ChartModule],
    providers: [CategoryService, CandleSeriesService],
    standalone: true,
    selector: 'app-container',
    template: `<ejs-chart id="chart-container" [primaryXAxis]='primaryXAxis' [primaryYAxis]='primaryYAxis' [title]='title'>
        <e-series-collection>
            <e-series [dataSource]='data' type='Candle' xName='x' high='high' low='low' open='open' close='close' name='SHIRPUR-G' [emptyPointSettings]='emptyPointSettings'></e-series>
        </e-series-collection>
    </ejs-chart>`
})
export class AppComponent implements OnInit {
    public primaryXAxis?: Object;
    public title?: string;
    public primaryYAxis?: Object;
    public data?: Object[];
    public emptyPointSettings?: Object;

    ngOnInit(): void {
        this.data = chartData;
        this.primaryXAxis = {
            title: 'Date',
            valueType: 'Category'
        };
        this.primaryYAxis = {
            title: 'Price',
            minimum: 100,
            maximum: 200,
            interval: 20
        };
        this.emptyPointSettings = {
            mode: 'Average'
        };
        this.title = 'Shirpur Gold Refinery Share Price';
    }
}
import { bootstrapApplication } from '@angular/platform-browser';
import { AppComponent } from './app.component';
import 'zone.js';
bootstrapApplication(AppComponent).catch((err) => console.error(err));export let chartData: Object[] = [
{ x: 'Jan', open: 120, high: 160, low: 100, close: 140 },
{ x: 'Feb', open: 150, high: 190, low: 130, close: 170 },
{ x: 'Mar', open: null, high: 170, low: 110, close: 150 },
{ x: 'Apr', open: 160, high: 180, low: 120, close: 140 },
{ x: 'May', open: 150, high: 170, low: 110, close: 130 },
];Empty-point fill
Use the emptyPointSettings.fill property to customize the fill color of empty-point candles.
import { ChartModule, CategoryService, CandleSeriesService } from '@syncfusion/ej2-angular-charts';
import { Component, OnInit } from '@angular/core';
import { chartData } from './datasource';

@Component({
    imports: [ChartModule],
    providers: [CategoryService, CandleSeriesService],
    standalone: true,
    selector: 'app-container',
    template: `<ejs-chart id="chart-container" [primaryXAxis]='primaryXAxis' [primaryYAxis]='primaryYAxis' [title]='title'>
        <e-series-collection>
            <e-series [dataSource]='data' type='Candle' xName='x' high='high' low='low' open='open' close='close' name='SHIRPUR-G' [emptyPointSettings]='emptyPointSettings'></e-series>
        </e-series-collection>
    </ejs-chart>`
})
export class AppComponent implements OnInit {
    public primaryXAxis?: Object;
    public title?: string;
    public primaryYAxis?: Object;
    public data?: Object[];
    public emptyPointSettings?: Object;

    ngOnInit(): void {
        this.data = chartData;
        this.primaryXAxis = {
            title: 'Date',
            valueType: 'Category'
        };
        this.primaryYAxis = {
            title: 'Price',
            minimum: 100,
            maximum: 200,
            interval: 20
        };
        this.emptyPointSettings = {
            mode: 'Average',
            fill: 'blue'
        };
        this.title = 'Shirpur Gold Refinery Share Price';
    }
}
import { bootstrapApplication } from '@angular/platform-browser';
import { AppComponent } from './app.component';
import 'zone.js';
bootstrapApplication(AppComponent).catch((err) => console.error(err));export let chartData: Object[] = [
{ x: 'Jan', open: 120, high: 160, low: 100, close: 140 },
{ x: 'Feb', open: 150, high: 190, low: 130, close: 170 },
{ x: 'Mar', open: null, high: 170, low: 110, close: 150 },
{ x: 'Apr', open: 160, high: 180, low: 120, close: 140 },
{ x: 'May', open: 150, high: 170, low: 110, close: 130 }
];Events
Series render
The seriesRender event allows you to customize series properties, such as data, fill, and name, before they are rendered on the chart. The callback receives an ISeriesRenderEventArgs argument that exposes mutable series and data properties.
<ejs-chart (seriesRender)="onSeriesRender($event)"></ejs-chart>import { ChartModule, CategoryService, CandleSeriesService } from '@syncfusion/ej2-angular-charts';
import { ISeriesRenderEventArgs } from '@syncfusion/ej2-charts';
import { Component, OnInit } from '@angular/core';
@Component({
imports: [ChartModule],
providers: [CategoryService, CandleSeriesService],
standalone: true,
selector: 'app-container',
template: `<ejs-chart id="chart-container" (seriesRender)='seriesRender($event)' [primaryXAxis]='primaryXAxis' [primaryYAxis]='primaryYAxis' [title]='title'>
<e-series-collection>
<e-series [dataSource]='data' type='Candle' xName='x' high='high' low='low' open='open' close='close' name='SHIRPUR-G'></e-series>
</e-series-collection>
</ejs-chart>`
})
export class AppComponent implements OnInit {
public primaryXAxis?: Object;
public title?: string;
public primaryYAxis?: Object;
public data?: Object[];
ngOnInit(): void {
this.data = [
{ x: 'Jan', open: 120, high: 160, low: 100, close: 140 },
{ x: 'Feb', open: 150, high: 190, low: 130, close: 170 },
{ x: 'Mar', open: 130, high: 170, low: 110, close: 150 },
{ x: 'Apr', open: 160, high: 180, low: 120, close: 140 },
{ x: 'May', open: 150, high: 170, low: 110, close: 130 }
];
this.primaryXAxis = {
title: 'Date',
valueType: 'Category'
};
this.primaryYAxis = {
title: 'Price',
minimum: 100,
maximum: 200,
interval: 20
};
this.title = 'Shirpur Gold Refinery Share Price';
}
public seriesRender(args: ISeriesRenderEventArgs): void {
args.series.bearFillColor = '#ff6347';
args.series.bullFillColor = '#009cb8';
}
}import { bootstrapApplication } from '@angular/platform-browser';
import { AppComponent } from './app.component';
import 'zone.js';
bootstrapApplication(AppComponent).catch((err) => console.error(err));export let candleData : Object[] = [
{ x: 'Jan', open: 120, high: 160, low: 100, close: 140 },
{ x: 'Feb', open: 150, high: 190, low: 130, close: 170 },
{ x: 'Mar', open: 130, high: 170, low: 110, close: 150 },
{ x: 'Apr', open: 160, high: 180, low: 120, close: 140 },
{ x: 'May', open: 150, high: 170, low: 110, close: 130 }
];Point render
The pointRender event allows you to customize each data point before it is rendered on the chart. The callback receives an IPointRenderEventArgs argument that exposes the current point, series, fill, and border, plus a cancel flag.
<ejs-chart (pointRender)="onPointRender($event)"></ejs-chart>import { ChartModule, CategoryService, CandleSeriesService } from '@syncfusion/ej2-angular-charts';
import { IPointRenderEventArgs } from '@syncfusion/ej2-charts';
import { Component, OnInit } from '@angular/core';
@Component({
imports: [ChartModule],
providers: [CategoryService, CandleSeriesService],
standalone: true,
selector: 'app-container',
template: `<ejs-chart id="chart-container" (pointRender)='pointRender($event)' [primaryXAxis]='primaryXAxis' [primaryYAxis]='primaryYAxis' [title]='title'>
<e-series-collection>
<e-series [dataSource]='data' type='Candle' xName='x' high='high' low='low' open='open' close='close' name='SHIRPUR-G'></e-series>
</e-series-collection>
</ejs-chart>`
})
export class AppComponent implements OnInit {
public primaryXAxis?: Object;
public title?: string;
public primaryYAxis?: Object;
public data?: Object[];
ngOnInit(): void {
this.data = [
{ x: 'Jan', open: 120, high: 160, low: 100, close: 140 },
{ x: 'Feb', open: 150, high: 190, low: 130, close: 170 },
{ x: 'Mar', open: 130, high: 170, low: 110, close: 150 },
{ x: 'Apr', open: 160, high: 180, low: 120, close: 140 },
{ x: 'May', open: 150, high: 170, low: 110, close: 130 }
];
this.primaryXAxis = {
title: 'Date',
valueType: 'Category'
};
this.primaryYAxis = {
title: 'Price',
minimum: 100,
maximum: 200,
interval: 20
};
this.title = 'Shirpur Gold Refinery Share Price';
}
public pointRender(args: IPointRenderEventArgs): void {
args.fill = '#ff6347';
}
}import { bootstrapApplication } from '@angular/platform-browser';
import { AppComponent } from './app.component';
import 'zone.js';
bootstrapApplication(AppComponent).catch((err) => console.error(err));export let candleData : Object[] = [
{ x: 'Jan', open: 120, high: 160, low: 100, close: 140 },
{ x: 'Feb', open: 150, high: 190, low: 130, close: 170 },
{ x: 'Mar', open: 130, high: 170, low: 110, close: 150 },
{ x: 'Apr', open: 160, high: 180, low: 120, close: 140 },
{ x: 'May', open: 150, high: 170, low: 110, close: 130 }
];Troubleshooting
The following symptoms map to the most common configuration issues.
-
Candles are not rendered: Confirm that
CandleSeriesServiceis registered, the seriestypeisCandle, and thatxName,high,low,open, andclosemap to fields in the data source. -
All candles use the same color: Verify that
bullFillColorandbearFillColorare set, and thatenableSolidCandlesis configured as required. -
An empty point renders as a flat zero candle: Review
emptyPointSettings.mode. UseGapto skip rendering orDropto keep subsequent candles.