Area Chart in Angular Charts
Area
Area charts are ideal for visualizing trends over time or across categories by displaying data as filled regions beneath connecting lines. They effectively show cumulative values and help compare multiple data series.
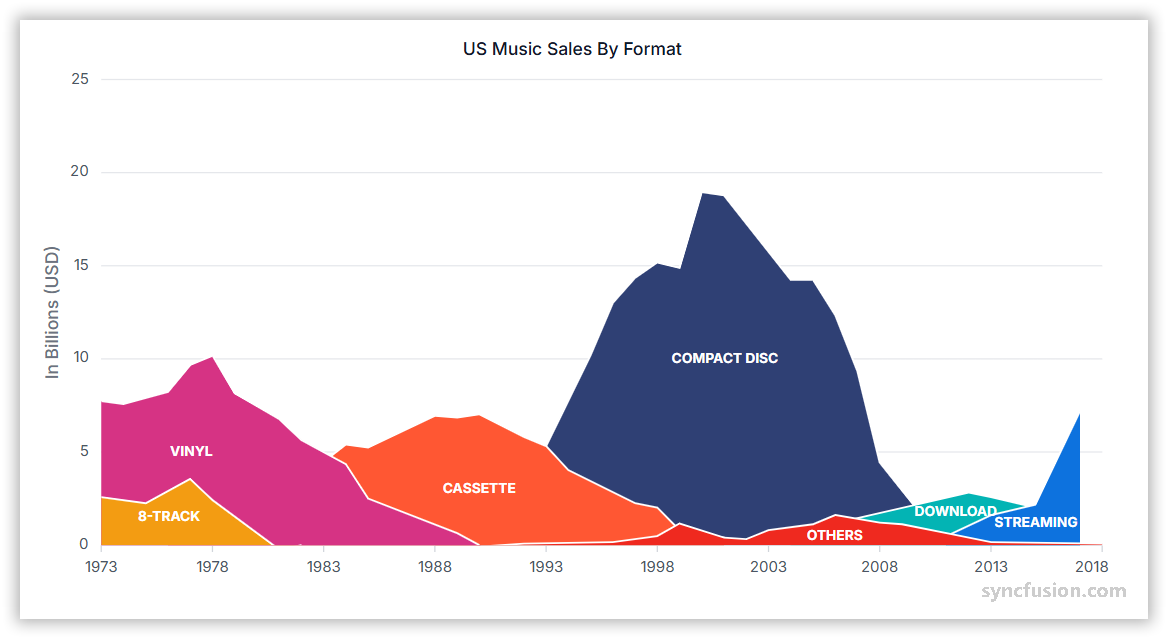
To render an area series in your chart:
-
Set the series type: Define the series
typeasAreain your chart configuration. -
Inject the AreaSeriesService provider: Use the
@NgModule.providersmethod to inject theAreaSeriesServiceprovider into your chart to enable area series functionality.
import { ChartModule, ChartAllModule } from '@syncfusion/ej2-angular-charts';
import { AreaSeriesService, TooltipService, LegendService } from '@syncfusion/ej2-angular-charts';
import { Component, OnInit } from '@angular/core';
import { energyConsumptionData } from './datasource';

@Component({
    imports: [ChartModule, ChartAllModule],
    providers: [AreaSeriesService, LegendService, TooltipService],
    standalone: true,
    selector: 'app-container',
    template: `<ejs-chart id="chart-container" [primaryXAxis]='primaryXAxis'[primaryYAxis]='primaryYAxis' [title]='title' [legendSettings]='legendSettings' [tooltip]='tooltip'>
        <e-series-collection>
            <e-series [dataSource]='chartData' type='Area' xName='year' yName='oil' name='Oil'></e-series>
            <e-series [dataSource]='chartData' type='Area' xName='year' yName='coal' name='Coal'></e-series>
        </e-series-collection>
    </ejs-chart>`
})
export class AppComponent implements OnInit {
    public primaryXAxis?: Object;
    public chartData?: Object[];
    public title?: string;
    public primaryYAxis?: Object;
    public legendSettings?: Object;
    public tooltip?: Object;
    ngOnInit(): void {
        this.chartData = energyConsumptionData;
        this.primaryXAxis = {
            minimum: 2000, maximum: 2024,
            interval: 4, edgeLabelPlacement: 'Shift'
        };
        this.primaryYAxis = {
            title: 'Energy (TWh)',
            labelFormat: '{value} TWh'
        };
        this.title = 'Global primary energy consumption by source';
        this.legendSettings = { visible: true, enableHighlight: true };
        this.tooltip = { enable: true };
    }
}
import { bootstrapApplication } from '@angular/platform-browser';
import { AppComponent } from './app.component';
import 'zone.js';
bootstrapApplication(AppComponent).catch((err) => console.error(err));export let energyConsumptionData: Object[] = [
{ year: 2000, oil: 43017, coal: 27456 },
{ year: 2001, oil: 43398, coal: 27880 },
{ year: 2002, oil: 43697, coal: 28982 },
{ year: 2003, oil: 44611, coal: 31520 },
{ year: 2004, oil: 46413, coal: 33709 },
{ year: 2005, oil: 47017, coal: 36201 },
{ year: 2006, oil: 47437, coal: 38087 },
{ year: 2007, oil: 48088, coal: 40242 },
{ year: 2008, oil: 47693, coal: 40797 },
{ year: 2009, oil: 46634, coal: 40219 },
{ year: 2010, oil: 48193, coal: 42016 },
{ year: 2011, oil: 48578, coal: 43983 },
{ year: 2012, oil: 49362, coal: 44099 },
{ year: 2013, oil: 49923, coal: 44745 },
{ year: 2014, oil: 50336, coal: 44912 },
{ year: 2015, oil: 51294, coal: 43695 },
{ year: 2016, oil: 52315, coal: 42768 },
{ year: 2017, oil: 53263, coal: 43226 },
{ year: 2018, oil: 53793, coal: 43897 },
{ year: 2019, oil: 53997, coal: 43628 },
{ year: 2020, oil: 49101, coal: 42316 },
{ year: 2021, oil: 51847, coal: 44642 },
{ year: 2022, oil: 53562, coal: 44927 },
{ year: 2023, oil: 54839, coal: 45319 },
{ year: 2024, oil: 55292, coal: 45851 }
];Data binding for area series
To display meaningful data in your area chart, connect your data source to the series. Use the dataSource property within the series configuration. This property supports JSON datasets and remote data sources. Map the data fields to the chart series using xName and yName properties to ensure proper data visualization.
import { ChartModule, ChartAllModule } from '@syncfusion/ej2-angular-charts';
import { AreaSeriesService, TooltipService, LegendService } from '@syncfusion/ej2-angular-charts';
import { Component, OnInit } from '@angular/core';
import { energyConsumptionData } from './datasource';

@Component({
    imports: [ChartModule, ChartAllModule],
    providers: [AreaSeriesService, LegendService, TooltipService],
    standalone: true,
    selector: 'app-container',
    template: `<ejs-chart id="chart-container" [primaryXAxis]='primaryXAxis'[primaryYAxis]='primaryYAxis' [title]='title' [legendSettings]='legendSettings' [tooltip]='tooltip'>
        <e-series-collection>
            <e-series [dataSource]='chartData' type='Area' xName='year' yName='oil' name='Oil'></e-series>
            <e-series [dataSource]='chartData' type='Area' xName='year' yName='coal' name='Coal'></e-series>
        </e-series-collection>
    </ejs-chart>`
})
export class AppComponent implements OnInit {
    public primaryXAxis?: Object;
    public chartData?: Object[];
    public title?: string;
    public primaryYAxis?: Object;
    public legendSettings?: Object;
    public tooltip?: Object;
    ngOnInit(): void {
        this.chartData = energyConsumptionData;
        this.primaryXAxis = {
            minimum: 2000, maximum: 2024,
            interval: 4, edgeLabelPlacement: 'Shift'
        };
        this.primaryYAxis = {
            title: 'Energy (TWh)',
            labelFormat: '{value} TWh'
        };
        this.title = 'Global primary energy consumption by source';
        this.legendSettings = { visible: true, enableHighlight: true };
        this.tooltip = { enable: true };
    }
}
import { bootstrapApplication } from '@angular/platform-browser';
import { AppComponent } from './app.component';
import 'zone.js';
bootstrapApplication(AppComponent).catch((err) => console.error(err));export let energyConsumptionData: Object[] = [
{ year: 2000, oil: 43017, coal: 27456 },
{ year: 2001, oil: 43398, coal: 27880 },
{ year: 2002, oil: 43697, coal: 28982 },
{ year: 2003, oil: 44611, coal: 31520 },
{ year: 2004, oil: 46413, coal: 33709 },
{ year: 2005, oil: 47017, coal: 36201 },
{ year: 2006, oil: 47437, coal: 38087 },
{ year: 2007, oil: 48088, coal: 40242 },
{ year: 2008, oil: 47693, coal: 40797 },
{ year: 2009, oil: 46634, coal: 40219 },
{ year: 2010, oil: 48193, coal: 42016 },
{ year: 2011, oil: 48578, coal: 43983 },
{ year: 2012, oil: 49362, coal: 44099 },
{ year: 2013, oil: 49923, coal: 44745 },
{ year: 2014, oil: 50336, coal: 44912 },
{ year: 2015, oil: 51294, coal: 43695 },
{ year: 2016, oil: 52315, coal: 42768 },
{ year: 2017, oil: 53263, coal: 43226 },
{ year: 2018, oil: 53793, coal: 43897 },
{ year: 2019, oil: 53997, coal: 43628 },
{ year: 2020, oil: 49101, coal: 42316 },
{ year: 2021, oil: 51847, coal: 44642 },
{ year: 2022, oil: 53562, coal: 44927 },
{ year: 2023, oil: 54839, coal: 45319 },
{ year: 2024, oil: 55292, coal: 45851 }
];Series customization
Customize the appearance of area series using various styling properties to match your application’s design requirements.
Solid fill
The fill property determines the color applied to the series.
import { ChartModule, ChartAllModule } from '@syncfusion/ej2-angular-charts';
import { AreaSeriesService, TooltipService, LegendService } from '@syncfusion/ej2-angular-charts';
import { Component, OnInit } from '@angular/core';
import { energyConsumptionData } from './datasource';

@Component({
    imports: [ChartModule, ChartAllModule],
    providers: [AreaSeriesService, LegendService, TooltipService],
    standalone: true,
    selector: 'app-container',
    template: `<ejs-chart id="chart-container" [primaryXAxis]='primaryXAxis'[primaryYAxis]='primaryYAxis' [title]='title' [legendSettings]='legendSettings' [tooltip]='tooltip'>
        <e-series-collection>
            <e-series [dataSource]='chartData' type='Area' xName='year' yName='oil' name='Oil' fill='#4A90A4'></e-series>
            <e-series [dataSource]='chartData' type='Area' xName='year' yName='coal' name='Coal' fill='#B8860B'></e-series>
        </e-series-collection>
    </ejs-chart>`
})
export class AppComponent implements OnInit {
    public primaryXAxis?: Object;
    public chartData?: Object[];
    public title?: string;
    public primaryYAxis?: Object;
    public legendSettings?: Object;
    public tooltip?: Object;
    ngOnInit(): void {
        this.chartData = energyConsumptionData;
        this.primaryXAxis = {
            minimum: 2000, maximum: 2024,
            interval: 4, edgeLabelPlacement: 'Shift'
        };
        this.primaryYAxis = {
            title: 'Energy (TWh)',
            labelFormat: '{value} TWh'
        };
        this.title = 'Global primary energy consumption by source';
        this.legendSettings = { visible: true, enableHighlight: true };
        this.tooltip = { enable: true };
    }
}
import { bootstrapApplication } from '@angular/platform-browser';
import { AppComponent } from './app.component';
import 'zone.js';
bootstrapApplication(AppComponent).catch((err) => console.error(err));export let energyConsumptionData: Object[] = [
{ year: 2000, oil: 43017, coal: 27456 },
{ year: 2001, oil: 43398, coal: 27880 },
{ year: 2002, oil: 43697, coal: 28982 },
{ year: 2003, oil: 44611, coal: 31520 },
{ year: 2004, oil: 46413, coal: 33709 },
{ year: 2005, oil: 47017, coal: 36201 },
{ year: 2006, oil: 47437, coal: 38087 },
{ year: 2007, oil: 48088, coal: 40242 },
{ year: 2008, oil: 47693, coal: 40797 },
{ year: 2009, oil: 46634, coal: 40219 },
{ year: 2010, oil: 48193, coal: 42016 },
{ year: 2011, oil: 48578, coal: 43983 },
{ year: 2012, oil: 49362, coal: 44099 },
{ year: 2013, oil: 49923, coal: 44745 },
{ year: 2014, oil: 50336, coal: 44912 },
{ year: 2015, oil: 51294, coal: 43695 },
{ year: 2016, oil: 52315, coal: 42768 },
{ year: 2017, oil: 53263, coal: 43226 },
{ year: 2018, oil: 53793, coal: 43897 },
{ year: 2019, oil: 53997, coal: 43628 },
{ year: 2020, oil: 49101, coal: 42316 },
{ year: 2021, oil: 51847, coal: 44642 },
{ year: 2022, oil: 53562, coal: 44927 },
{ year: 2023, oil: 54839, coal: 45319 },
{ year: 2024, oil: 55292, coal: 45851 }
];Gradient fill
The fill property can apply an SVG gradient to a area series. Define the gradient within an SVG <defs> element using a unique ID, and assign it to the series in the url(#gradientId) format. Place the following SVG element in your application’s index.html file, inside the <body> element and outside the <app-container> element.
    <svg>
        <defs>
            <linearGradient id="oilGradient" x1="0%" y1="0%" x2="0%" y2="100%">
                <stop offset="0%" style="stop-color:#2F1B14;stop-opacity:0.9" />
                <stop offset="40%" style="stop-color:#8B4513;stop-opacity:0.8" />
                <stop offset="80%" style="stop-color:#CD853F;stop-opacity:0.7" />
                <stop offset="100%" style="stop-color:#F4A460;stop-opacity:0.8" />
                </linearGradient>

            <linearGradient id="coalGradient" x1="0%" y1="0%" x2="0%" y2="100%">
                <stop offset="0%" style="stop-color:#0F0F0F;stop-opacity:0.9" />
                <stop offset="30%" style="stop-color:#2F2F2F;stop-opacity:0.8" />
                <stop offset="70%" style="stop-color:#4F4F4F;stop-opacity:0.7" />
                <stop offset="100%" style="stop-color:#696969;stop-opacity:0.8" />
            </linearGradient>
        </defs>
    </svg>
The series then references it via fill='url(#oilGradient)' and fill='url(#coalGradient)'.
import { ChartModule, ChartAllModule } from '@syncfusion/ej2-angular-charts';
import { AreaSeriesService, TooltipService, LegendService } from '@syncfusion/ej2-angular-charts';
import { Component, OnInit } from '@angular/core';
import { energyConsumptionData } from './datasource';

@Component({
    imports: [ChartModule, ChartAllModule],
    providers: [AreaSeriesService, LegendService, TooltipService],
    standalone: true,
    selector: 'app-container',
    template: `<ejs-chart id="chart-container" [primaryXAxis]='primaryXAxis'[primaryYAxis]='primaryYAxis' [title]='title' [legendSettings]='legendSettings' [tooltip]='tooltip'>
        <e-series-collection>
            <e-series [dataSource]='chartData' type='Area' xName='year' yName='oil' name='Oil' fill='url(#oilGradient)'></e-series>
            <e-series [dataSource]='chartData' type='Area' xName='year' yName='coal' name='Coal' fill='url(#coalGradient)'></e-series>
        </e-series-collection>
    </ejs-chart>`
})
export class AppComponent implements OnInit {
    public primaryXAxis?: Object;
    public chartData?: Object[];
    public title?: string;
    public primaryYAxis?: Object;
    public legendSettings?: Object;
    public tooltip?: Object;
    ngOnInit(): void {
        this.chartData = energyConsumptionData;
        this.primaryXAxis = {
            minimum: 2000, maximum: 2024,
            interval: 4, edgeLabelPlacement: 'Shift'
        };
        this.primaryYAxis = {
            title: 'Energy (TWh)',
            labelFormat: '{value} TWh'
        };
        this.title = 'Global primary energy consumption by source';
        this.legendSettings = { visible: true, enableHighlight: true };
        this.tooltip = { enable: true };
    }
}
import { bootstrapApplication } from '@angular/platform-browser';
import { AppComponent } from './app.component';
import 'zone.js';
bootstrapApplication(AppComponent).catch((err) => console.error(err));export let energyConsumptionData: Object[] = [
{ year: 2000, oil: 43017, coal: 27456 },
{ year: 2001, oil: 43398, coal: 27880 },
{ year: 2002, oil: 43697, coal: 28982 },
{ year: 2003, oil: 44611, coal: 31520 },
{ year: 2004, oil: 46413, coal: 33709 },
{ year: 2005, oil: 47017, coal: 36201 },
{ year: 2006, oil: 47437, coal: 38087 },
{ year: 2007, oil: 48088, coal: 40242 },
{ year: 2008, oil: 47693, coal: 40797 },
{ year: 2009, oil: 46634, coal: 40219 },
{ year: 2010, oil: 48193, coal: 42016 },
{ year: 2011, oil: 48578, coal: 43983 },
{ year: 2012, oil: 49362, coal: 44099 },
{ year: 2013, oil: 49923, coal: 44745 },
{ year: 2014, oil: 50336, coal: 44912 },
{ year: 2015, oil: 51294, coal: 43695 },
{ year: 2016, oil: 52315, coal: 42768 },
{ year: 2017, oil: 53263, coal: 43226 },
{ year: 2018, oil: 53793, coal: 43897 },
{ year: 2019, oil: 53997, coal: 43628 },
{ year: 2020, oil: 49101, coal: 42316 },
{ year: 2021, oil: 51847, coal: 44642 },
{ year: 2022, oil: 53562, coal: 44927 },
{ year: 2023, oil: 54839, coal: 45319 },
{ year: 2024, oil: 55292, coal: 45851 }
];Opacity
Control the transparency level of the area fill using the opacity property. Values range from 0 (completely transparent) to 1 (completely opaque). Default value is 1.
import { ChartModule, ChartAllModule } from '@syncfusion/ej2-angular-charts';
import { AreaSeriesService, TooltipService, LegendService } from '@syncfusion/ej2-angular-charts';
import { Component, OnInit } from '@angular/core';
import { energyConsumptionData } from './datasource';

@Component({
    imports: [ChartModule, ChartAllModule],
    providers: [AreaSeriesService, LegendService, TooltipService],
    standalone: true,
    selector: 'app-container',
    template: `<ejs-chart id="chart-container" [primaryXAxis]='primaryXAxis'[primaryYAxis]='primaryYAxis' [title]='title' [legendSettings]='legendSettings' [tooltip]='tooltip'>
        <e-series-collection>
            <e-series [dataSource]='chartData' type='Area' xName='year' yName='oil' name='Oil' opacity=0.5></e-series>
            <e-series [dataSource]='chartData' type='Area' xName='year' yName='coal' name='Coal' opacity=0.7></e-series>
        </e-series-collection>
    </ejs-chart>`
})
export class AppComponent implements OnInit {
    public primaryXAxis?: Object;
    public chartData?: Object[];
    public title?: string;
    public primaryYAxis?: Object;
    public legendSettings?: Object;
    public tooltip?: Object;
    ngOnInit(): void {
        this.chartData = energyConsumptionData;
        this.primaryXAxis = {
            minimum: 2000, maximum: 2024,
            interval: 4, edgeLabelPlacement: 'Shift'
        };
        this.primaryYAxis = {
            title: 'Energy (TWh)',
            labelFormat: '{value} TWh'
        };
        this.title = 'Global primary energy consumption by source';
        this.legendSettings = { visible: true, enableHighlight: true };
        this.tooltip = { enable: true };
    }
}
import { bootstrapApplication } from '@angular/platform-browser';
import { AppComponent } from './app.component';
import 'zone.js';
bootstrapApplication(AppComponent).catch((err) => console.error(err));export let energyConsumptionData: Object[] = [
{ year: 2000, oil: 43017, coal: 27456 },
{ year: 2001, oil: 43398, coal: 27880 },
{ year: 2002, oil: 43697, coal: 28982 },
{ year: 2003, oil: 44611, coal: 31520 },
{ year: 2004, oil: 46413, coal: 33709 },
{ year: 2005, oil: 47017, coal: 36201 },
{ year: 2006, oil: 47437, coal: 38087 },
{ year: 2007, oil: 48088, coal: 40242 },
{ year: 2008, oil: 47693, coal: 40797 },
{ year: 2009, oil: 46634, coal: 40219 },
{ year: 2010, oil: 48193, coal: 42016 },
{ year: 2011, oil: 48578, coal: 43983 },
{ year: 2012, oil: 49362, coal: 44099 },
{ year: 2013, oil: 49923, coal: 44745 },
{ year: 2014, oil: 50336, coal: 44912 },
{ year: 2015, oil: 51294, coal: 43695 },
{ year: 2016, oil: 52315, coal: 42768 },
{ year: 2017, oil: 53263, coal: 43226 },
{ year: 2018, oil: 53793, coal: 43897 },
{ year: 2019, oil: 53997, coal: 43628 },
{ year: 2020, oil: 49101, coal: 42316 },
{ year: 2021, oil: 51847, coal: 44642 },
{ year: 2022, oil: 53562, coal: 44927 },
{ year: 2023, oil: 54839, coal: 45319 },
{ year: 2024, oil: 55292, coal: 45851 }
];Series Border
Customize the area series border using the border property. The border object supports the following fields:
-
width- Border thickness in pixels. -
color- Border stroke color. -
dashArray- Dash pattern (e.g.'2,5'). Sets a dashed border.
Example: { width: 2, color: '#962D18', dashArray: '2,5' }.
import { ChartModule, ChartAllModule } from '@syncfusion/ej2-angular-charts';
import { AreaSeriesService, TooltipService, LegendService } from '@syncfusion/ej2-angular-charts';
import { Component, OnInit } from '@angular/core';
import { energyConsumptionData } from './datasource';

@Component({
    imports: [ChartModule, ChartAllModule],
    providers: [AreaSeriesService, LegendService, TooltipService],
    standalone: true,
    selector: 'app-container',
    template: `<ejs-chart id="chart-container" [primaryXAxis]='primaryXAxis'[primaryYAxis]='primaryYAxis' [title]='title' [legendSettings]='legendSettings' [tooltip]='tooltip'>
        <e-series-collection>
            <e-series [dataSource]='chartData' type='Area' xName='year' yName='oil' name='Oil' [border]='oilBorder'></e-series>
            <e-series [dataSource]='chartData' type='Area' xName='year' yName='coal' name='Coal' [border]='coalBorder'></e-series>
        </e-series-collection>
    </ejs-chart>`
})
export class AppComponent implements OnInit {
    public primaryXAxis?: Object;
    public chartData?: Object[];
    public title?: string;
    public primaryYAxis?: Object;
    public legendSettings?: Object;
    public tooltip?: Object;
    public oilBorder?: Object;
    public coalBorder?: Object;
    ngOnInit(): void {
        this.chartData = energyConsumptionData;
        this.primaryXAxis = {
            minimum: 2000, maximum: 2024,
            interval: 4, edgeLabelPlacement: 'Shift'
        };
        this.primaryYAxis = {
            title: 'Energy (TWh)',
            labelFormat: '{value} TWh'
        };
        this.title = 'Global primary energy consumption by source';
        this.legendSettings = { visible: true, enableHighlight: true };
        this.tooltip = { enable: true };
        this.oilBorder = { width: 2, color: '#962D18', dashArray: '2,5' };
        this.coalBorder = { width: 2, color: '#962D18', dashArray: '2,5' };
    }
}
import { bootstrapApplication } from '@angular/platform-browser';
import { AppComponent } from './app.component';
import 'zone.js';
bootstrapApplication(AppComponent).catch((err) => console.error(err));export let energyConsumptionData: Object[] = [
{ year: 2000, oil: 43017, coal: 27456 },
{ year: 2001, oil: 43398, coal: 27880 },
{ year: 2002, oil: 43697, coal: 28982 },
{ year: 2003, oil: 44611, coal: 31520 },
{ year: 2004, oil: 46413, coal: 33709 },
{ year: 2005, oil: 47017, coal: 36201 },
{ year: 2006, oil: 47437, coal: 38087 },
{ year: 2007, oil: 48088, coal: 40242 },
{ year: 2008, oil: 47693, coal: 40797 },
{ year: 2009, oil: 46634, coal: 40219 },
{ year: 2010, oil: 48193, coal: 42016 },
{ year: 2011, oil: 48578, coal: 43983 },
{ year: 2012, oil: 49362, coal: 44099 },
{ year: 2013, oil: 49923, coal: 44745 },
{ year: 2014, oil: 50336, coal: 44912 },
{ year: 2015, oil: 51294, coal: 43695 },
{ year: 2016, oil: 52315, coal: 42768 },
{ year: 2017, oil: 53263, coal: 43226 },
{ year: 2018, oil: 53793, coal: 43897 },
{ year: 2019, oil: 53997, coal: 43628 },
{ year: 2020, oil: 49101, coal: 42316 },
{ year: 2021, oil: 51847, coal: 44642 },
{ year: 2022, oil: 53562, coal: 44927 },
{ year: 2023, oil: 54839, coal: 45319 },
{ year: 2024, oil: 55292, coal: 45851 }
];Multicolored area
The multicolored area is a variant of the basic area series that allows each segment of the area to be rendered with a different color, helping to highlight specific data ranges or categories.
To render a multicolored area series:
-
Set the series type: Define the series
typeasMultiColoredArea. -
Inject the MultiColoredAreaSeriesService provider: Use the
@NgModule.providersmethod to inject theMultiColoredAreaSeriesServiceprovider. -
Configure segments: Define segments using the
segmentsproperty withChartSegmentModeloptions:
import { ChartModule, ChartAllModule } from '@syncfusion/ej2-angular-charts';
import { MultiColoredAreaSeriesService, TooltipService, LegendService } from '@syncfusion/ej2-angular-charts';
import { Component, OnInit } from '@angular/core';
import { energyConsumptionData } from './datasource';

@Component({
    imports: [ChartModule, ChartAllModule],
    providers: [MultiColoredAreaSeriesService, LegendService, TooltipService],
    standalone: true,
    selector: 'app-container',
    template: `<ejs-chart id="chart-container" [primaryXAxis]='primaryXAxis'[primaryYAxis]='primaryYAxis' [title]='title' [legendSettings]='legendSettings' [tooltip]='tooltip'>
        <e-series-collection>
            <e-series [dataSource]='chartData' type='MultiColoredArea' xName='year' yName='oil' name='Oil' segmentAxis='X' [segments]='segments'></e-series>
        </e-series-collection>
    </ejs-chart>`
})
export class AppComponent implements OnInit {
    public primaryXAxis?: Object;
    public chartData?: Object[];
    public title?: string;
    public primaryYAxis?: Object;
    public legendSettings?: Object;
    public tooltip?: Object;
    public segments?: Object[];
    ngOnInit(): void {
        this.chartData = energyConsumptionData;
        this.primaryXAxis = {
            minimum: 2000, maximum: 2024,
            interval: 4, edgeLabelPlacement: 'Shift'
        };
        this.primaryYAxis = {
            title: 'Energy (TWh)',
            labelFormat: '{value} TWh'
        };
        this.title = 'Global primary energy consumption by source';
        this.legendSettings = { visible: false, enableHighlight: true };
        this.tooltip = { enable: true };
        this.segments = [
            {
                value: 2008,
                color: '#f7a35c'
            },
            {
                value: 2016,
                color: '#7cb5ec'
            },
            {
                color: '#90ed7d'
            }
        ];
    }
}
import { bootstrapApplication } from '@angular/platform-browser';
import { AppComponent } from './app.component';
import 'zone.js';
bootstrapApplication(AppComponent).catch((err) => console.error(err));export let energyConsumptionData: Object[] = [
{ year: 2000, oil: 43017, coal: 27456 },
{ year: 2001, oil: 43398, coal: 27880 },
{ year: 2002, oil: 43697, coal: 28982 },
{ year: 2003, oil: 44611, coal: 31520 },
{ year: 2004, oil: 46413, coal: 33709 },
{ year: 2005, oil: 47017, coal: 36201 },
{ year: 2006, oil: 47437, coal: 38087 },
{ year: 2007, oil: 48088, coal: 40242 },
{ year: 2008, oil: 47693, coal: 40797 },
{ year: 2009, oil: 46634, coal: 40219 },
{ year: 2010, oil: 48193, coal: 42016 },
{ year: 2011, oil: 48578, coal: 43983 },
{ year: 2012, oil: 49362, coal: 44099 },
{ year: 2013, oil: 49923, coal: 44745 },
{ year: 2014, oil: 50336, coal: 44912 },
{ year: 2015, oil: 51294, coal: 43695 },
{ year: 2016, oil: 52315, coal: 42768 },
{ year: 2017, oil: 53263, coal: 43226 },
{ year: 2018, oil: 53793, coal: 43897 },
{ year: 2019, oil: 53997, coal: 43628 },
{ year: 2020, oil: 49101, coal: 42316 },
{ year: 2021, oil: 51847, coal: 44642 },
{ year: 2022, oil: 53562, coal: 44927 },
{ year: 2023, oil: 54839, coal: 45319 },
{ year: 2024, oil: 55292, coal: 45851 }
];Empty points
Data points with null or undefined values are considered empty points. These points are handled according to the specified mode and can be customized for better visual representation.
Mode
Use the mode property to define how empty or missing data points are handled in the series. Available values are:
-
Gap(default) - Leaves a gap at the empty point. -
Drop- Drops the empty point and connects adjacent points. -
Zero- Replaces the empty point with0. -
Average- Replaces the empty point with the average of adjacent points.
import { ChartModule, ChartAllModule } from '@syncfusion/ej2-angular-charts';
import { AreaSeriesService, TooltipService, LegendService } from '@syncfusion/ej2-angular-charts';
import { Component, OnInit } from '@angular/core';
import { energyConsumptionData } from './datasource';

@Component({
    imports: [ChartModule, ChartAllModule],
    providers: [AreaSeriesService, LegendService, TooltipService],
    standalone: true,
    selector: 'app-container',
    template: `<ejs-chart id="chart-container" [primaryXAxis]='primaryXAxis'[primaryYAxis]='primaryYAxis' [title]='title' [legendSettings]='legendSettings' [tooltip]='tooltip'>
        <e-series-collection>
            <e-series [dataSource]='chartData' type='Area' xName='year' yName='oil' name='Oil' [emptyPointSettings]='oilEmptyPointSettings'></e-series>
            <e-series [dataSource]='chartData' type='Area' xName='year' yName='coal' name='Coal' [emptyPointSettings]='coalEmptyPointSettings'></e-series>
        </e-series-collection>
    </ejs-chart>`
})
export class AppComponent implements OnInit {
    public primaryXAxis?: Object;
    public chartData?: Object[];
    public title?: string;
    public primaryYAxis?: Object;
    public legendSettings?: Object;
    public tooltip?: Object;
    public oilEmptyPointSettings?: Object;
    public coalEmptyPointSettings?: Object;
    ngOnInit(): void {
        this.chartData = energyConsumptionData;
        this.primaryXAxis = {
            minimum: 2000, maximum: 2024,
            interval: 4, edgeLabelPlacement: 'Shift'
        };
        this.primaryYAxis = {
            title: 'Energy (TWh)',
            labelFormat: '{value} TWh'
        };
        this.title = 'Global primary energy consumption by source';
        this.legendSettings = { visible: true, enableHighlight: true };
        this.tooltip = { enable: true };
        this.oilEmptyPointSettings = {
            mode: 'Gap'
        };
        this.coalEmptyPointSettings = {
            mode: 'Gap'
        };
    }
}
import { bootstrapApplication } from '@angular/platform-browser';
import { AppComponent } from './app.component';
import 'zone.js';
bootstrapApplication(AppComponent).catch((err) => console.error(err));export let energyConsumptionData: Object[] = [
{ year: 2000, oil: 43017, coal: 27456 },
{ year: 2001, oil: 43398, coal: 27880 },
{ year: 2002, oil: 43697, coal: 28982 },
{ year: 2003, oil: 44611, coal: 31520 },
{ year: 2004, oil: 46413, coal: 33709 },
{ year: 2005, oil: 47017, coal: 36201 },
{ year: 2006, oil: 47437, coal: 38087 },
{ year: 2007, oil: 48088, coal: 40242 },
{ year: 2008, oil: null, coal: null },
{ year: 2009, oil: 46634, coal: 40219 },
{ year: 2010, oil: 48193, coal: 42016 },
{ year: 2011, oil: 48578, coal: 43983 },
{ year: 2012, oil: 49362, coal: 44099 },
{ year: 2013, oil: 49923, coal: 44745 },
{ year: 2014, oil: 50336, coal: 44912 },
{ year: 2015, oil: 51294, coal: 43695 },
{ year: 2016, oil: 52315, coal: 42768 },
{ year: 2017, oil: 53263, coal: 43226 },
{ year: 2018, oil: null, coal: null },
{ year: 2019, oil: 53997, coal: 43628 },
{ year: 2020, oil: 49101, coal: 42316 },
{ year: 2021, oil: 51847, coal: 44642 },
{ year: 2022, oil: 53562, coal: 44927 },
{ year: 2023, oil: 54839, coal: 45319 },
{ year: 2024, oil: 55292, coal: 45851 }
];Empty Point Fill
Customize the fill color of empty points using the fill property to maintain visual consistency or highlight missing data. Applies when mode is Zero or Average.
import { ChartModule, ChartAllModule } from '@syncfusion/ej2-angular-charts';
import { AreaSeriesService, TooltipService, LegendService } from '@syncfusion/ej2-angular-charts';
import { Component, OnInit } from '@angular/core';
import { energyConsumptionData } from './datasource';

@Component({
    imports: [ChartModule, ChartAllModule],
    providers: [AreaSeriesService, LegendService, TooltipService],
    standalone: true,
    selector: 'app-container',
    template: `<ejs-chart id="chart-container" [primaryXAxis]='primaryXAxis'[primaryYAxis]='primaryYAxis' [title]='title' [legendSettings]='legendSettings' [tooltip]='tooltip'>
        <e-series-collection>
            <e-series [dataSource]='chartData' type='Area' xName='year' yName='oil' name='Oil' [emptyPointSettings]='oilEmptyPointSettings' [marker]='marker'></e-series>
            <e-series [dataSource]='chartData' type='Area' xName='year' yName='coal' name='Coal' [emptyPointSettings]='coalEmptyPointSettings' [marker]='marker'></e-series>
        </e-series-collection>
    </ejs-chart>`
})
export class AppComponent implements OnInit {
    public primaryXAxis?: Object;
    public chartData?: Object[];
    public title?: string;
    public primaryYAxis?: Object;
    public legendSettings?: Object;
    public tooltip?: Object;
    public oilEmptyPointSettings?: Object;
    public coalEmptyPointSettings?: Object;
    public marker?: Object;
    ngOnInit(): void {
        this.chartData = energyConsumptionData;
        this.primaryXAxis = {
            minimum: 2000, maximum: 2024,
            interval: 4, edgeLabelPlacement: 'Shift'
        };
        this.primaryYAxis = {
            title: 'Energy (TWh)',
            labelFormat: '{value} TWh'
        };
        this.title = 'Global primary energy consumption by source';
        this.legendSettings = { visible: true, enableHighlight: true };
        this.tooltip = { enable: true };
        this.oilEmptyPointSettings = {
            mode: 'Average',
            fill: 'red'
        };
        this.coalEmptyPointSettings = {
            mode: 'Gap'
        };
        this.marker= { visible: true, width: 5, height: 5, isFilled: true };
    }
}
import { bootstrapApplication } from '@angular/platform-browser';
import { AppComponent } from './app.component';
import 'zone.js';
bootstrapApplication(AppComponent).catch((err) => console.error(err));export let energyConsumptionData: Object[] = [
{ year: 2000, oil: 43017, coal: 27456 },
{ year: 2001, oil: 43398, coal: 27880 },
{ year: 2002, oil: 43697, coal: 28982 },
{ year: 2003, oil: 44611, coal: 31520 },
{ year: 2004, oil: 46413, coal: 33709 },
{ year: 2005, oil: 47017, coal: 36201 },
{ year: 2006, oil: 47437, coal: 38087 },
{ year: 2007, oil: 48088, coal: 40242 },
{ year: 2008, oil: null, coal: null },
{ year: 2009, oil: 46634, coal: 40219 },
{ year: 2010, oil: 48193, coal: 42016 },
{ year: 2011, oil: 48578, coal: 43983 },
{ year: 2012, oil: 49362, coal: 44099 },
{ year: 2013, oil: 49923, coal: 44745 },
{ year: 2014, oil: 50336, coal: 44912 },
{ year: 2015, oil: 51294, coal: 43695 },
{ year: 2016, oil: 52315, coal: 42768 },
{ year: 2017, oil: 53263, coal: 43226 },
{ year: 2018, oil: null, coal: null },
{ year: 2019, oil: 53997, coal: 43628 },
{ year: 2020, oil: 49101, coal: 42316 },
{ year: 2021, oil: 51847, coal: 44642 },
{ year: 2022, oil: 53562, coal: 44927 },
{ year: 2023, oil: 54839, coal: 45319 },
{ year: 2024, oil: 55292, coal: 45851 }
];Empty Point Border
Customize the border appearance of empty points using the border property to adjust width and color. Applies when mode is Zero or Average.
import { ChartModule, ChartAllModule } from '@syncfusion/ej2-angular-charts';
import { AreaSeriesService, TooltipService, LegendService } from '@syncfusion/ej2-angular-charts';
import { Component, OnInit } from '@angular/core';
import { energyConsumptionData } from './datasource';

@Component({
    imports: [ChartModule, ChartAllModule],
    providers: [AreaSeriesService, LegendService, TooltipService],
    standalone: true,
    selector: 'app-container',
    template: `<ejs-chart id="chart-container" [primaryXAxis]='primaryXAxis'[primaryYAxis]='primaryYAxis' [title]='title' [legendSettings]='legendSettings' [tooltip]='tooltip'>
        <e-series-collection>
            <e-series [dataSource]='chartData' type='Area' xName='year' yName='oil' name='Oil' [emptyPointSettings]='oilEmptyPointSettings' [marker]='marker'></e-series>
            <e-series [dataSource]='chartData' type='Area' xName='year' yName='coal' name='Coal' [emptyPointSettings]='coalEmptyPointSettings' [marker]='marker'></e-series>
        </e-series-collection>
    </ejs-chart>`
})
export class AppComponent implements OnInit {
    public primaryXAxis?: Object;
    public chartData?: Object[];
    public title?: string;
    public primaryYAxis?: Object;
    public legendSettings?: Object;
    public tooltip?: Object;
    public oilEmptyPointSettings?: Object;
    public coalEmptyPointSettings?: Object;
    public marker?: Object;
    ngOnInit(): void {
        this.chartData = energyConsumptionData;
        this.primaryXAxis = {
            minimum: 2000, maximum: 2024,
            interval: 4, edgeLabelPlacement: 'Shift'
        };
        this.primaryYAxis = {
            title: 'Energy (TWh)',
            labelFormat: '{value} TWh'
        };
        this.title = 'Global primary energy consumption by source';
        this.legendSettings = { visible: true, enableHighlight: true };
        this.tooltip = { enable: true };
        this.oilEmptyPointSettings = {
            mode: 'Average',
            fill: 'red',
            border: { width: 2, color: 'green' }
        };
        this.coalEmptyPointSettings = {
            mode: 'Gap'
        };
        this.marker= { visible: true, width: 6, height: 6, isFilled: true };
    }
}
import { bootstrapApplication } from '@angular/platform-browser';
import { AppComponent } from './app.component';
import 'zone.js';
bootstrapApplication(AppComponent).catch((err) => console.error(err));export let energyConsumptionData: Object[] = [
{ year: 2000, oil: 43017, coal: 27456 },
{ year: 2001, oil: 43398, coal: 27880 },
{ year: 2002, oil: 43697, coal: 28982 },
{ year: 2003, oil: 44611, coal: 31520 },
{ year: 2004, oil: 46413, coal: 33709 },
{ year: 2005, oil: 47017, coal: 36201 },
{ year: 2006, oil: 47437, coal: 38087 },
{ year: 2007, oil: 48088, coal: 40242 },
{ year: 2008, oil: null, coal: null },
{ year: 2009, oil: 46634, coal: 40219 },
{ year: 2010, oil: 48193, coal: 42016 },
{ year: 2011, oil: 48578, coal: 43983 },
{ year: 2012, oil: 49362, coal: 44099 },
{ year: 2013, oil: 49923, coal: 44745 },
{ year: 2014, oil: 50336, coal: 44912 },
{ year: 2015, oil: 51294, coal: 43695 },
{ year: 2016, oil: 52315, coal: 42768 },
{ year: 2017, oil: 53263, coal: 43226 },
{ year: 2018, oil: null, coal: null },
{ year: 2019, oil: 53997, coal: 43628 },
{ year: 2020, oil: 49101, coal: 42316 },
{ year: 2021, oil: 51847, coal: 44642 },
{ year: 2022, oil: 53562, coal: 44927 },
{ year: 2023, oil: 54839, coal: 45319 },
{ year: 2024, oil: 55292, coal: 45851 }
];Events
Series render
The seriesRender event allows customization of series properties, such as data, fill, and name, before rendering on the chart.
import { ChartModule, ChartAllModule } from '@syncfusion/ej2-angular-charts';
import { AreaSeriesService, TooltipService, LegendService } from '@syncfusion/ej2-angular-charts';
import { ISeriesRenderEventArgs } from '@syncfusion/ej2-charts';
import { Component, OnInit } from '@angular/core';
import { energyConsumptionData } from './datasource';

@Component({
    imports: [ChartModule, ChartAllModule],
    providers: [AreaSeriesService, LegendService, TooltipService],
    standalone: true,
    selector: 'app-container',
    template: `<ejs-chart id="chart-container" [primaryXAxis]='primaryXAxis'[primaryYAxis]='primaryYAxis' [title]='title' [legendSettings]='legendSettings' [tooltip]='tooltip' (seriesRender)='seriesRender($event)'>
        <e-series-collection>
            <e-series [dataSource]='chartData' type='Area' xName='year' yName='oil' name='Oil'></e-series>
            <e-series [dataSource]='chartData' type='Area' xName='year' yName='coal' name='Coal'></e-series>
        </e-series-collection>
    </ejs-chart>`
})
export class AppComponent implements OnInit {
    public primaryXAxis?: Object;
    public chartData?: Object[];
    public title?: string;
    public primaryYAxis?: Object;
    public legendSettings?: Object;
    public tooltip?: Object;
    ngOnInit(): void {
        this.chartData = energyConsumptionData;
        this.primaryXAxis = {
            minimum: 2000, maximum: 2024,
            interval: 4, edgeLabelPlacement: 'Shift'
        };
        this.primaryYAxis = {
            title: 'Energy (TWh)',
            labelFormat: '{value} TWh'
        };
        this.title = 'Global primary energy consumption by source';
        this.legendSettings = { visible: true, enableHighlight: true };
        this.tooltip = { enable: true };
    }
    public seriesRender(args: ISeriesRenderEventArgs): void {
        if (args.series.name === 'Oil') {
            args.fill = '#2E8B57';
        } else if (args.series.name === 'Coal') {
            args.fill = '#4B0082';
        }
    };
}
import { bootstrapApplication } from '@angular/platform-browser';
import { AppComponent } from './app.component';
import 'zone.js';
bootstrapApplication(AppComponent).catch((err) => console.error(err));export let energyConsumptionData: Object[] = [
{ year: 2000, oil: 43017, coal: 27456 },
{ year: 2001, oil: 43398, coal: 27880 },
{ year: 2002, oil: 43697, coal: 28982 },
{ year: 2003, oil: 44611, coal: 31520 },
{ year: 2004, oil: 46413, coal: 33709 },
{ year: 2005, oil: 47017, coal: 36201 },
{ year: 2006, oil: 47437, coal: 38087 },
{ year: 2007, oil: 48088, coal: 40242 },
{ year: 2008, oil: 47693, coal: 40797 },
{ year: 2009, oil: 46634, coal: 40219 },
{ year: 2010, oil: 48193, coal: 42016 },
{ year: 2011, oil: 48578, coal: 43983 },
{ year: 2012, oil: 49362, coal: 44099 },
{ year: 2013, oil: 49923, coal: 44745 },
{ year: 2014, oil: 50336, coal: 44912 },
{ year: 2015, oil: 51294, coal: 43695 },
{ year: 2016, oil: 52315, coal: 42768 },
{ year: 2017, oil: 53263, coal: 43226 },
{ year: 2018, oil: 53793, coal: 43897 },
{ year: 2019, oil: 53997, coal: 43628 },
{ year: 2020, oil: 49101, coal: 42316 },
{ year: 2021, oil: 51847, coal: 44642 },
{ year: 2022, oil: 53562, coal: 44927 },
{ year: 2023, oil: 54839, coal: 45319 },
{ year: 2024, oil: 55292, coal: 45851 }
];Point render
The pointRender event allows customization of each data point before rendering on the chart.
import { ChartModule, ChartAllModule } from '@syncfusion/ej2-angular-charts';
import { AreaSeriesService, TooltipService, LegendService } from '@syncfusion/ej2-angular-charts';
import { IPointRenderEventArgs } from '@syncfusion/ej2-charts';
import { Component, OnInit } from '@angular/core';
import { energyConsumptionData } from './datasource';

@Component({
    imports: [ChartModule, ChartAllModule],
    providers: [AreaSeriesService, LegendService, TooltipService],
    standalone: true,
    selector: 'app-container',
    template: `<ejs-chart id="chart-container" [primaryXAxis]='primaryXAxis'[primaryYAxis]='primaryYAxis' [title]='title' [legendSettings]='legendSettings' [tooltip]='tooltip' (pointRender)='pointRender($event)'>
        <e-series-collection>
            <e-series [dataSource]='chartData' type='Area' xName='year' yName='oil' name='Oil' [marker]='marker' opacity='0.5'></e-series>
            <e-series [dataSource]='chartData' type='Area' xName='year' yName='coal' name='Coal' [marker]='marker' opacity='0.5'></e-series>
        </e-series-collection>
    </ejs-chart>`
})
export class AppComponent implements OnInit {
    public primaryXAxis?: Object;
    public chartData?: Object[];
    public title?: string;
    public primaryYAxis?: Object;
    public legendSettings?: Object;
    public tooltip?: Object;
    public marker?: Object;
    ngOnInit(): void {
        this.chartData = energyConsumptionData;
        this.primaryXAxis = {
            minimum: 2000, maximum: 2024,
            interval: 4, edgeLabelPlacement: 'Shift'
        };
        this.primaryYAxis = {
            title: 'Energy (TWh)',
            labelFormat: '{value} TWh'
        };
        this.title = 'Global primary energy consumption by source';
        this.legendSettings = { visible: true, enableHighlight: true };
        this.tooltip = { enable: true };
        this.marker = { visible: true, width: 8, height: 8 };
    }
    public pointRender(args: IPointRenderEventArgs): void {
        if (args.point.index % 2 !== 0) {
            args.fill = '#2E8B57';
        } else {
            args.fill = '#4B0082';
        }
    };
}
import { bootstrapApplication } from '@angular/platform-browser';
import { AppComponent } from './app.component';
import 'zone.js';
bootstrapApplication(AppComponent).catch((err) => console.error(err));export let energyConsumptionData: Object[] = [
{ year: 2000, oil: 43017, coal: 27456 },
{ year: 2001, oil: 43398, coal: 27880 },
{ year: 2002, oil: 43697, coal: 28982 },
{ year: 2003, oil: 44611, coal: 31520 },
{ year: 2004, oil: 46413, coal: 33709 },
{ year: 2005, oil: 47017, coal: 36201 },
{ year: 2006, oil: 47437, coal: 38087 },
{ year: 2007, oil: 48088, coal: 40242 },
{ year: 2008, oil: 47693, coal: 40797 },
{ year: 2009, oil: 46634, coal: 40219 },
{ year: 2010, oil: 48193, coal: 42016 },
{ year: 2011, oil: 48578, coal: 43983 },
{ year: 2012, oil: 49362, coal: 44099 },
{ year: 2013, oil: 49923, coal: 44745 },
{ year: 2014, oil: 50336, coal: 44912 },
{ year: 2015, oil: 51294, coal: 43695 },
{ year: 2016, oil: 52315, coal: 42768 },
{ year: 2017, oil: 53263, coal: 43226 },
{ year: 2018, oil: 53793, coal: 43897 },
{ year: 2019, oil: 53997, coal: 43628 },
{ year: 2020, oil: 49101, coal: 42316 },
{ year: 2021, oil: 51847, coal: 44642 },
{ year: 2022, oil: 53562, coal: 44927 },
{ year: 2023, oil: 54839, coal: 45319 },
{ year: 2024, oil: 55292, coal: 45851 }
];Troubleshooting
- Ensure
AreaSeriesServiceis registered in the providers; otherwise the area series will not render. -
Gradient fill renders as solid color: the SVG gradient referenced by
fill='url(#id)'is not defined. Add a matching<linearGradient>(or<radialGradient>) inside a<defs>block in the chart template, or in a global stylesheet. - If
MultiColoredAreasegments are not visible, verify each segment’svalueis monotonically increasing and matches an x-value in the data. Confirm thatsegmentAxis(XorY) matches the axis of thevaluefield. - Empty-point customization (
fill/border) only takes effect whenmodeisZeroorAverage. ForGapandDrop, no marker/fill is drawn.