Series Overview in Angular Chart
What is a series?
A series represents a set of related data points visualized together on a chart. Each series is plotted using a specific rendering type, such as Line, Column, Area, Spline, or Scatter.
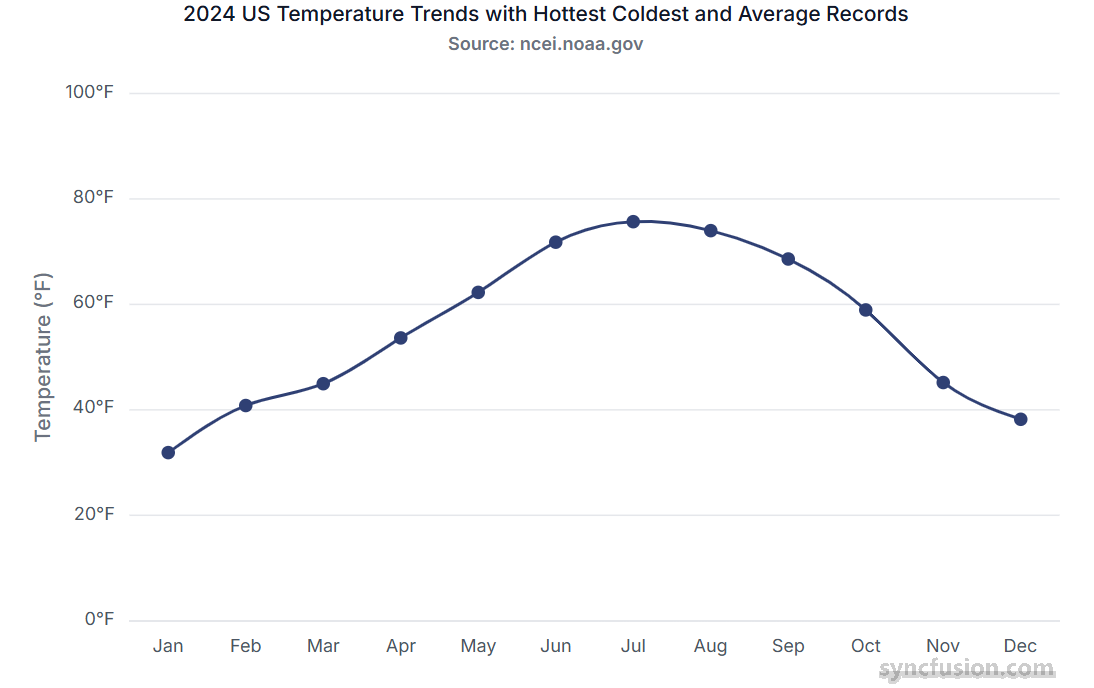
Single series
A single series refers to a chart that displays only one set of data points. It represents one continuous dataset plotted on the chart, allowing you to visualize trends or values from a single source of data.
Multiple series
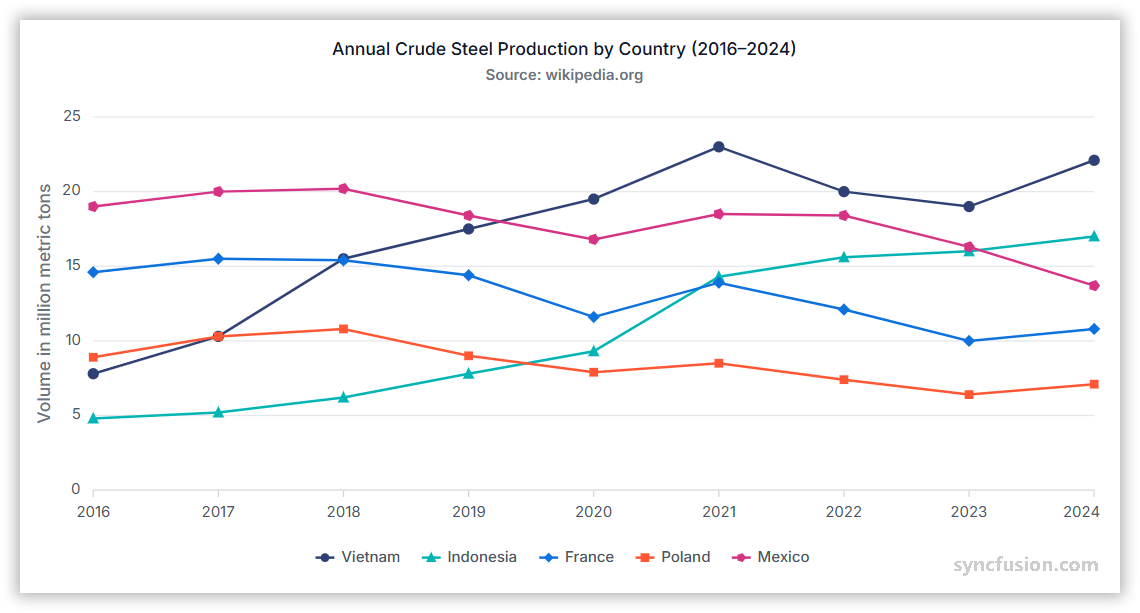
A multiple series chart displays two or more datasets together, allowing you to compare trends or values across different series.
Binding data with series
You can bind data to the chart using the dataSource property within the series configuration. This allows you to connect a JSON dataset or remote data to your chart. To display the data correctly, map the fields from the data to the chart series xName and yName properties.
import { ChartModule, LineSeriesService } from '@syncfusion/ej2-angular-charts';
import { Component, OnInit } from '@angular/core';
import { lineData } from './datasource';

@Component({
    imports: [ChartModule],
    providers: [LineSeriesService],
    standalone: true,
    selector: 'app-container',
    template: `<ejs-chart id="chart-container" [primaryXAxis]='primaryXAxis' [primaryYAxis]='primaryYAxis' [title]='title'>
        <e-series-collection>
            <e-series [dataSource]='chartData' type='Line' xName='x' yName='y'></e-series>
        </e-series-collection>
    </ejs-chart>`
})
export class AppComponent implements OnInit {
    public chartData?: Object[];
    public title?: string;
    public primaryXAxis?: Object;
    public primaryYAxis?: Object;
    ngOnInit(): void {
        this.chartData = lineData;
        this.primaryXAxis = {
            interval: 1
        };
        this.primaryYAxis = {
            title: 'Expense'
        };
        this.title = 'Efficiency of oil-fired power production';
    }
}
import { bootstrapApplication } from '@angular/platform-browser';
import { AppComponent } from './app.component';
import 'zone.js';
bootstrapApplication(AppComponent).catch((err) => console.error(err));export let lineData: Object[] = [
{ x: 2005, y: 28 },
{ x: 2006, y: 25 },
{ x: 2007, y: 26 },
{ x: 2008, y: 27 },
{ x: 2009, y: 32 },
{ x: 2010, y: 35 },
{ x: 2011, y: 30 }
];Common series properties
| Property | Description |
|---|---|
| type | Series rendering type: Line, Column, Area, Bar, Spline, Scatter, etc. |
| dataSource | Array or remote data source bound to the series. |
| xName | Field name in the data source used for X-axis values. |
| yName | Field name in the data source used for Y-axis values. |
| name | Series label shown in the legend and tooltips. |
| visible | Determines whether the series is displayed on the chart. |
| fill | Fill color or gradient for the series. |
| width | Stroke width for line-type series. |
| marker | Object configuring data point markers (visibility, size, shape, fill). |
| opacity | Series transparency (0.0 - 1.0). |
| dashArray | Dash pattern for stroke lines (for example: "5,3"). |
| animation | Animation options (enable, duration, delay) for series rendering. |
| enableTooltip | Enable or disable tooltip for the series points. |
| columnSpacing | Spacing between bars/columns for Column/Bar series. |
| columnWidth | Width of columns/bars (fractional value 0-1 or pixel value). |
| border | Border settings (color, width) for Area, Column, and Bar series. |
| legendShape | Shape/icon used in the legend for the series. |
| emptyPointSettings | How to render empty/null points (gap, zero, average, etc.). |
| errorBar | Configuration to render error bars for each point. |
| trendlines | Add trendlines (Linear, Polynomial, Moving Average, etc.). |
| dataLabel | Configuration object for displaying the value of each data point directly on the chart. |
Troubleshooting
The following symptoms map to the most common configuration issues.
-
Series does not render: Confirm that the series service (for example,
LineSeriesService) is registered in the componentprovidersarray and that the seriestypeis valid. -
Data points are missing: Verify that the fields referenced by
xNameandyNameexist on every record and that the bound array is not empty. -
Legend does not show a label: Confirm that the
nameproperty is set on each<e-series>element. -
Series renders on top of another axis unexpectedly: Verify that the data values fall within the configured
minimumandmaximumof the boundprimaryXAxisorprimaryYAxis.