Getting Started
6 Dec 20174 minutes to read
This section explains you the steps required to populate the Sparkline with data, tooltips and type for Sparkline. This section covers only the minimal features that you need to know to get started with the Sparkline.
Create Sparkline
You can easily create the Sparkline widget by following the below steps.
1.To create Syncfusion Aurelia application refer [Aurelia Getting Started documentation](https://help.syncfusion.com/aurelia/overview#getting-started “”).
2.Create sparkline folder inside src/samples location.
3.Create sparkline.html file inside src/samples/sparkline folder and use the below code for rendering BulletGraph component
4.Create a <div> tag.
<!DOCTYPE html>
<body>
<template>
<div>
     <ej-sparkline id="sparkline">
        </ej-sparkline>
        </div>
</template>
</body>
</html>
5.Create sparkline.js file inside src/samples/sparkline folder with below code snippet.
export class Sparkline {
    constructor() {}
    }
Now, the Sparkline is rendered with some auto-generated random values and with default Line type Sparkline.

Simple Sparkline
The Sparkline is rendered to it’s default size. You can also customize the Sparkline dimension either by setting the width and height of the container element as in the above code example or by using the size of the Sparkline.
Populate Sparkline with data
Now, this section explains how to plot JSON data to the Sparkline. First, let us prepare a sample JSON data with each object containing following fields – employeeId and sales.
export class BasicUse {
constructor() {

this.sparkLineData = [
{ employeeId: 1, sales: 25 },
{ employeeId: 2, sales: 28 },
{ employeeId: 3, sales: 34 },
{ employeeId: 4, sales: 32 },
{ employeeId: 5, sales: 40 },
{ employeeId: 6, sales: 32 },
{ employeeId: 7, sales: 35 },
{ employeeId: 8, sales: 55 },
{ employeeId: 9, sales: 38 },
{ employeeId: 10, sales: 30 }];
}
}
Now, add the dataSource to the Sparkline and provide the field name to get the values from the dataSource in xName and yName options.
<!DOCTYPE html>
<body>
<template>
<div>
     <ej-sparkline id="sparkline" e-data-source.bind="sparkLineData" e-x-name="employeeId" e-y-name="sales">
        </ej-sparkline>
        </div>
</template>
</body>
</html>
Sparkline Type
To change the sparkline types, following example code illustrates this.
export class Sparkline {
    constructor() {}
}<!DOCTYPE html>
<body>
<template>
<div>
<ej-sparkline id="sparkline" e-data-source.bind="sparklinedata" e-x-name="employeeId" e-y-name="sales">
</ej-sparkline>
</div>
</template>
</body>
</html>Enable Tooltip
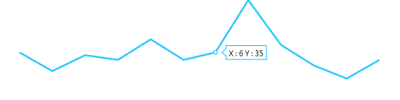
To enable the Sparkline tooltip we can see the current point values.
The following code example illustrates enable tooltip in sparkline,
export class Sparkline {
    constructor() {
           this.tooltip = {visible: true, font: { size: '12px'}};
    }
}<!DOCTYPE html>
<body>
<template>
<div>
<ej-sparkline id="sparkline" e-tooltip.bind="tooltip">
</ej-sparkline>
</div>
</template>
</body>
</html>