How can I help you?
Getting started
Important
Starting with v16.2.0.x, if you refer to Syncfusion assemblies from trial setup or from the NuGet feed, include a license key in your projects. Refer to this link to learn about registering Syncfusion license key in your ASP.NET Core application to use our components.
Creating a simple application with pivot chart and relational data source (client mode)
This section covers the information required to populate a simple pivot chart with relational data completely on the client-side.
Project initialization
Create a new ASP.NET Empty Web Application by using the Visual Studio IDE and name the project “PivotChartDemo”.
Now, add a Web Form to the empty web application. For adding a Web Form, right-click the project in the solution explorer and select Add > New Item. In the Add New Item window, select Web Form and name it Default.aspx, and then click Add.
Add the following dependency libraries as references to your web application. To add them to your application, right-click References in the solution explorer and select Add Reference. In the Reference Manager dialog, under Assemblies > Extension, the following Syncfusion libraries will be found.
- Syncfusion.EJ
- Syncfusion.EJ.Export
- Syncfusion.EJ.Pivot
Register the referred assemblies in Web.config files available at the root of the application.
<compilation debug="true" targetFramework="4.5">
    <assemblies>
        ……
        ……
        <add assembly="Syncfusion.EJ, Version= 33.1450.44, Culture=neutral, PublicKeyToken=3d67ed1f87d44c89" />
        <add assembly="Syncfusion.EJ.Pivot, Version= 33.1450.44, Culture=neutral, PublicKeyToken=3d67ed1f87d44c89" />
        <add assembly="Syncfusion.EJ.Export, Version= 33.1450.44, Culture=neutral, PublicKeyToken=3d67ed1f87d44c89" />
    </assemblies>
</compilation>
Scripts and CSS initialization
The scripts and style sheets that are required to render the pivot chart control in web application are mentioned below in an appropriate order:
- ej.web.all.min.css
- jQuery-3.0.0.min.js
- ej.web.all.min.js
Click here here to know more about scripts and style sheets available in online (CDN link).
Scripts and style sheets are referred under the <head> tag in the Default.aspx file.
<head>
    <link href="http://cdn.syncfusion.com/33.1.44/js/web/flat-azure/ej.web.all.min.css" rel="stylesheet" type="text/css" />
    <script src="http://cdn.syncfusion.com/js/assets/external/jquery-3.0.0.min.js" type="text/javascript"></script>
    <script src="http://cdn.syncfusion.com/33.1.44/js/web/ej.web.all.min.js" type="text/javascript"></script>
</head>
Initialize pivot chart
You can drag and drop the pivot chart control from the toolbox (under Syncfusion BI Web category) or manually define the control as shown in the following code sample of the “Default.aspx” page.
<%@ Register Assembly="Syncfusion.EJ.Pivot" Namespace="Syncfusion.JavaScript.Web" TagPrefix="ej" %>
<%@ Register Assembly="Syncfusion.EJ.Pivot" Namespace="Syncfusion.JavaScript.Models" TagPrefix="ej" %>

<html>
<head>
.....
.....
<style>
    #MyPivotChart1 {
        width:100%;
        height:460px;
    }
</style>
</head>
<body>
    <form runat="server">
        <ej:PivotChart ID="MyPivotChart1" runat="server" ClientIDMode="Static">
        <Size Width="100%" Height="460px"></Size>
        </ej:PivotChart>
        <asp:ScriptManager ID="ScriptManager1" runat="server"></asp:ScriptManager>
    </form>
</body>

</html>
Populate pivot chart with data
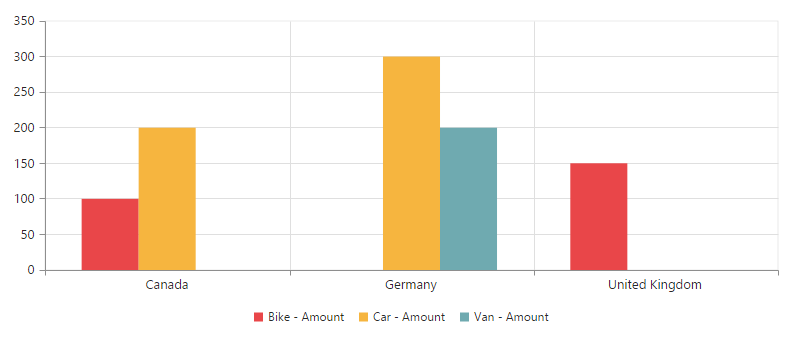
This section illustrates how to populate the pivot chart control by using a sample JSON data as shown below:
<html>
    <body>
        <form id="form1" runat="server">
            <ej:PivotChart ID="MyPivotChart1" runat="server" ClientIDMode="Static">
                <ClientSideEvents Load="onLoad" />
                <Size Width="100%" Height="460px"></Size>
            </ej:PivotChart>
            <asp:ScriptManager ID="ScriptManager1" runat="server"></asp:ScriptManager>
            <script type="text/javascript">
                function onLoad(args) {
                    args.model.dataSource.data = [
                        { Amount: 100, Country: "Canada", Product: "Bike" },
                        { Amount: 200, Country: "Germany", Product: "Van" },
                        { Amount: 300, Country: "Germany", Product: "Car" },
                        { Amount: 150, Country: "United Kingdom", Product: "Bike" },
                        { Amount: 200, Country: "Canada", Product: "Car" }
                    ]
                }
            </script>
        </form>
    </body>
</html>
The JSON data is set to the “Data” property present in the “DataSource” object. The “DataSource” object allows you to set both data source and fields that should be displayed in the row, column, value, and filter section of the pivot chart control.
<!DOCTYPE html>
<html>

    //....
    <body>
        <form id="form1" runat="server">
            <ej:PivotChart ID="MyPivotChart1" runat="server" ClientIDMode="Static">
                <DataSource>
                <Rows>
                    <ej:Field FieldName="Country" FieldCaption="Country"></ej:Field>
                </Rows>
                <Columns>
                    <ej:Field FieldName="Product" FieldCaption="Product"></ej:Field>
                </Columns>
                <Values>
                    <ej:Field FieldName="Amount" FieldCaption="Amount"></ej:Field>
                </Values>
                </DataSource>
                <ClientSideEvents Load="onLoad" />
                <Size Width="100%" Height="460px"></Size>
            </ej:PivotChart>
            <asp:ScriptManager ID="ScriptManager1" runat="server"></asp:ScriptManager>
            <script type="text/javascript">
                function onLoad(args) {
                    args.model.dataSource.data = [
                        { Amount: 100, Country: "Canada", Product: "Bike" },
                        { Amount: 200, Country: "Germany", Product: "Van" },
                        { Amount: 300, Country: "Germany", Product: "Car" },
                        { Amount: 150, Country: "United Kingdom", Product: "Bike" },
                        { Amount: 200, Country: "Canada", Product: "Car" }
                    ]
                }
            </script>
        </form>
    </body>
</html>
Now, the pivot chart will be rendered with amount over a set of products across different customer geographic locations.
Apply sorting
You can sort a field to ascending or descending order by using the SortOrder property. Sorting is applicable only for the row and column fields.
NOTE
By default, fields are arranged in ascending order.
<ej:PivotChart ID="MyPivotChart1" runat="server" ClientIDMode="Static">
<DataSource>
    <Rows>
        <ej:Field FieldName="Country" FieldCaption="Country" SortOrder="Descending"></ej:Field>
    </Rows>
    <Columns>
        <ej:Field FieldName="Product" FieldCaption="Product"></ej:Field>
    </Columns>
    <Values>
        <ej:Field FieldName="Amount" FieldCaption="Amount"></ej:Field>
    </Values>
</DataSource>
<ClientSideEvents Load="onLoad" />
<Size Width="100%" Height="460px"></Size>
</ej:PivotChart>
<asp:ScriptManager ID="ScriptManager1" runat="server"></asp:ScriptManager>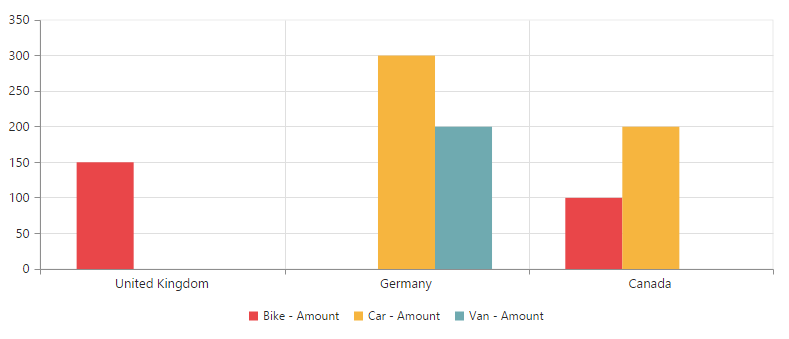
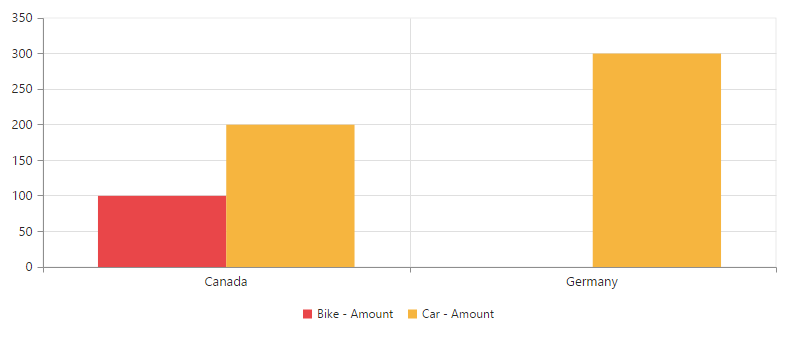
Apply filtering
The filtering option allows you to display or hide a set of values. This option is applicable only for row, column, and filter areas.
“FilterItems” object allow you to apply filtering to the fields by using the following properties:
- FilterType: Indicates whether the values should be included or excluded.
- Values: Contains an array of values that should be included or excluded within the particular field.
<ej:PivotChart ID="MyPivotChart1" runat="server" ClientIDMode="Static">
    <DataSource>
        <Rows>
            <ej:Field FieldName="Country" FieldCaption="Country">
                <FilterItems FilterType="Exclude"/>
            </ej:Field>
        </Rows>
        <Columns>
            <ej:Field FieldName="Product" FieldCaption="Product">
                <FilterItems FilterType="Include" />
            </ej:Field>
        </Columns>
        <Values>
            <ej:Field FieldName="Amount" FieldCaption="Amount"></ej:Field>
        </Values>
    </DataSource>
    <ClientSideEvents Load="onLoad" />
    <Size Width="100%" Height="460px"></Size>
</ej:PivotChart>
<asp:ScriptManager ID="ScriptManager1" runat="server"></asp:ScriptManager>
The values for filtering are given in the Default.aspx.cs as shown in the following snippet:
protected void Page_Load(object sender, EventArgs e)
{
    this.MyPivotChart1.Model.DataSource.Rows[0].FilterItems.Values = new List<string>() { "United Kingdom" };
    this.MyPivotChart1.Model.DataSource.Columns[0].FilterItems.Values = new List<string>() { "Bike", "Car" };
}
Creating a simple application with pivot chart and relational data sources (server mode)
This section covers the information required to create a simple pivot chart bound to the relational data source.
NOTE
ASP.NET Web Application contains a service that will transfer the data to server-side, process it, and return it to client-side for control rendering and re-rendering. The service utilized for communication can be either WCF or WebAPI based on user requirement.
Project initialization
Create a new ASP.NET Empty Web Application by using the Visual Studio IDE and name the project “PivotChartDemo”.
Now, add a Web Form to the empty web application. For adding a Web Form, right-click the project in the solution explorer and select Add > New Item. In the Add New Item window, select Web Form and name it Default.aspx, and then click Add.
Add the following dependency libraries as references to your web application. To add them to your application, right-click References in the solution explorer and select Add Reference. In the Reference Manager dialog, under Assemblies > Extension, the following Syncfusion libraries will be found.
NOTE
If you have installed any version of Essential Studio, then the location of Syncfusion libraries is [system drive:\Program Files (x86)\Syncfusion\Essential Studio\33.1.44\Assemblies].
- Syncfusion.Compression.Base
- Syncfusion.Linq.Base
- Syncfusion.Olap.Base
- Syncfusion.PivotAnalysis.Base
- Syncfusion.XlsIO.Base
- Syncfusion.Pdf.Base
- Syncfusion.DocIO.Base
- Syncfusion.EJ
- Syncfusion.EJ.Web
- Syncfusion.EJ.Export
- Syncfusion.EJ.Pivot
Register the referred assemblies in Web.config files available at the root of the application.
<compilation debug="true" targetFramework="4.5">
    <assemblies>
        ……
        ……
    <add assembly="Syncfusion.EJ, Version= 33.1450.44, Culture=neutral, PublicKeyToken=3d67ed1f87d44c89" />
    <add assembly="Syncfusion.EJ.Pivot, Version= 33.1450.44, Culture=neutral, PublicKeyToken=3d67ed1f87d44c89" />
    <add assembly="Syncfusion.EJ.Export, Version= 33.1450.44, Culture=neutral, PublicKeyToken=3d67ed1f87d44c89" />
    <add assembly="Syncfusion.EJ.Web, Version= 33.1450.44, Culture=neutral, PublicKeyToken=3d67ed1f87d44c89" />
    <add assembly="Syncfusion.Compression.Base, Version= 33.1450.44, Culture=neutral, PublicKeyToken=3d67ed1f87d44c89" />
    <add assembly="Syncfusion.Linq.Base, Version= 33.1450.44, Culture=neutral, PublicKeyToken=3d67ed1f87d44c89" />
    <add assembly="Syncfusion.Olap.Base, Version= 33.1450.44, Culture=neutral, PublicKeyToken=3d67ed1f87d44c89" />
    <add assembly="Syncfusion.PivotAnalysis.Base, Version= 33.1450.44, Culture=neutral, PublicKeyToken=3d67ed1f87d44c89" />
    <add assembly="Syncfusion.Pdf.Base, Version= 33.1450.44, Culture=neutral, PublicKeyToken=3d67ed1f87d44c89" />
    <add assembly="Syncfusion.XlsIO.Base, Version= 33.1450.44, Culture=neutral, PublicKeyToken=3d67ed1f87d44c89" />
    <add assembly="Syncfusion.DocIO.Base, Version= 33.1450.44, Culture=neutral, PublicKeyToken=3d67ed1f87d44c89" />

    </assemblies>
</compilation>
Scripts and CSS initialization
The scripts and style sheets that are required to render the pivot chart control in a web application are mentioned below in an appropriate order:
- ej.web.all.min.css
- jQuery-3.0.0.min.js
- ej.web.all.min.js
Click here here to know more about scripts and style sheets available in online (CDN link).
Scripts and style sheets are referred under the <head> tag in the Default.aspx file.
<head>
    <link href="http://cdn.syncfusion.com/33.1.44/js/web/flat-azure/ej.web.all.min.css" rel="stylesheet" type="text/css" />
    <script src="http://cdn.syncfusion.com/js/assets/external/jquery-3.0.0.min.js" type="text/javascript"></script>
    <script src="http://cdn.syncfusion.com/33.1.44/js/web/ej.web.all.min.js" type="text/javascript"></script>
</head>
Control initialization
You can drag and drop the pivot chart control from the toolbox (under Syncfusion BI Web category) or manually define the control as shown in the following code sample of the “Default.aspx” page.
<%@ Register Assembly="Syncfusion.EJ.Pivot" Namespace="Syncfusion.JavaScript.Web" TagPrefix="ej" %>
<%@ Register Assembly="Syncfusion.EJ.Pivot" Namespace="Syncfusion.JavaScript.Models" TagPrefix="ej" %>

<html>
<head>
.....
.....
<style>
    #MyPivotChart1 {
        width:100%;
        height:460px;
    }
</style>
</head>
<body>
    <form runat="server">
        <ej:PivotChart ID="MyPivotChart1" runat="server" Url="/Relational" ClientIDMode="Static">
        <Size Width="100%" Height="460px"></Size>
        </ej:PivotChart>
        <asp:ScriptManager ID="ScriptManager1" runat="server"></asp:ScriptManager>
    </form>
</body>

</html>
The “Url” property in the pivot chart control points the service endpoint, where the data is processed and fetched in the form of JSON. The services used in the pivot chart control as endpoint are WCF and WebAPI.
NOTE
The above “Default.aspx” contains WebAPI URL, which is “/Relational”. If the WCF service is used as an endpoint, then the URL will look like “/RelationalService.svc”.
WebAPI
Adding a WebAPI controller
To add a WebAPI controller in an existing web application, right-click the project in the solution explorer and select Add > New Item. In the Add New Item window, select WebAPI Controller Class and name it “RelationalController.cs”, and then click Add.
Now, the WebAPI controller is added to the application with the “RelationalController.cs” file.
NOTE
While adding WebAPI controller class, add the mandatory suffix ‘Controller’. For example, in this demo, the controller is named as “RelationalController”.
Next, remove all existing methods such as “Get”, “Post”, “Put”, and “Delete” present in the RelationalController.cs file.
namespace PivotChartDemo
{
    public class RelationalController: ApiController
    {

    }
}
Adding the list of namespaces
The following are the list of namespaces to be added on top of the main class in the RelationalController.cs file.
using Syncfusion.JavaScript;
using Syncfusion.PivotAnalysis.Base;

namespace PivotChartDemo
{
    public class RelationalController : ApiController
    {

    }
}
Data source initialization
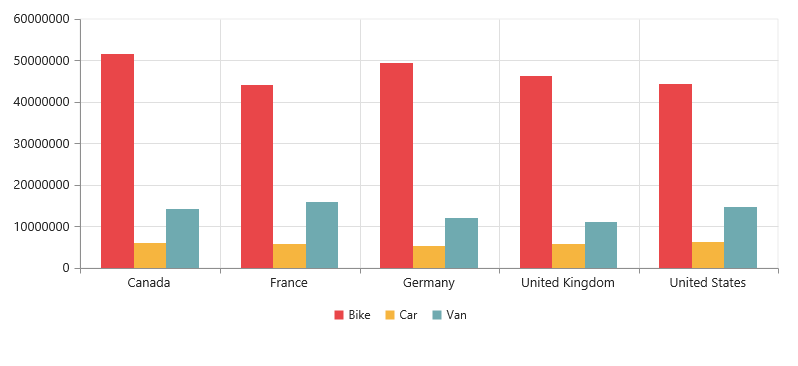
A simple collection is provided as a data source for the pivot chart in this demo section. This data source is placed inside a separate class “ProductSales” in the RelationalController.cs file. Refer to the following code example:
namespace PivotChartDemo {
    //....
    //....
    internal class ProductSales
    {
        public string Product
        {
            get;
            set;
        }

        public string Date
        {
            get;
            set;
        }

        public string Country
        {
            get;
            set;
        }

        public string State
        {
            get;
            set;
        }

        public int Quantity
        {
            get;
            set;
        }

        public double Amount
        {
            get;
            set;
        }

        public static ProductSalesCollection GetSalesData()
        {
            /// Geography
            string[] countries = new string[] { "Australia", "Canada", "France", "Germany", "United Kingdom", "United States" };
            string[] ausStates = new string[] { "New South Wales", "Queensland", "South Australia", "Tasmania", "Victoria" };
            string[] canadaStates = new string[] { "Alberta", "British Columbia", "Brunswick", "Manitoba", "Ontario", "Quebec" };
            string[] franceStates = new string[] { "Charente-Maritime", "Essonne", "Garonne (Haute)", "Gers" };
            string[] germanyStates = new string[] { "Bayern", "Brandenburg", "Hamburg", "Hessen", "Nordrhein-Westfalen", "Saarland" };
            string[] ukStates = new string[] { "England" };
            string[] ussStates = new string[] { "New York", "North Carolina", "Alabama", "California", "Colorado", "New Mexico", "South Carolina" };

            /// Time
            string[] dates = new string[] { "FY 2005", "FY 2006", "FY 2007", "FY 2008", "FY 2009" };

            /// Products
            string[] products = new string[] { "Bike", "Van", "Car" };
            Random r = new Random(123345345);

            int numberOfRecords = 2000;
            ProductSalesCollection listOfProductSales = new ProductSalesCollection();
            for (int i = 0; i < numberOfRecords; i++)
            {
                ProductSales sales = new ProductSales();
                sales.Country = countries[r.Next(1, countries.GetLength(0))];
                sales.Quantity = r.Next(1, 12);
                /// 1 percent discount for 1 quantity
                double discount = (30000 * sales.Quantity) * (double.Parse(sales.Quantity.ToString()) / 100);
                sales.Amount = (30000 * sales.Quantity) - discount;
                sales.Date = dates[r.Next(r.Next(dates.GetLength(0) + 1))];
                sales.Product = products[r.Next(r.Next(products.GetLength(0) + 1))];
                switch (sales.Product)
                {
                    case "Car":
                        {
                            sales.Date = "FY 2005";
                            break;
                        }
                }
                switch (sales.Country)
                {
                    case "Australia":
                        {
                            sales.State = ausStates[r.Next(ausStates.GetLength(0))];
                            break;
                        }
                    case "Canada":
                        {
                            sales.State = canadaStates[r.Next(canadaStates.GetLength(0))];
                            break;
                        }
                    case "France":
                        {
                            sales.State = franceStates[r.Next(franceStates.GetLength(0))];
                            break;
                        }
                    case "Germany":
                        {
                            sales.State = germanyStates[r.Next(germanyStates.GetLength(0))];
                            break;
                        }
                    case "United Kingdom":
                        {
                            sales.State = ukStates[r.Next(ukStates.GetLength(0))];
                            break;
                        }
                    case "United States":
                        {
                            sales.State = ussStates[r.Next(ussStates.GetLength(0))];
                            break;
                        }
                }
                listOfProductSales.Add(sales);
            }
            return listOfProductSales;
        }

        public override string ToString()
        {
            return string.Format("{0}-{1}-{2}", this.Country, this.State, this.Product);
        }

        public class ProductSalesCollection : List<ProductSales> { }
    }
}
Service methods in WebAPI controller
Define the service methods in the RelationalController class, find inside the RelationalController.cs file which was created while adding the WebAPI controller class to the application.
namespace PivotChartDemo {
    public class RelationalController: ApiController {
        PivotChart pivotChart = new PivotChart();

        [System.Web.Http.ActionName("InitializeChart")]
        [System.Web.Http.HttpPost]
        public Dictionary<string, object> InitializeChart(Dictionary<string, object> jsonResult)
        {
            this.BindData();
            return pivotChart.GetJsonData(jsonResult["action"].ToString(), ProductSales.GetSalesData());
        }

        [System.Web.Http.ActionName("DrillChart")]
        [System.Web.Http.HttpPost]
        public Dictionary<string, object> DrillChart(Dictionary<string, object> jsonResult)
        {
            this.BindData();
            return pivotChart.GetJsonData(jsonResult["action"].ToString(), ProductSales.GetSalesData(), jsonResult["drilledSeries"].ToString());
        }

        private void BindData()
        {
            this.pivotChart.PivotEngine.PivotRows.Add(new PivotItem { FieldMappingName = "Country", FieldHeader = "Country", TotalHeader = "Total" });
            this.pivotChart.PivotEngine.PivotRows.Add(new PivotItem { FieldMappingName = "State", FieldHeader = "State", TotalHeader = "Total" });
            this.pivotChart.PivotEngine.PivotColumns.Add(new PivotItem { FieldMappingName = "Product", FieldHeader = "Product", TotalHeader = "Total" });
            this.pivotChart.PivotEngine.PivotCalculations.Add(new PivotComputationInfo { CalculationName = "Amount", Description = "Amount", FieldHeader = "Amount", FieldName = "Amount", Format = "C", SummaryType = Syncfusion.PivotAnalysis.Base.SummaryType.DoubleTotalSum });
        }
    }
    .....
    ..... // Datasource initialize
    .....
}
Configure routing in global application class
To add a Global.asax in your existing web application, right-click the project in the solution explorer and select Add > New item. In the Add New Item window, select Global Application class and name it “Global.asax”, and then click Add.
After adding the Global.asax file, delete all methods in the Global class and add the namespace “using System.Web.Http;”, and then configure the routing as shown in the following code example.
public class Global : System.Web.HttpApplication
{
    protected void Application_Start(object sender, EventArgs e)
    {
        GlobalConfiguration.Configuration.Routes.MapHttpRoute(
            name: "DefaultApi",
            routeTemplate: "{controller}/{action}/{id}",
            defaults: new { id = RouteParameter.Optional });
        AppDomain.CurrentDomain.SetData("SQLServerCompactEditionUnderWebHosting", true);
    }
}
Now, the pivot chart will be rendered with amount over a set of products across different customer geographic locations.
WCF
This section demonstrates the utilization of WCF service as endpoint binding the relational data source to a simple pivot chart. For more details on this topic, click here.